As a long-time user of SolarWinds Network Performance Monitor (NPM), I was quite excited to review the latest 12.0 release of the NPM product.
We’re going to jump into a Detailed SolarWinds Network Performance Monitor Review and look at all the new features it has to offer!
The new features add immense value to the already-robust management suite, validating its recent champion ranking in our Network Management Software Smackdown.
New Features, Capabilities & Improvements:
- Brand new UI
- NetPath Services
- Network Insight for F5® BIG-IP®
- Cisco Switch Stack monitoring
- ServiceNow® Integration
- Updated Discovery
- Performance Improvements
- More…
EVERY NODE. EVERY PATH. EVERY NETWORK.
This is the statement SolarWinds is making with its latest release of NPM.
The Easy and powerful interface adds immediate value upon installation – it’s intuitive, no-training-required interface, extends UX seamlessly across the SolarWinds product portfolio.
Below I’ll provide my review of what I consider to be the top 3 features and enhancements with SolarWinds Network Performance Monitor (NPM) 12.0.
1. Sleek, Modernized UI for Admins & Engineers!
This has been a long time coming; SolarWinds Network Performance Monitor got a makeover, and she’s looking better than ever!
The entire user interface has been revamped, with new navigation schemes and streamlined access to the most important components.
This is a minimalist approach to a maximalist solution, eliminating noise to narrow your focus on what’s most important.
Users familiar with the previous versions of NPM are accustomed to the tabular menu, where a separate menu bar was associated with each tab.
Each user can have customized menu bars, and administrators can control which tabs each user will see. For many reasons, this tabular menu has proven to be cumbersome and non-intuitive, leading SolarWinds to redesign for user friendliness.
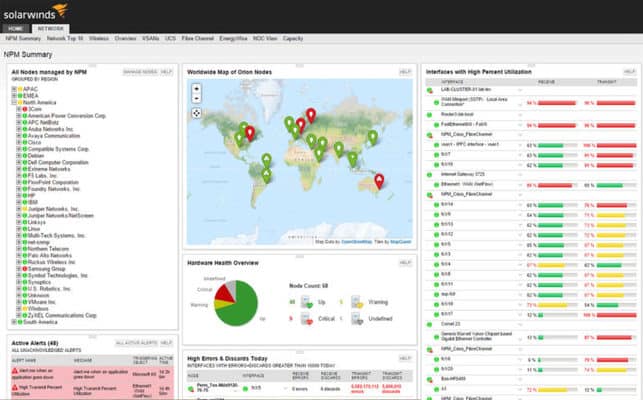
Old UI

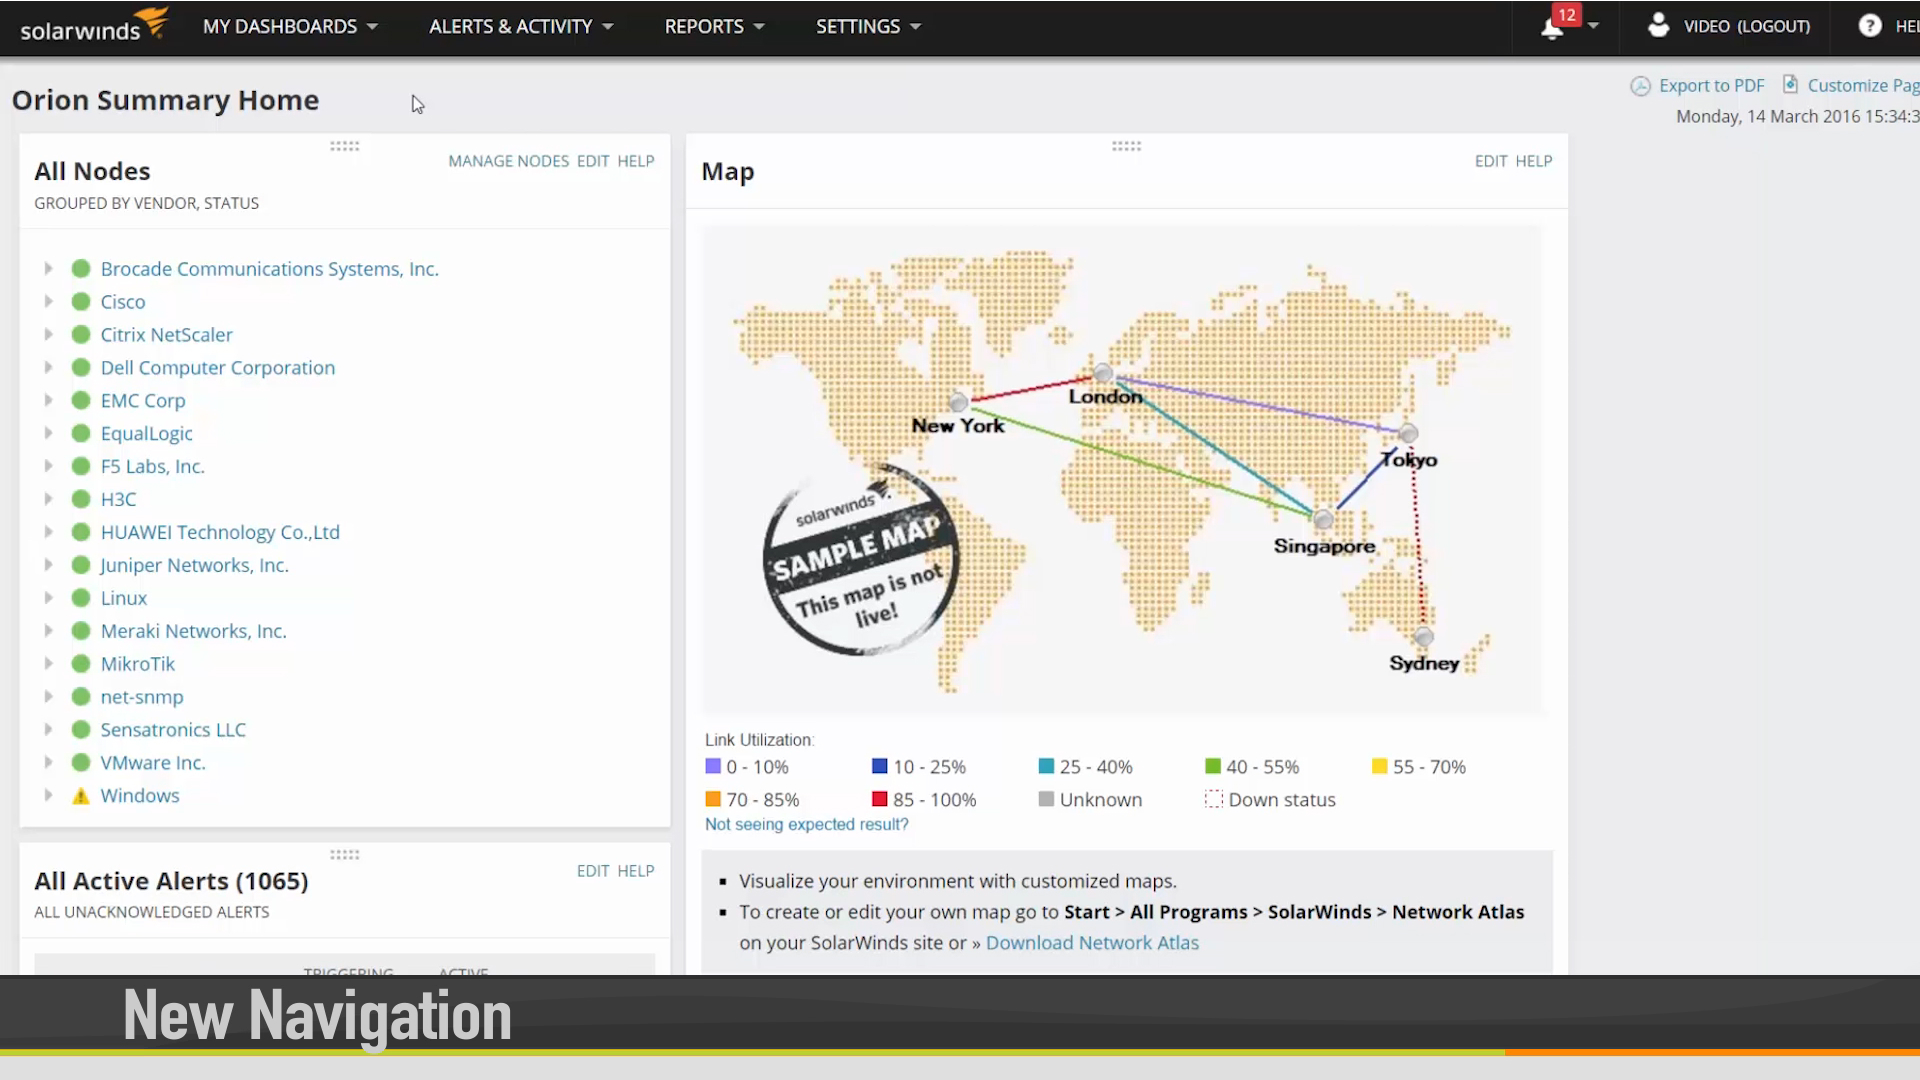
With Orion NPM 12.0, we see a new UI with navigation consuming much less real estate. The top navigation bar is simple and elegant, comprised of the most important top-level menu items: My Dashboards, Alerts & Activity, Reports, and Settings. This is reflective of the direction SolarWinds is moving to, truly focusing on user experience.
New UI

My Dashboard
The new navigation scheme takes advantage of dashboards, condensing the menu-bar sprawl seen in previous versions into a single, bird’s eye view drop-down.
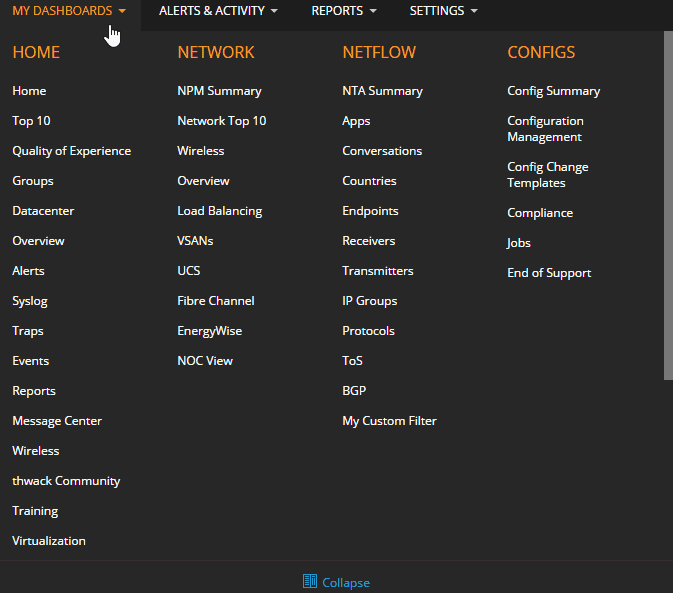
As you can see, this view can get out-of-hand once you start adding additional modules.
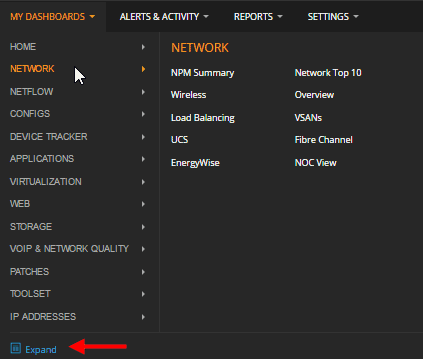
This is the reason for the “Collapse” button at the bottom of the menu.
To make better use of the My Dashboards space, you can collapse to an optimized view.
Personally, this is likely the view that I’ll use by default.
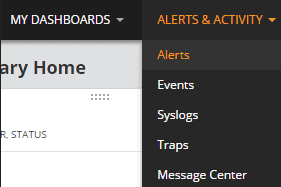
Alerts & Activity
You now have a completely customizable, quick top-menu access to actionable events and alerts. By default you’ll see the following under this menu, but you can effortlessly add more items as needed.
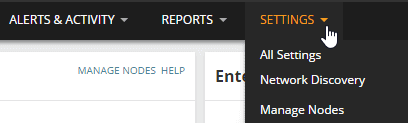
Settings
Again, completely customizable, you now have immediate access to all settings, or to specific areas of the settings that you frequent the most. No more clicking through a series of menus for some of these common tasks like adding nodes.
People are typically nervous about interface changes – there is no need to fret, as SolarWinds has done an excellent job at mapping familiar menus to the new schema. SolarWinds says users who had early access raved about the improvements, and after my “insider’s look” at the product, I personally love the new UI.
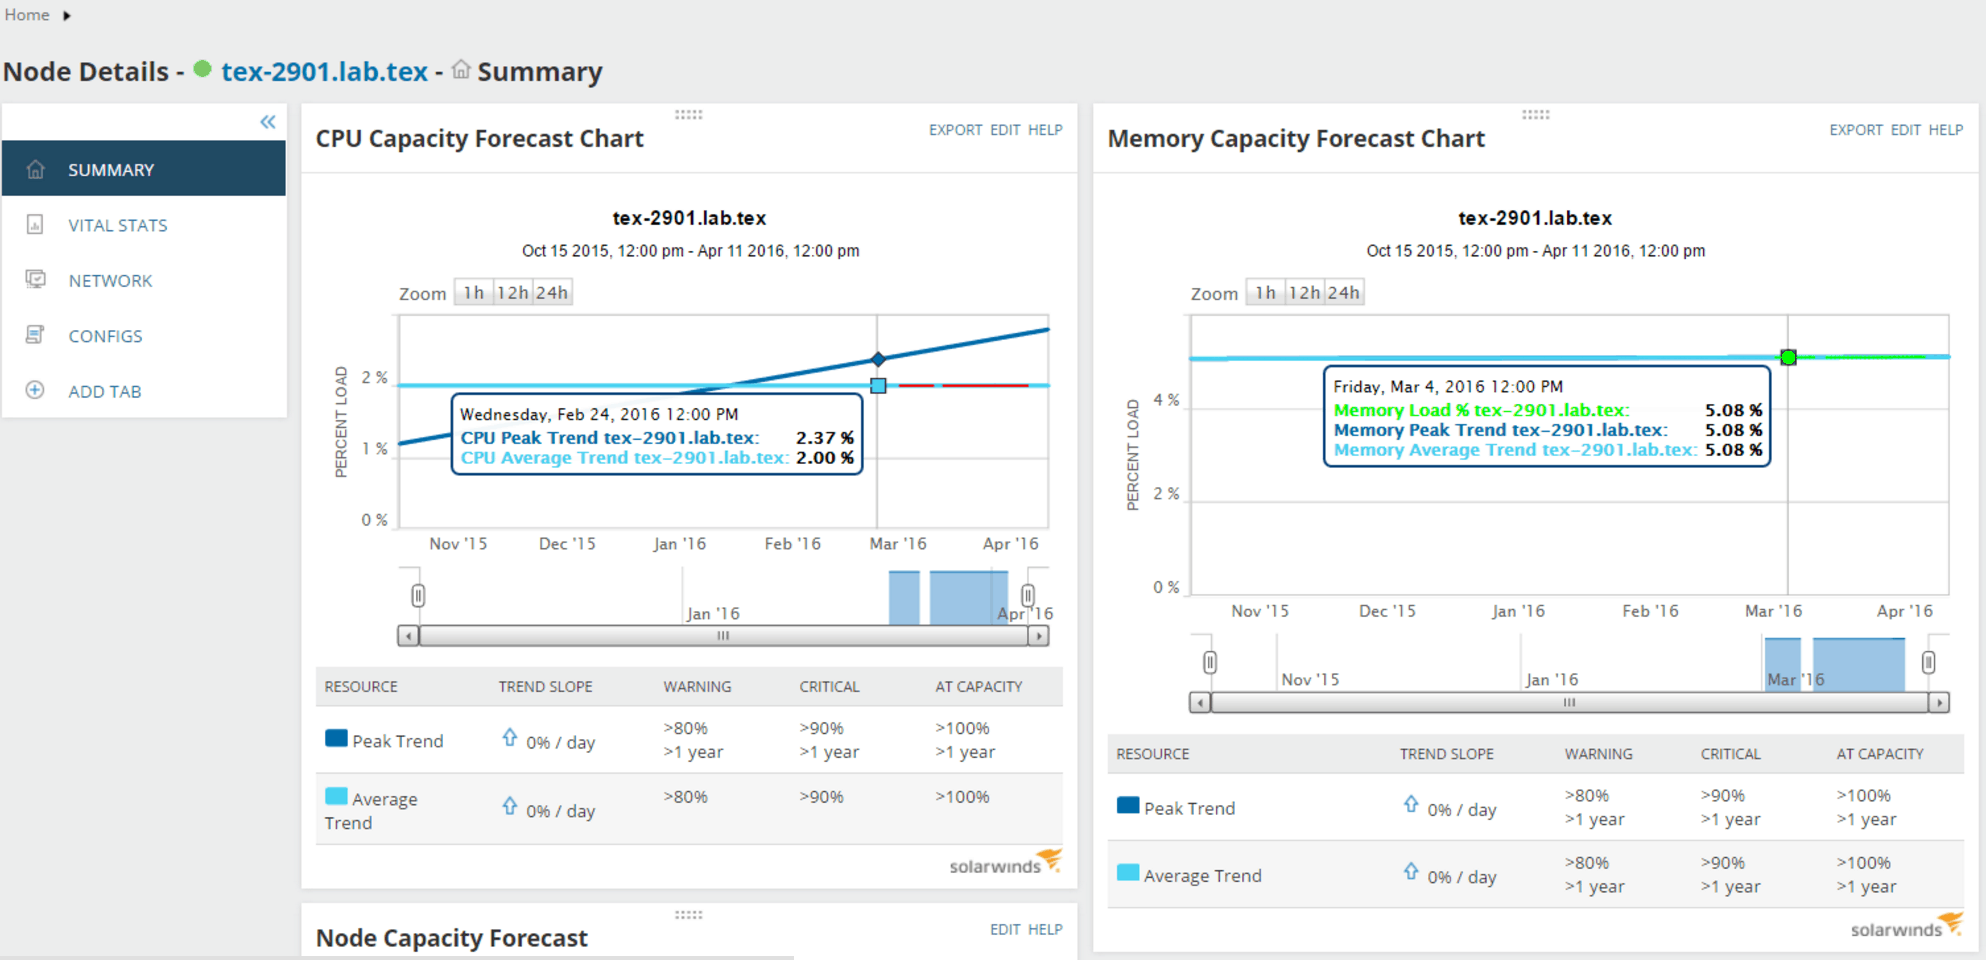
Consistency:
There is much more than just navigation. The entire look and feel of Orion has modernized. The backend style sheets have been updated not only for appearance, but also for productivity. Graphs, charts and icons across the entire system have been refreshed. Consistency is important, meaning you’ll see the same theme across the entire system.
Learn more with this brief video:
2. NetPath Services
“The internet is complex.”
NetPath was conceived from the simple notion above. With a growing number of companies moving applications to the cloud and having them delivered as a service, end-to-end visibility is paramount in order to better understand where issues could arise. Myths around cloud, “don’t worry about it, it just works,” are foolish to say the least. When users start complaining that Salesforce is slow, how can you troubleshoot and identify what’s actually going on? Enter NetPath.
One simple word: WOW! NetPath is one of the most exciting features I’ve seen from SolarWinds. It allows you to visualize, discover and troubleshoot network paths hop-by-hop. It also provides detailed visibility, not only within your own network, but also the network outside of your organization. This makes it easier to answer those questions about application performance, no matter where the application is hosted. The short falls of traceroute free tool are expertly overcome with NetPath.
What’s happening?
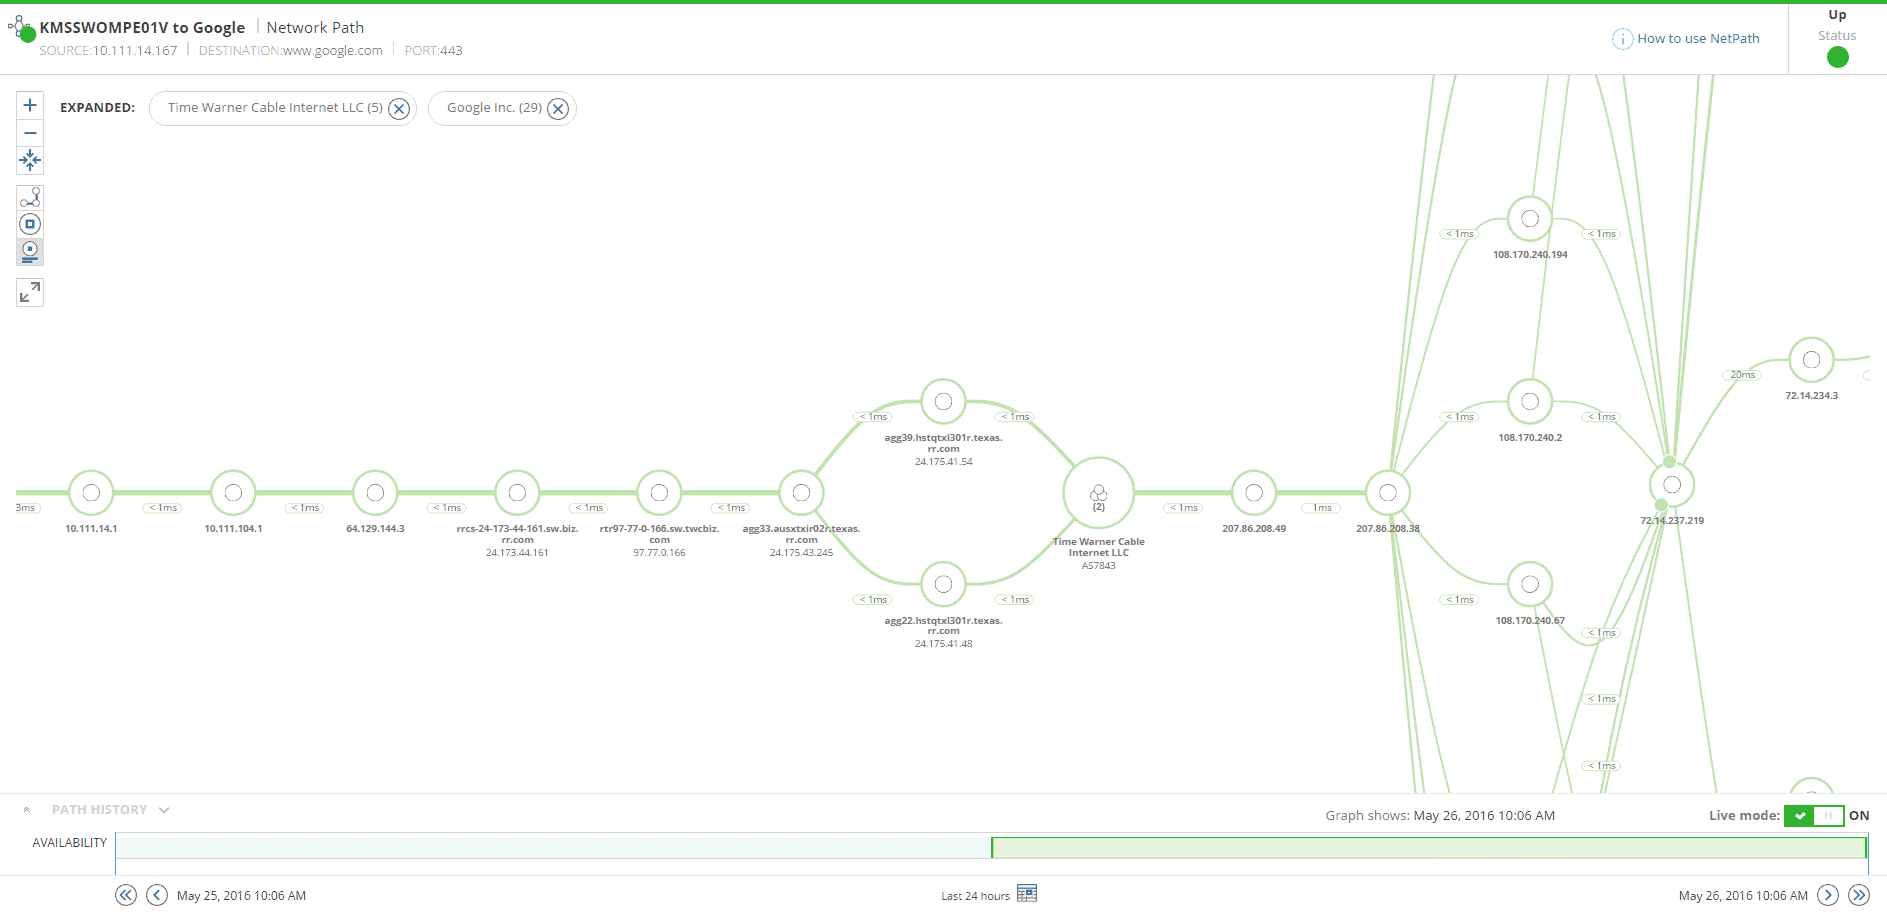
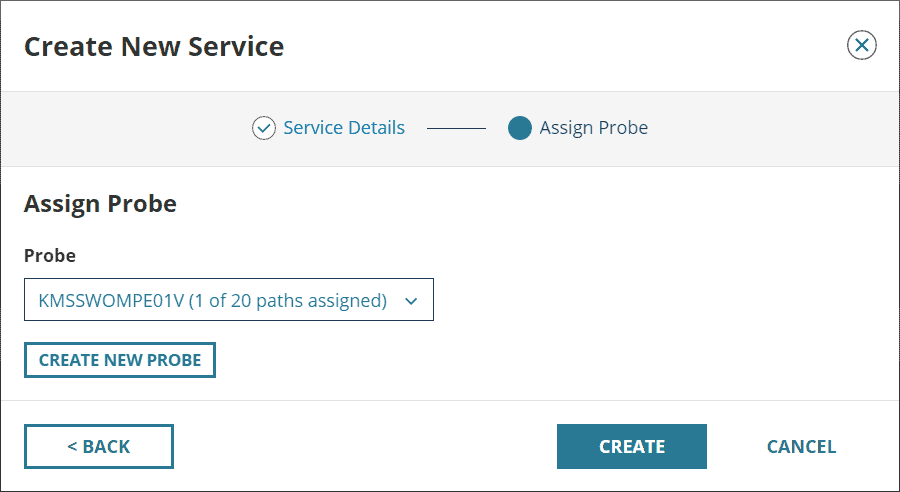
NetPath probes are deployed in your infrastructure. These can be on general-purpose Windows workstations, servers in Data Centers, or on your Orion pollers. These probes talk to NPM, reporting detailed statistics and metrics regarding the path between itself and the destination you configure. For example, you can configure a NetPath to Facebook.com and the probe will dynamically map out, hop-by-hop, the detailed path to that destination. This includes your internal infrastructure, but more importantly, the infrastructure outside your organization. Nearly 80% of the public Internet is multi-path, so NPM’s NetPath discovers and displays this information in a collapsible and interactive interface, essentially mapping the Internet.
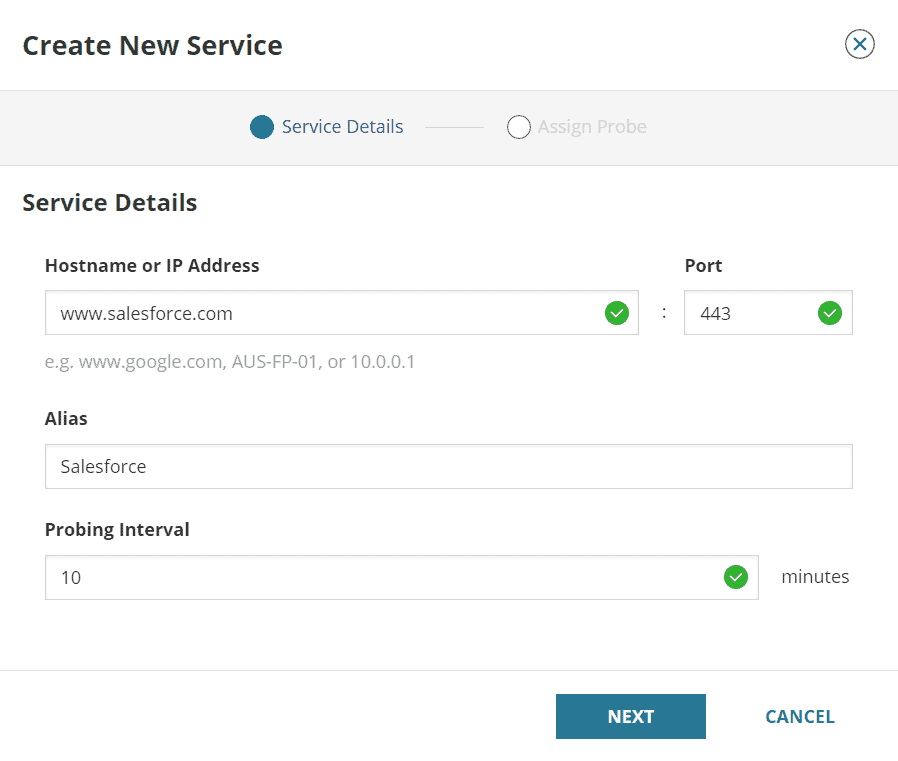
Creating NetPaths
By default, NPM will ship with “www.Google.com” configured as a NetPath. You will be able to drill down into the massive network between you and Google. This is great if you’re using Google as a cloud provider for apps like Gmail or Google Docs. Let’s say you’re using several SaaS applications, such as Salesforce or SAS – building a NetPath to these services is a breeze. Setting one up myself, with no prior experience, took less than 60 seconds.
What does this get you?
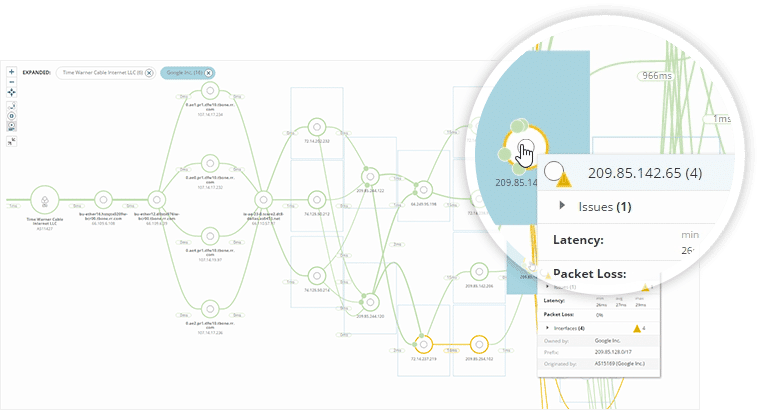
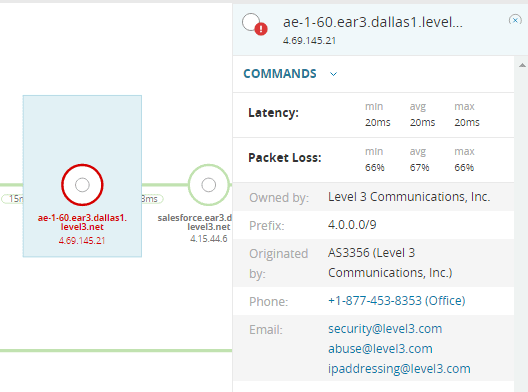
Once your NetPaths are setup, maps are automatically built showing detailed information within your internal network, traversed segments of the ISP network(s), and the destination network. Hone in on particular nodes within the network to gather status, statistics, and support information.

Maximum levels of details are provided end-to-end. NetPath monitors the configured paths at regular intervals, keeping historical data on each individual hop.
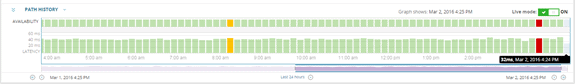
Look back on incidents and find out exactly where in the network the issue arose. Which ISP is responsible, and how do you contact them? This information is at your fingertips, parsed using public databases that ISP operators are required to update.
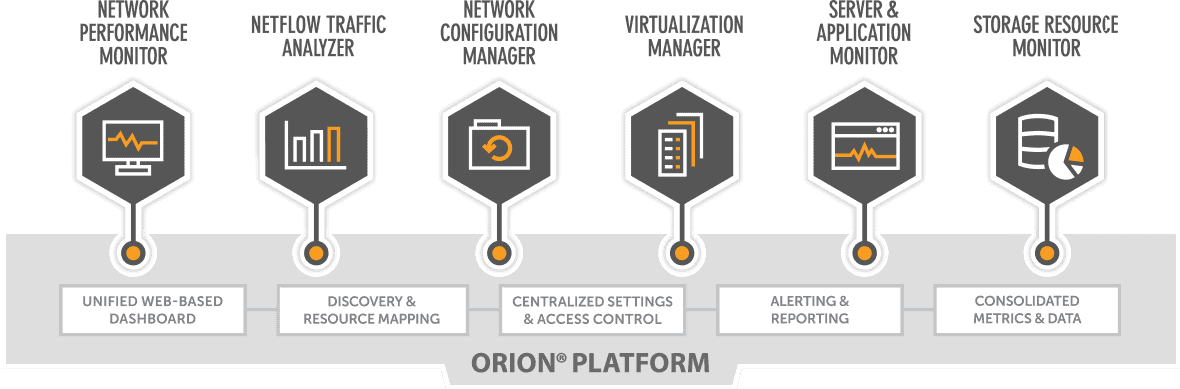
NCM & NTA Integration
One of my complaints with SolarWinds in the past is lack of integration between modules. You would expect seamless tie-in between modules you purchase, but that historically isn’t the case. We have started to see these integrations over the last couple versions of NPM, and I’m happy to see that NPM’s NetPath is utilizing the Network Configuration Manager (NCM) and NetFlow Traffic Analyzer (NTA) modules!
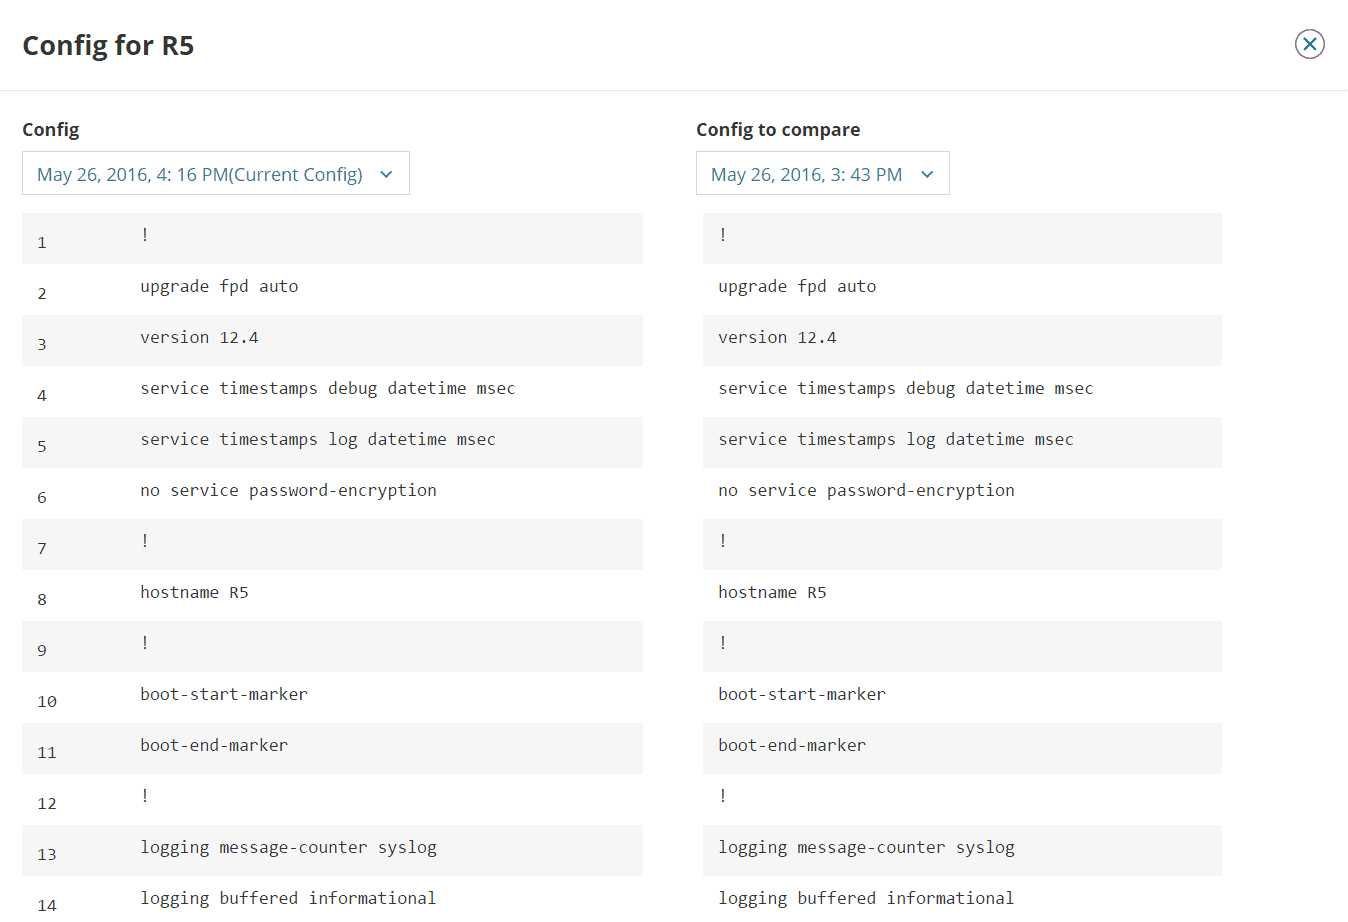
This means we’ll be able to see network configuration changes as potential culprits within the path. Amazing!
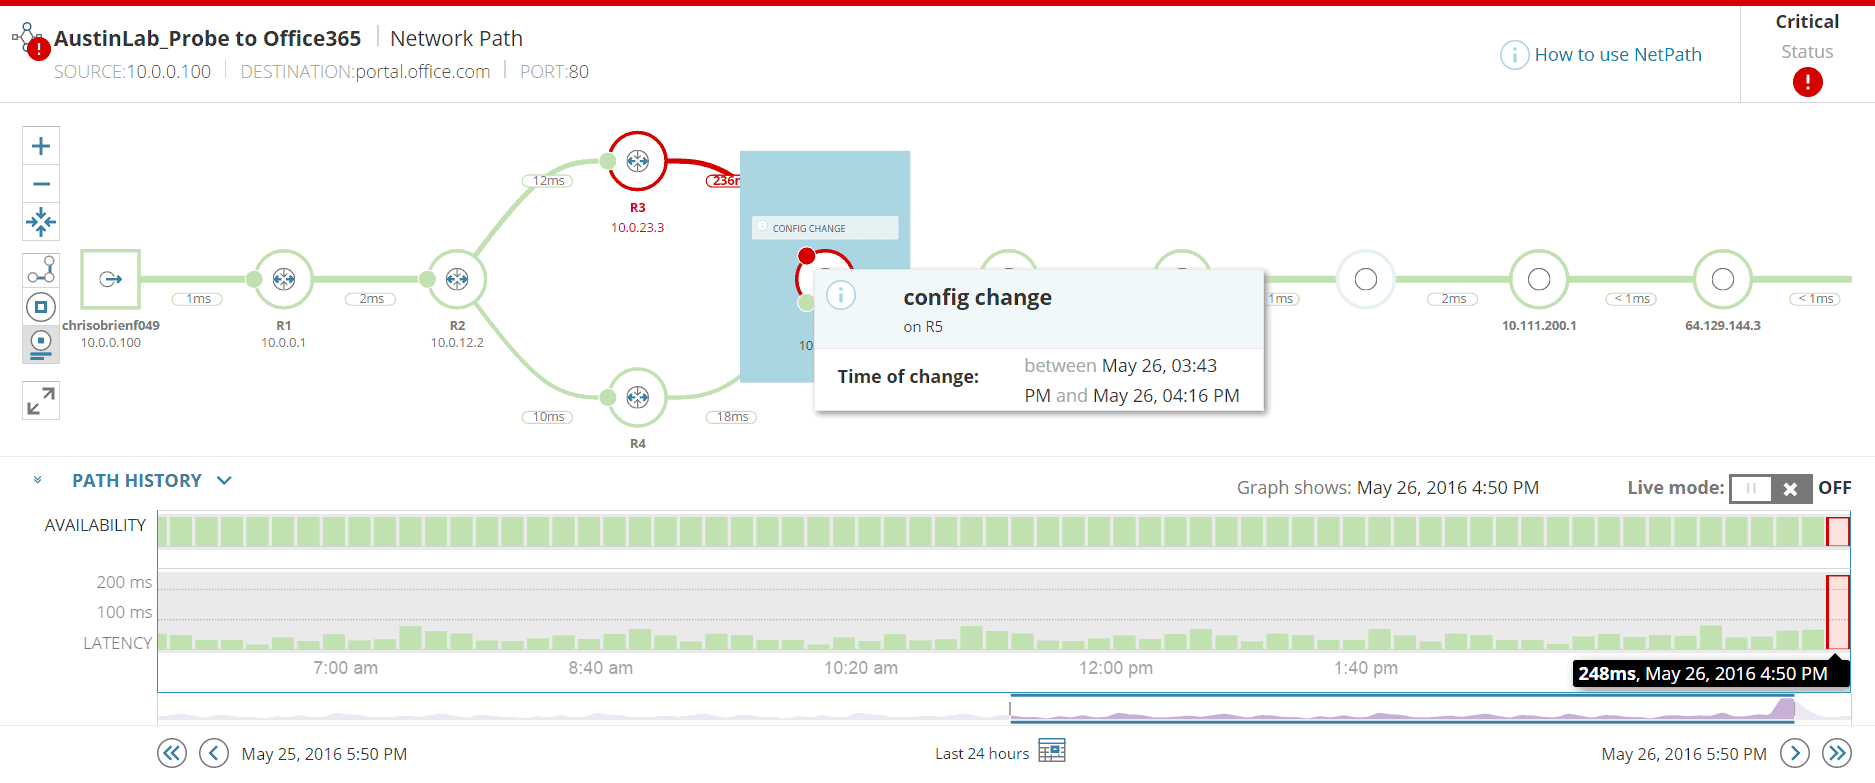
Quickly pull up a config diff to see what changed.
Reporting
Reports are dynamically baselined. If latency goes up on a few links, but it doesn’t impact overall end-to-end RTT, nothing will be reported.
3. Network Insight for F5® BIG-IP® load balancers
Along the same trend of deep visibility, SolarWinds adds comprehensive F5 monitoring with Network Insight. At first breath, previous users of NPM may not think this to be anything new, for NPM could monitor F5 devices for standard health and performance in prior versions. I’m here to tell you that Network Insight is radically more advanced than anything NPM was doing before, as exemplified by its ability to:
– Monitor health, performance and availability of all components that comprise your F5 application, including IPs, virtual servers, pools and pool members.
– Automatically visualize relationships and dependencies between these components
– Individually identify components contributing to issues, outages or performance degradation.
Visualize your F5 Environment
From a high level view you can measure the overall health of your F5 environment to include Global Traffic Managers (GTM), Local Traffic Managers (LTM), and the virtual servers, services, pools and members within.
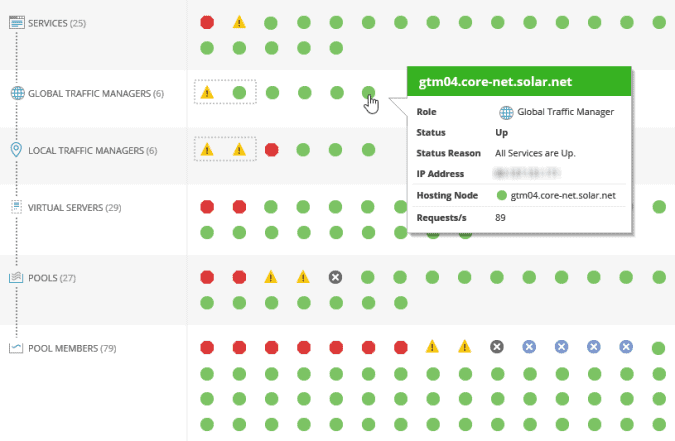
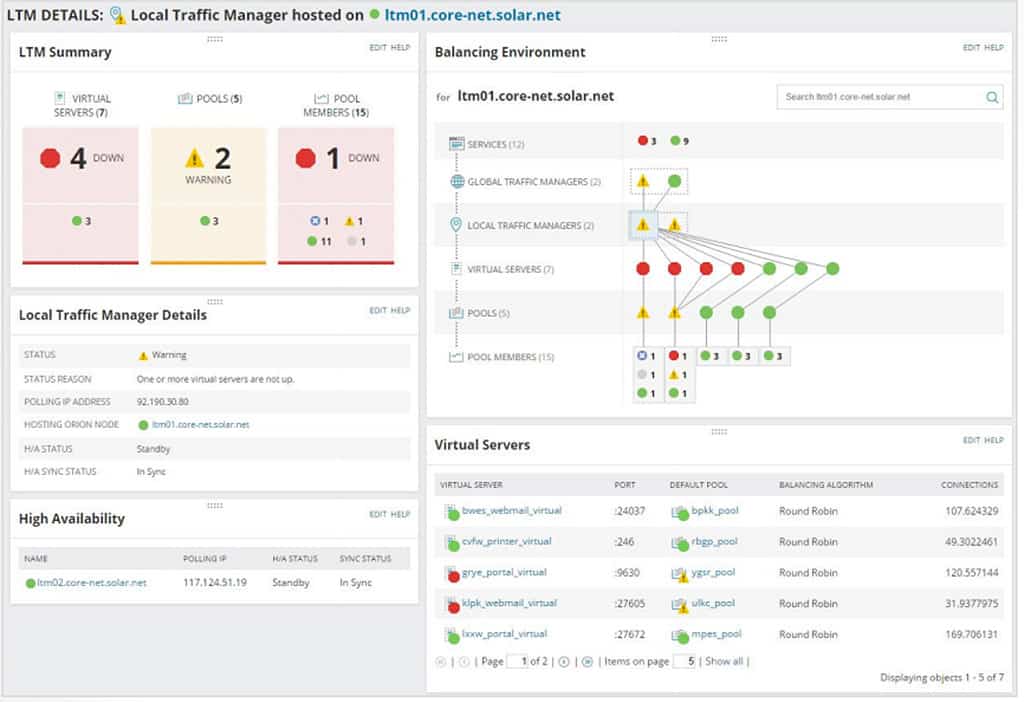
Click on an individual F5 GTM or LTM to be presented with a detailed summary page for that individual F5 load balancer. You’ll immediately notice that SolarWinds is going beyond standard statistics.
Visualize your individual F5 applications
Drill down into individual applications by graphically displaying the relationship between components in a friendly topology. These mappings are automatically created and dynamically updated, showing full service delivery (node health, pools, virtual servers, global traffic managers, etc.).
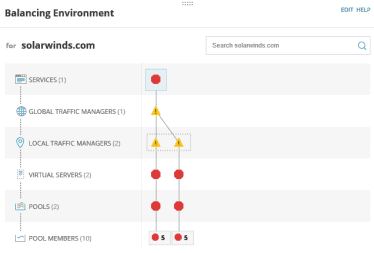
This map is extraordinarily helpful when visualizing load-balanced applications, especially for the application teams that don’t necessarily have direct access to the F5 environment.
Troubleshooting
The map is interactive, enabling you to quickly view concurrent connections, performance metrics, reasons for outages, and so on. Simply scroll over components to get more information.
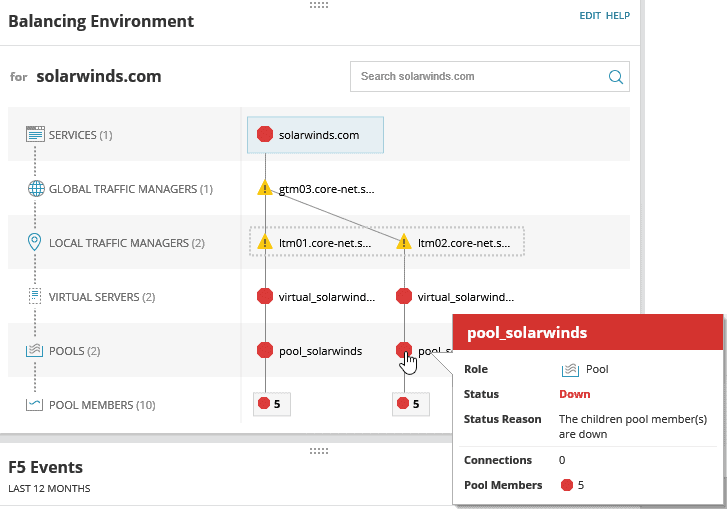
In the example above, we see that the F5 application for “solarwinds.com” is down. Hovering over the pool reveals that all five pool-members are down. Hovering over the members reveals the reason why they are down.
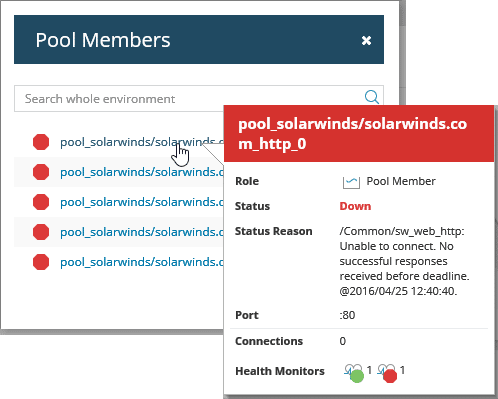
Notice the two health monitors above. One is green, the other red. The green one is ICMP, stating that the pool members are still reachable. The red one is HTTP, stating that the F5 health monitor is unable to reach the applications successfully over HTTP. Servers are up, but the web services are not responding.
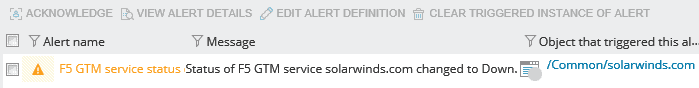
Alerts & Reporting
Straight from the NPM 12.0 documentation, Network Insight for F5 BIG-IP includes the following new alerts:
– Health Monitor on F5 LTM Down
– F5 GTM service status changed (enabled by default)
– F5 LTM Pool goes down
– F5 pool has less than 30% of active servers
– Alert me when server is not up
– Alert me when virtual IP address is not up
– Alert me when virtual server is not up (enabled by default)
– H/A synch status of F5 Device changed
It also includes these new F5-specific reports:
– Average LTM Connections over Last 30 Days
– Average Service Availability over Last 30 Days
– Average Service Resolutions per Second over Last 30 Days
– Average Virtual Server Availability over Last 30 Days
These alerts are typically sent via email and can be viewed under Alerts & Activity > Alerts within the NPM dashboard.
Future of Network Insight
Network Insight’s initial implementation focuses on F5, but plans are to expand this. With the undoubted success Network Insight for F5 BIG-IP will bring, it’s possible to see this expanded to include additional components of the F5, such as Advanced Firewall Manager (AFM). I’d expect other vendors to be added in the future, as well as other services like NGFW and WAAS.
More love for F5 with additional NCM features
Customers using the Network Configuration Manager (NCM) module of SolarWinds will be pleased to learn about the new support for F5 LTM and GTM.
– Backup and restore F5 User Configuration files (UCS)
– Compile F5 inventory reports
– Built-in DISA STIG Compliance reports for F5s
Conclusion
These latest enhancements to SolarWinds NPM are proof that the company is evolving away from being just an element manager by going deeper into applications, multi-path networks and user experience. SolarWinds, as a company, is growing with its customers, quickly expanding capabilities as needs demand. Likewise, customers are growing with SolarWinds. Small shops can easily scale out and add value as they become larger with increased demands for visibility, alerting, troubleshooting and performance trending.
NPM 12.0 is extending complete visibility for hybrid IT via NetPath and Network Insight.
What next?
If you’re already using SolarWinds NPM, continue reading below regarding upgrade and deployment guides. If you’re new to SolarWinds, take a look at the interactive demo on their site. I highly recommend downloading the free 30 day trial to test on your own network. Once you’re ready to commit, licensing starts at $2,895 (USD), to monitor 100 interfaces. This cost will increase as you add functionality with various modules, such as IP Address Manager (IPAM), Network Configuration Manager (NCM), just to name a few.
Resources
Deployment:
Documentation:
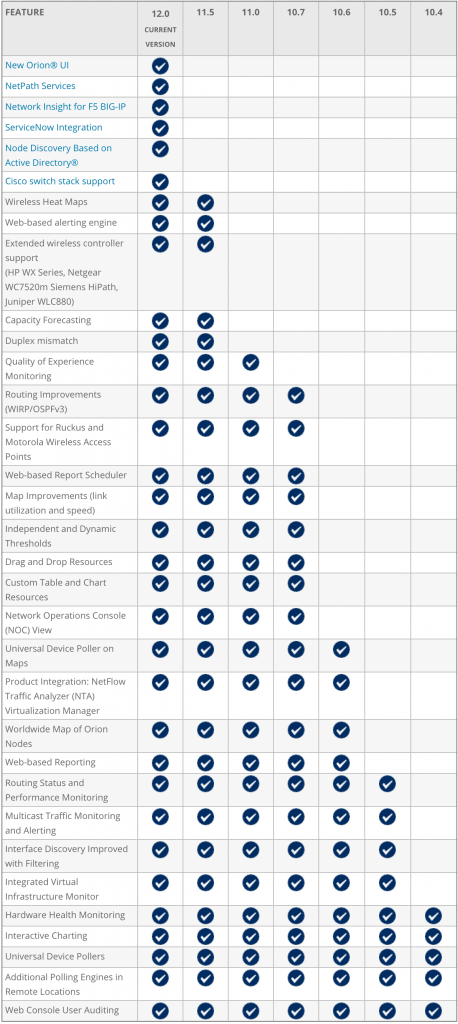
New Feature Comparison
SolarWinds NPM FAQs
What types of network devices and infrastructure can be monitored with SolarWinds NPM?
SolarWinds NPM can monitor a wide range of network devices and infrastructure, including routers, switches, firewalls, servers, wireless access points, and virtualized environments.
What types of metrics can be monitored with SolarWinds NPM?
SolarWinds NPM can monitor a wide range of network performance metrics, including bandwidth utilization, network traffic, latency, packet loss, and error rates.
What types of reports can be generated with SolarWinds NPM?
SolarWinds NPM can generate a wide range of reports, including performance reports, availability reports, inventory reports, and trend analysis reports.
Can SolarWinds NPM be integrated with other network management tools?
Yes, SolarWinds NPM can be integrated with other network management tools, such as network configuration management tools, network traffic analysis tools, and cloud monitoring tools.
What types of notifications and alerts can be generated with SolarWinds NPM?
SolarWinds NPM can generate a range of notifications and alerts, including email notifications, SMS alerts, and alerts to other monitoring tools and services.
How can organizations get started with SolarWinds NPM?
Organizations can get started with SolarWinds NPM by downloading and installing the software, configuring the tool to monitor their network devices and infrastructure, and setting up automated monitoring and alerting systems.