Our website relies on funding from our readers, and we may receive a commission when you make a purchase through the links on our site.
The Best Network Monitoring & Management Software & Tools
There are two types of network monitors – those that watch over network devices and head off errors that can cause performance impairment and those that analyze traffic patterns.
Both of these systems will help you to avoid problems that cause the network to seize up. It is rare to find one tool that can provide both options.
Here is our list of the best network monitoring and management software and tools:
- Auvik – EDITOR’S CHOICE This cloud-based package provides network discovery that creates a hardware inventory and a map. The system then implements continuous device status monitoring with SNMP and traffic monitoring with flow protocols. Network management features include a network configuration manager. Access a 14-day free trial.
- Progress WhatsUp Gold – FREE TRIAL A network device monitor that installs on Windows Server and can be expanded by add-ons, among which is a traffic analysis system. Get a 30-day free trial.
- AdRem NetCrunch – FREE TRIAL A full-stack monitoring tool that provides visibility into your devices, processes, services, applications, events, and logs, without requiring any complex agent installation. Start a 30-day free trial.
- Paessler PRTG – FREE TRIAL A comprehensive monitoring tool that stays on top of devices, bandwidth, usage, and more, to send alerts on critical issues. Start a 30-day free trial.
- ManageEngine OpManager – FREE TRIAL This package provides monitoring for network devices and servers and is also a good system for monitoring virtualizations. Available for Windows Server, Linux, AWS, and Azure. Start a 30-day free trial.
- Site24x7 Network Monitoring – FREE TRIAL This package provides Docker container monitoring as part of a full-stack monitoring platform that is delivered from the cloud. Start a 30-day free trial.
- Datadog Network Monitoring This SaaS platform offers both traffic management and device status monitoring. Subscribe to either or both.
- Obkio An end-to-end network monitoring tool that uses agents to monitor your networks, applications, devices, services, user experience, and more.
- OpenNMS Horizon A free, open-source network management system that runs on Linux and implements both network device status tracking and traffic analysis.
- Atera A package of services that is designed for use by managed service providers and includes remote network monitoring. Delivered from the cloud.
- Fortra Intermapper A network monitor that is based around a series of network topology views. Available for Windows, macOS, and Linux.
- AppNeta Performance Monitor Get live statistics on networks and Web application performance with this package that is delivered from the cloud.
- SolarWinds Network Performance Monitor This on-premises package installs on Windows Server and monitors the statuses and activities of network devices to get a full picture of network readiness.
You can read more about these systems in the following sections.
The best Network Management/Monitoring tools
Our methodology for selecting network monitoring tools and software
We reviewed various monitoring tools and analyzed the options based on the following criteria:
- An autodiscovery system to log all network devices
- A network topology mapper
- The ability to collect live network device statuses by using SNMP
- A facility to analyze network performance over time
- Graphical interpretation of data, such as charts and graphs
- A free trial period, a demo, or a money-back guarantee for no-risk assessment
- A good price that reflects value for money when compared to the functions offered
1. Auvik – FREE TRIAL
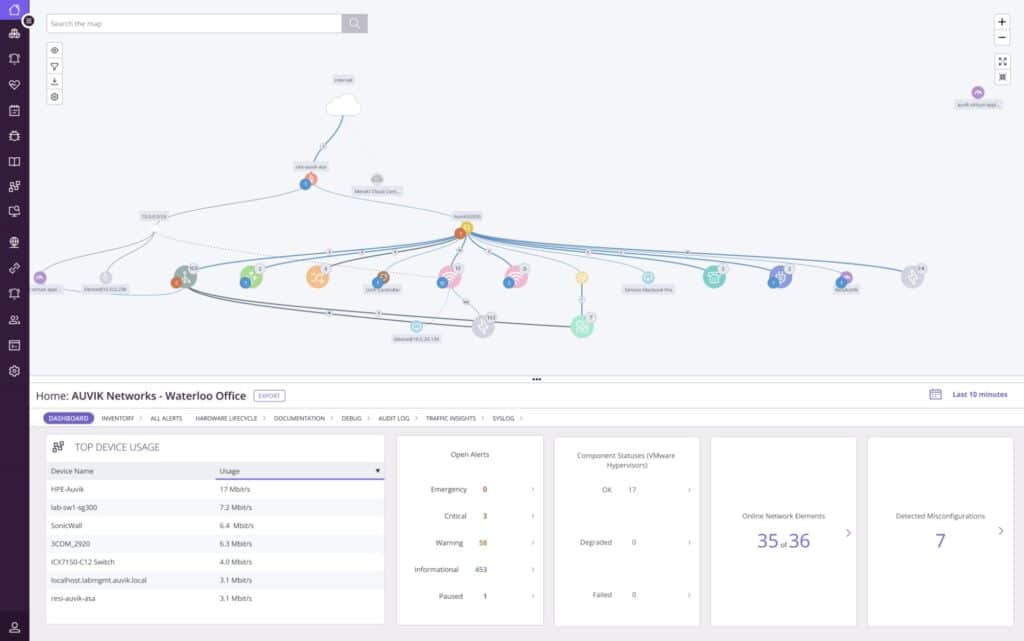
Auvik is a cloud-based network monitoring and management package that is available in versions for use by IT departments and managed service providers. The system includes a discovery routine that scans the network periodically to generate a constantly up to date hardware inventory and network map. The package implements both network device status monitoring and traffic analysis.
Key Features:
- Network discovery
- Network inventory and topology map
- Device status monitoring with SNMP
- NetFlow, IPFIX, J-Flow, and sFlow for traffic analysis
- Network configuration management
Why do we recommend it?
The cloud-based Auvik platform can monitor any network anywhere in the world. You can monitor multiple sites in one account and if you get the MSP version, you can monitor the systems of multiple businesses. This tool will document the network and then perform continuous, automated monitoring, maximizing your investment in high-priced personnel.
The package installs a data collector in a server on the network that is going to be monitored. This kicks off a scan and the results that come back from that each get uploaded to the Auvik cloud server where they are processed.
Auvik creates a network inventory, which forms the main console for system monitoring. The package also generates a network topology map. The inventory details of each device include a list of interfaces, whether they are in use, and the capacity of each.
The package uses the Simple Network Management Protocol (SNMP), which is able to gather status reports from device agents – every network device provider installs one of these agents on their products.
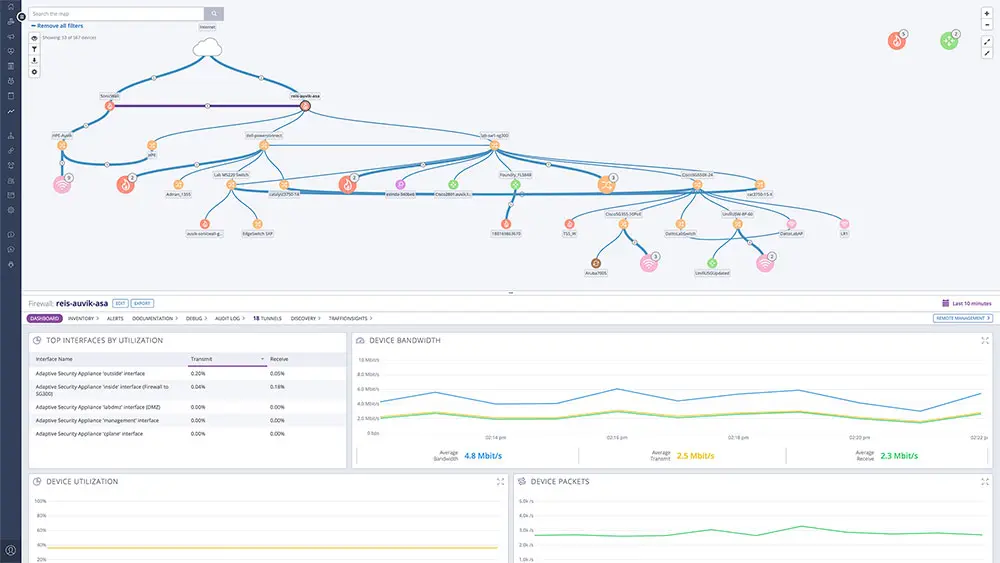
You can get a view on the traffic patterns on your network. This is a great tool for identifying bottlenecks where a switch interface is receiving more traffic than its capacity can handle. This investigation is automated and is implemented through flow protocols. The Auvik system can communicate with NetFlow, IPFIX, J-Flow, and sFlow. This service can help you spot overloaded devices, which is the main cause of dropped packets and irregular traffic sequencing, such as jitter.
Who is it recommended for?
This package is suitable for any type and size of business that runs a network. The system is particularly useful for squeezing maximum value out of existing network infrastructure. It can show you which times in the day or week get excessive traffic so that you can move tasks to out-of-hours periods.
Pros:
- Protocol analysis to identify which applications generate the most traffic
- Alerts for device component failure
- Network configuration backup
- Spots overloaded switches
- A cloud-based system that can watch over networks everywhere
Cons:
- No price list
Auvik doesn’t publish a price, so you have to contact the business to request a quote. You can access a 14-day free trial to test the Auvik package.
EDITOR'S CHOICE
Auvik is our top pick for a network monitoring and management tool because it implements automated network monitoring of any LAN anywhere from its cloud platform. This package implements network discovery, resulting in a network inventory and topology map, which are constantly updated. The service scans the network with SNMP and receives device status reports. It also accepts emergency warnings from device agents and displays these as alerts in the system console. Another feature in this package provides traffic analysis with IPFIX, NetFlow, sFlow, and J-Flow. This unit spots the causes of traffic delivery irregularities, such as dropped or out-of-sequence packets and jitter. You also get network configuration management, which backs up device configurations and immediately restores the original settings when unauthorized changes occur.
Download: Access a 14-day FREE Trial
Official Site: https://www.auvik.com/features/#trial
OS: Cloud-based
2. Progress WhatsUp Gold – FREE TRIAL
Progress WhatsUp Gold
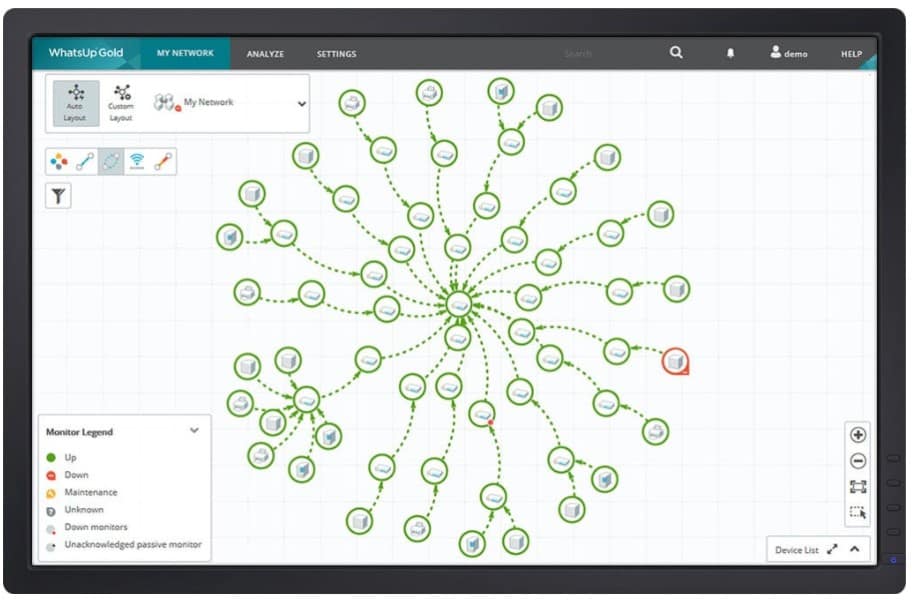
Progress WhatsUp Gold runs on Windows Server and offers network performance monitoring. This is an SNMP-based service that includes Trap processing to produce alerts. Alerts can also be set up on performance thresholds measured against any of the metrics that the package is able to extract from your network devices.
Key Features:
- Network discovery
- Network topology maps
- Live device status tracking with SNMP
- Traffic analysis module available
Why do we recommend it?
Progress WhatsUp Gold provides a core module that implements automated network performance monitoring with SNMP. That module can be enhanced with other units, each of which implements monitoring for different types of assets, such as servers and applications. This service will discover all of your network devices and create a network inventory and topology map.
The SNMP request process is continuous, so the console for the system shows live time-series graphs of overall network performance from which you can drill down to examine each individual device.
The Progress system includes a number of add-ons, which provide extra features and one of these is a Network Traffic Analysis module. This will show the traffic flows on each link on your network, enabling you to monitor for lost packets and excess load.
The WhatsUp Gold base package, called Premium, requires an extra payment to get the Network Traffic Analysis module. A higher edition, called Total Plus, includes that module and all other WhatsUp Gold add-ons.
Who is it recommended for?
This is a good service for mid-sized businesses. The tool sets itself up with its autodiscovery service and will automatically issue alerts if there is a problem with a device. So, you don’t need any networking expertise to manage a network with the tool. The software for WhatsUp Gold installs on Windows Server.
Pros:
- Uses simple visualizations to help provide at-a-glance insights
- Supports modular pricing, allowing companies to pay only for features they intend to use
- Ideal for SMB environments
- Excellent dashboard and reporting visuals
- Can monitor LANs, WANs, and cloud-based applications such as container environments
Cons:
- Modular upgrades might not be a good fit if you intend on utilizing all aspects of a networking monitor
Progress also offers a Network Admin Bundle, which contains the network performance monitoring capabilities of the base edition plus the Network Traffic Analyzer and a Configuration Manager add-on. Progress offers WhatsUp Gold on a 30-day free trial.
3. AdRem NetCrunch – FREE TRIAL
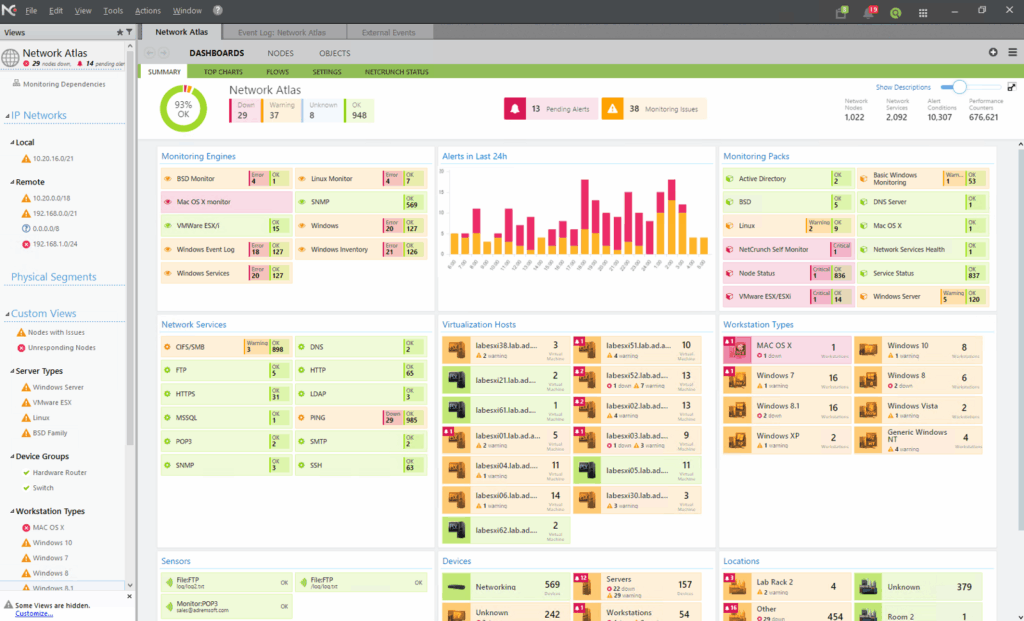
AdRem NetCrunch is an agentless tool that can monitor multiple components in your network. It automatically discovers devices and installs monitoring packs on them to collect data at predetermined intervals. This data is analyzed through automated policies and rules, and the results are displayed on well-designed dashboards and presentations.
Key Features:
- Extensive coverage of devices, services, and applications.
- Automatic discovery.
- Well-designed dashboards, presentations, graphs, and reports.
- Smart configuration and alerting.
- Integrates well with other systems and applications through REST APIs.
Why do we recommend it?
NetCrunch is recommended because it is comprehensive and handles many processes automatically without continuous manual intervention. For starters, it can discover devices and collect data from them through SNMP traps. It combines this data with log, traffic flow, and critical path analysis to provide complete insights into the health and performance of your networks.
Furthermore, it examines and analyzes the data against established rules and thresholds, and sends meaningful alerts. The analyzed data is also displayed on graphs and dashboards for easy understanding.
Who is it recommended for?
NetCrunch can help organizations of all sizes and environments to gain better control over their network’s performance. It can also come in handy for organizations that need log analysis and event correlation from a compliance and auditing standpoint. A good choice for industrial and IoT environments as well.
Pros:
- Displays data in a way that all stakeholders can understand.
- Sends meaningful alerts and reduces alert fatigue.
- Automatically discovers devices in your network.
- Integrates well with other applications.
Cons:
- It may be complex for some users.
NetCrunch can be customized for different environments and requirements. For example, if you want only system monitoring, you can select the Professional edition priced at €2,625. Similarly, for bandwidth and network monitoring, it costs €2,325, while for large-scale mixed environments, the starting price is €16,250. Watch a demo of this platform. You can register for a 30-day free trial.
4. Paessler PRTG – FREE TRIAL
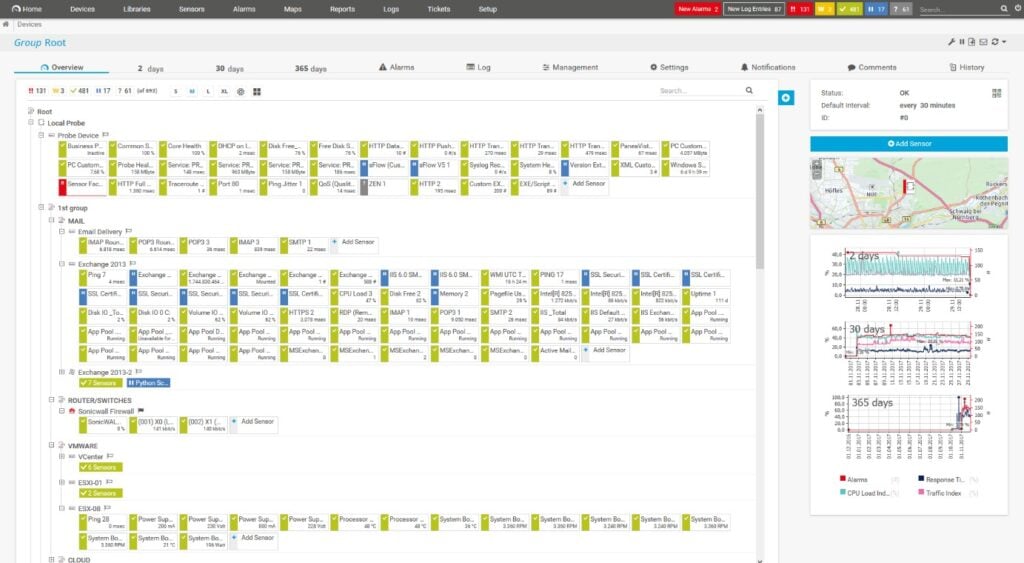
Paessler PRTG is a monitoring tool that can ensure your environment is running smoothly with little to no downtime or performance issues. It provides complete visibility into your infrastructure to improve the efficiency and productivity of your operations.
Key Features:
- Automatically discovers devices in your network.
- Monitors a wide range of aspects, like devices, servers, bandwidth, and more.
- Sends alerts, so you can proactively troubleshoot devices.
- Comes with preconfigured sensors to monitor the devices of popular vendors.
- Offers a centralized dashboard for in-depth visibility.
Why do we recommend it?
We recommend PRTG because it can monitor any devices in any environment. It comes with many sensors to monitor specific aspects of devices, so you have complete control and visibility into your environment. Moreover, it sends alerts with contextual information, making it easy to troubleshoot issues. It can come in handy for making informed decisions as well.
Who is it recommended for?
PRTG is well-suited for organizations of all sizes and industries. It can monitor devices across cloud, on-premise, virtual, and hybrid environments to provide the visibility you need. It is helpful for MSPs as well.
Pros:
- Monitors everything through a single pane of glass.
- Offers a failover node for continuous monitoring.
- Its automated network discovery reduces time and effort.
- Highly scalable for all environments.
Cons:
- Some users may require training to make sense of the data from different sensors.
To see how well PRTG can fit into your organization’s infrastructure, start a 30-day free trial.
5. ManageEngine OpManager – FREE TRIAL
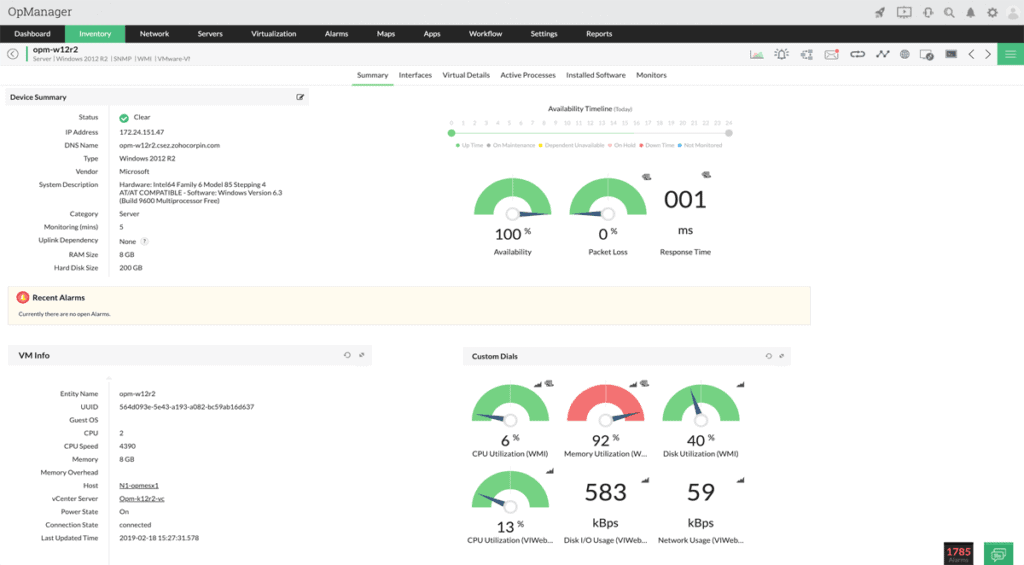
ManageEngine OpManager is a network performance monitor. It focuses on querying network devices for statuses and activity information. This tool uses the processes of the Simple Network Management Protocol (SNMP) to repeatedly gather reports from device agents.
Key Features:
- Network discovery
- Constantly updated network inventory
- Network topology mapping
- Virtualization monitoring
Why do we recommend it?
ManageEngine OpManager is a monitoring system for networks and servers. The package is largely based on SNMP and includes a network discovery cycle. The tool also generates a network inventory and topology map and keeps both documents up to date. Constant SNMP polling gathers status reports and alerts for performance problems.
The SNMP processes enable OpManager to identify all devices connected to a network and create an asset inventory. As the SNMP poll repeats, OpManager checks all of the information that it has gathered, so it is able to update its inventory if anything has changed.
The OpManager package includes a network topology mapper, which works off the up-to-date inventory, so its network maps are always reflections of the current state of the network.
Who is it recommended for?
This package is a great tool for any network. Its blend of network and server monitoring provides two key needs in one package. There is a Free edition but it is limited to monitoring three network devices. The base package of the paid edition will cover 25 devices.
Pros:
- Supports a freeware version
- Uses both SNMP and NetFlow for monitoring giving it more coverage options than other tools
- Can scale easily, Enterprise package supports up to 10,000 endpoints
- Utilizes automatic network discovery to create live inventories and network maps for administrators to track assets and network size
- Viable for both large and small networks
Cons:
- OpManager is dense with features, integrations, and settings, and may take time to fully learn
OpManager can be installed on Windows Server or Linux on-site. It’s also possible to get the tool as a service for your account on AWS or Azure. ManageEngine offers OpManager on a 30-day free trial.
6. Site24x7 Network Monitoring – FREE TRIAL
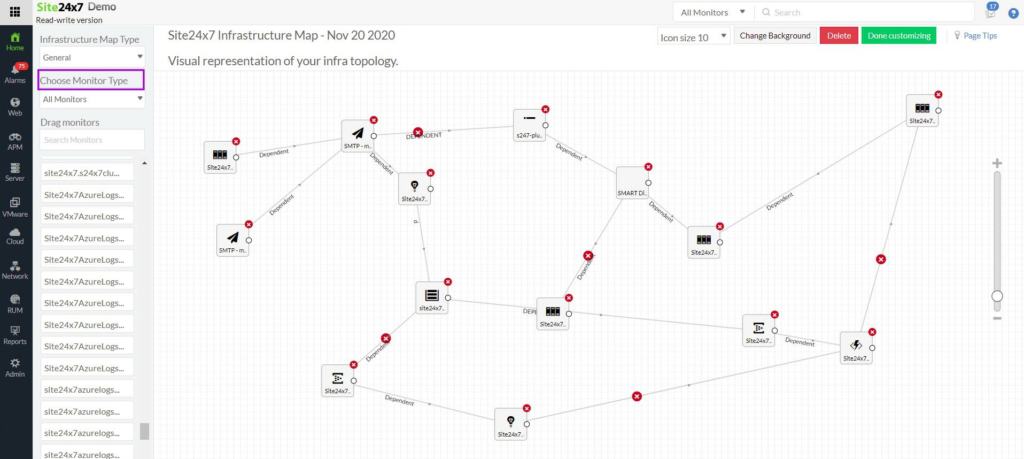
Site24x7 Network Monitoring is a module on a SaaS platform of system monitoring tools. The system implements network discovery and then compiles a network inventory. This function is driven by the Simple Network Management Protocol (SNMP). SNMP requeries the network periodically and updates the inventory every time, ensuring that your hardware inventory is constantly up to date.
Key Features:
- Network discovery, inventory creation, and network mapping
- SNMP live monitoring with alerts
- NetFlow, sFlow, J-Flow, CFlow, IPFIX, AppFlow, and NetStream
- Traffic management
- Part of a platform of full-stack monitoring tools
Why do we recommend it?
Site24x7 Network Monitoring is similar to the Datadog network monitoring system because it offers two types of network monitoring tools: device health tracking and traffic analysis. The big difference between the two systems is that Datadog charges per module, while Site24x7 bundles all of its services into packages. So you get server and application monitoring in your network monitoring plan.
The Site24x7 service also provides a network topology map. This is generated when accessed and is based on the network inventory. So, the map is always automatically updated. SNMP keeps requerying and the system also provides emergency notifications if a device has a problem. The Network Monitoring service will raise an alert if a performance threshold is beached, if a resource runs short, or if a device sends a warning (SNMP Trap). Alerts can be set up to send an email or an SMS to technicians.
The package also includes traffic analysis, which can be used to spot traffic bottlenecks or inefficient routing and subnetting. The service uses NetFlow, sFlow, J-Flow, CFlow, IPFIX, AppFlow, and NetStream so it can communicate with the devices of all providers. The package produces IP SLA and MOS ratings to track the quality of service for VoIP connections.
Who is it recommended for?
Site24x7 sizes and prices its base plans to suit small businesses. The cost of these editions are all low enough to be affordable even to the smallest businesses. However, there are extra capacity options that make the editions suitable for use by much larger companies. This is a cloud-based system.
Pros:
- Automated monitoring with alerts by email or SMS
- Full network documentation generation
- Full stack monitoring with instant root cause analysis
- Options for log management
Cons:
- No on-premises edition
Site24x7 is a subscription system with packages that include all or most of the modulus on the platform. These all include network, server, cloud, and application monitoring systems and you can also choose plans that provide log management or website monitoring. You can assess any plan with a 30-day free trial.
7. Datadog Network Monitoring
Datadog Network Performance Monitoring
Datadog Network Monitoring is a cloud-based service that is available in two packages. These are the Network Device Monitoring module, which works with SDNMP to track device statuses, and the Network Performance Monitoring service, which measures traffic capacity and throughput. Each service is available on a separate subscription but combining the two packages will give you a complete network monitoring system.
Key Features:
- Network device monitoring
- Network traffic monitoring
- Automatic device discovery
- DNS server management
Why do we recommend it?
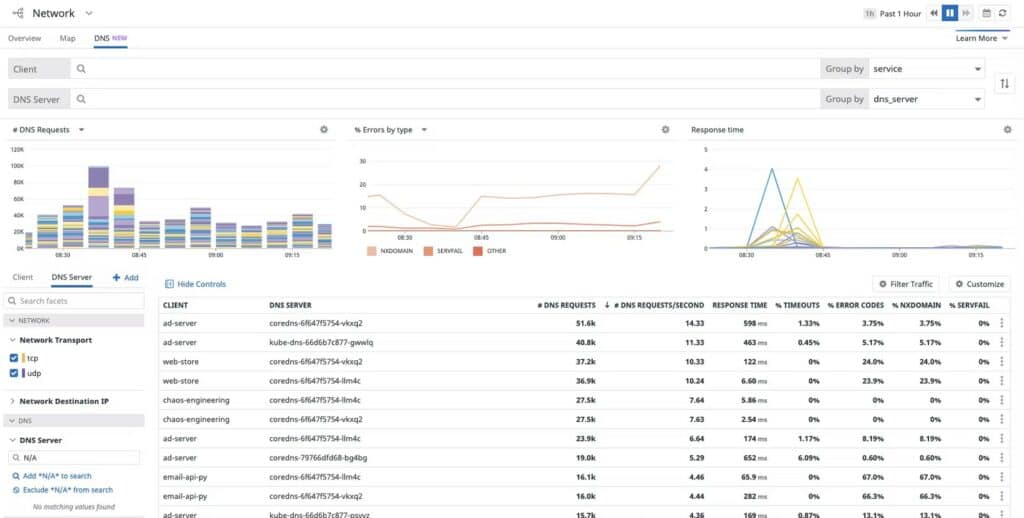
Datadog Network Monitoring is divided into two modules: Network Device Monitoring and Network Performance Monitoring. The first of these uses SNMP to check on the statuses of network devices and the second is a traffic analyzer that relies on flow protocols for its inputs. Both systems integrate alerts for performance issues.
The Datadog service performs all heavy processing on its own servers. However, you do need a local agent on a device that is connected to your network so that statistics can be gathered. This agent uploads all of the data that it collects so you get live performance information in the dashboard.
The console for the system can be customized. It is accessed through any standards Web browser from anywhere.
The Network Device Monitor will map your entire network and provide a network topology map. As it works with SNMP, the service will also process Trap messages into alerts. You can get those alerts forwarded as notifications by email or SMS.
The Network Performance Monitor lets you see link-by-link live traffic throughput statistics. You will be able to spot overloaded segments immediately and implement re-routing, load balancing, or traffic shaping to alleviate problems.
Who is it recommended for?
This cloud-based system is very competitive and most companies will be more interested in the Network Device Monitoring unit, which equates to the Network Performance Monitoring system from SolarWinds. Buyers should be aware that the presence of the Datadog Infrastructure Monitoring unit is a prerequisite for the use of either network monitoring unit.
Pros:
- Offers numerous real user monitors via templates and widgets
- Can monitor both internally and externally giving network admins a holistic view of network performance and accessibility
- Changes made to the network are reflected in near real-time
- Allows businesses to scale their monitoring efforts reliably through flexible pricing options
Cons:
- Would like to see a longer trial period for testing
The Network Performance Monitor and the Network Device Monitor are both offered as subscription services with rates per month or per year. You can try all of the Datadog modules on a 14-day free trial.
8. Obkio
Obkio is an agent-based network monitoring tool that monitors every component in your network. It is a simple tool that gathers data from devices using lightweight agents and analyzes them for powerful insights. The results are displayed on intuitive interfaces, and alerts are sent to the respective teams as needed.
Key Features:
- Distributed monitoring strategy.
- Comes with network monitoring templates.
- Measures key network performance metrics.
- Network path discovery and analysis.
- Real-time monitoring.
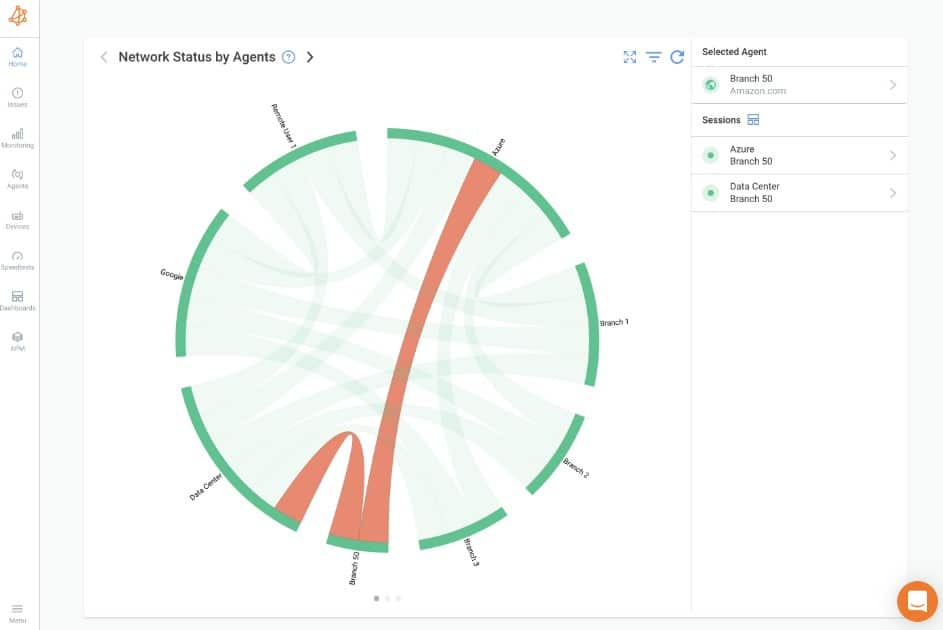
Why do we recommend it?
Obkio is recommended because of its extensive monitoring capabilities. It can monitor networks of all kinds, including LAN, WAN, SDWAN, Cloud, and even distributed networks. It also leverages hundreds of metrics, like CPU, memory, and even real user experience, to provide a complete picture of your network’s state and performance.
A notable feature of this tool is its ability to highlight network issues. It is highly granular and detailed, and drills down to provide even minor network degradations, so you can fix issues before they get out of control.
Its historical data analysis and anomaly detection are other key features.
Who is it recommended for?
It is recommended for network administrators who want to ensure optimal network usage, efficiency, and performance. It can also help identify security issues for a priority fix. These aspects can also help MSPs meet their SLA requirements.
Pros:
- Simple and powerful visualizations to understand the root cause of problems.
- Monitors extensive metrics, making it ideal for a lot of use cases.
- Sends smart notifications to reduce alert fatigue.
- Generates downloadable and shareable reports.
Cons:
- Could do with more integrations.
Obkio’s base Starter Plan is priced at $224 per month when paid annually. They also have a Basic, Premium, and Custom Enterprise plans. Start a 14-day free trial.
9. OpenNMS Horizon
OpenNMS Horizon
OpenNMS is available in two versions. Horizon is the first of these and it is free to use. The second is a paid version, called Meridian. The Horizon system is open source, which means that it is possible to access the source code and change it. So, the OpenNMS Horizon system is a good option for those who don’t want to pay for a network monitor and also a good place to start for companies that want to develop their own in-house monitoring package.
Key Features:
- Traffic flow data collection with NetFlow, IP-FIX, J-Flow, and sFlow
- Network device monitoring with SNMP
- Network topology mapping
- Elasticsearch for data analysis
- A plug-in system to integrate with third-party tools
Why do we recommend it?
OpenNMS Horizon is a great deal because it is free. This tool gives you both device status monitoring and traffic flow analysis, so you get warnings for component problems in your switches and routers and you also get to see which devices are getting overloaded. The tool is open source so you can alter the code if you want to.
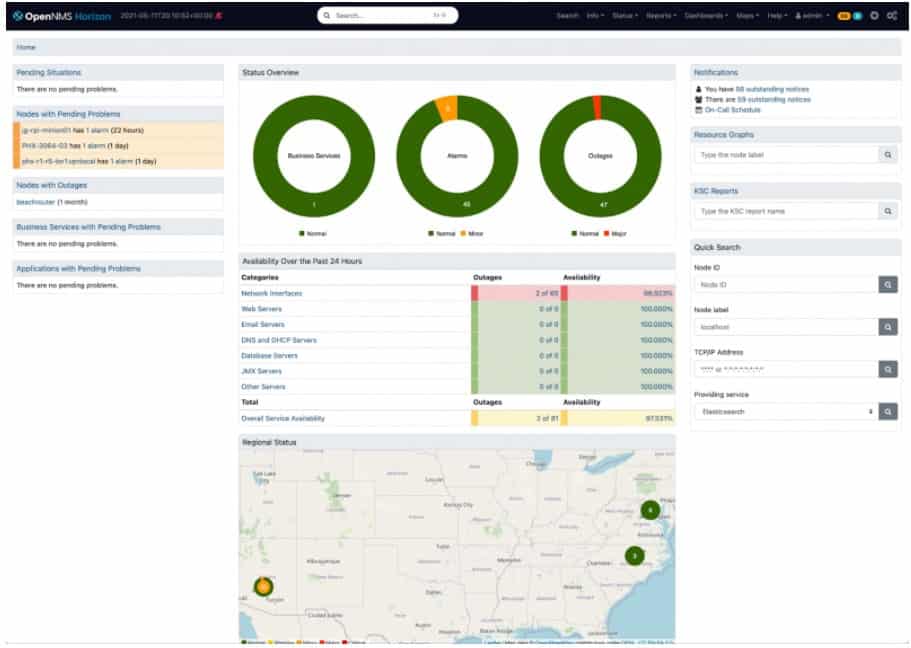
Both OpenNMS versions are able to monitor network devices and track traffic flows. The Horizon system is an on-premises package but it isn’t limited to watching over just one location. It can be used to monitor remote sites as well, providing a centralized monitoring station at one central location. The service includes a network discovery procedure that is repetitive, so it can spot any changes to the asset inventory of the network.
The server software for OpenNMS installs on RHEL, CentOS, Debian, and Ubuntu Linux. The Horizon package is completely free to use and it can be downloaded from a GitHub repository.
OpenNMS has come a long way over the years and has gone from being clunky and difficult to use to a slick network management tool. Many large businesses would shun the Horizon edition because it doesn’t include a professional support plan. Those organizations can opt for the fully-supported Meridian version. Small businesses with little money to spare would welcome this attractive network monitoring tool.
Who is it recommended for?
This is an appealing system for any business. However, companies that are required by their professional insurance to only use software that comes with a support contract would have to opt for the paid Meridian version. The Horizon software is only available for Linux.
Pros:
- Open source projects, lots of room for customization, and personalized add-ons
- Has a large amount of documentation available
- Features two versions, a stable version and a beta test version for new features
- Offers a wide range of monitoring options and flexible alert notifications
Cons:
- Users rely on help documents and forums for support, which isn’t always the quickest way to resolve issues
10. Atera
Atera is a cloud-based system that provides all of the tools that managed service providers (MSPs) need. This includes a network monitoring system that is able to track activity on multiple networks simultaneously. The architecture of an Atera account is multi-tenanted, so when setting up this service, you create a separate account for each client, and then all of the services of the Altera package work independently for each subaccount.
Key Features:
- Tools to manage an MSP business
- Systems for use by support technicians
- Automated monitoring for networks and servers
- Maintenance task automation
- Patch manager and software installer
Why do we recommend it?
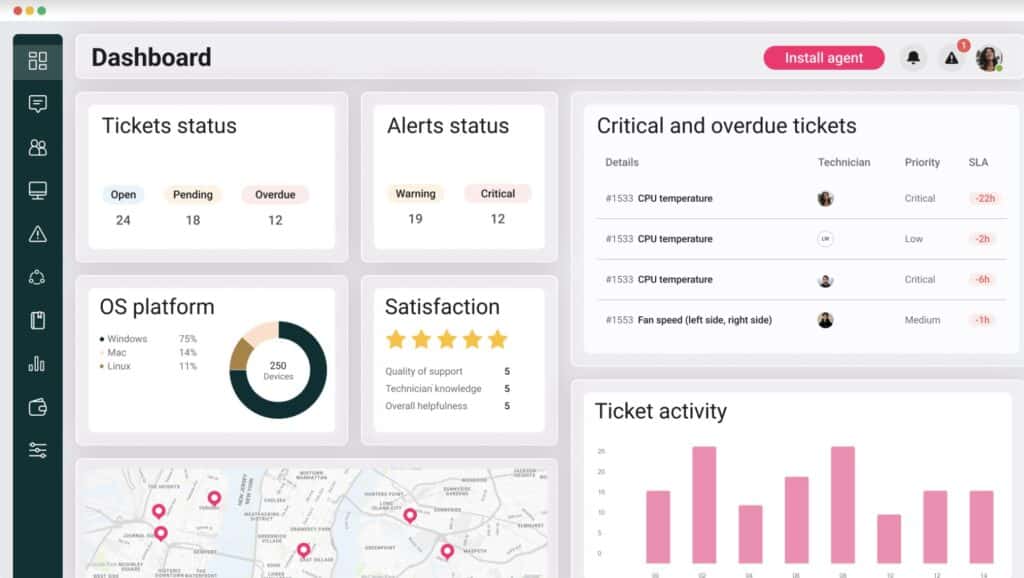
Atera is a cloud platform that provides remote monitoring and management functions. That monitoring remit includes network monitoring. The system is able to monitor multiple sites simultaneously and the service is based on SNMP, which will raise alerts if a device reports a problem.
The network monitoring system uses SNMP to constantly check on the statuses of network devices. The package includes a series of performance thresholds that trigger alerts when crossed. This means that technicians can get on with other tasks, leaving the Atera package to watch over the network – if there is a problem, they will be called back.
The dashboard for the Atera system is accessed through any standard browser from anywhere, so startup MSPs don’t even need servers or offices to start operating with this package.
The Atera service is a subscription service with no minimum service period or setup fees. The complete package of tools includes a ticketing system, remote access tools, contract and client management services, and technician team management services.
Who is it recommended for?
This package is delivered in two different versions. One of those caters to managed service providers and the other is designed for use by IT departments for in-house monitoring. Each version is available in four plan levels and pricing is levied per technician with no seat minimum.
Pros:
- Lightweight cloud-based tool
- Built with MSPs in mind, and includes RMM and PSA tools built-in
- The framework is highly customizable, making Atera extremely flexible
- Can scale and support multiple databases in a multi-tenant environment
- Packaged pricing makes Atera accessible to any size business
Cons:
- Atera is MSP focused, smaller organizations may not use all multi-tenant features
The platform is priced per technician, which makes all of its services available to businesses of all sizes. Taking on the Atera system gives an MSP everything it needs to operate and so cuts out the time those businesses would otherwise waste comparing candidate tools for each element of the Atera platform. The package is available for assessment with a 30-day free trial.
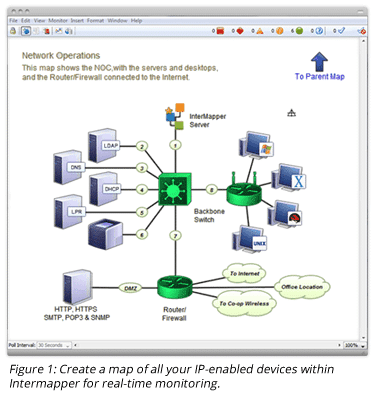
11. Fortra Intermapper
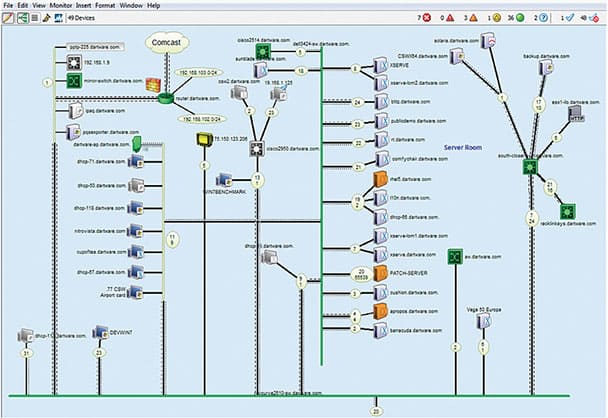
Although the Fortra Intermapper package started out as a network mapping tool, its capabilities have been greatly expanded over the years. Its dashboard now shows lists of statistics and graphs as well as network maps, just like any other network monitoring system.
The tool still performs its original function of scouring the network, identifying connected devices, and creating a network map. The tool includes a traffic volume tracker that will show links on a network that is experiencing heavy traffic.
Key Features:
- Network discovery
- Automated topology mapping
- Network traffic monitoring
- Alerts for device problems
- Customizable maps
Why do we recommend it?
Fortra Intermapper has a misleading name because it doesn’t just map a network, it implements continuous monitoring of it. The tool provides an autodiscovery routine that documents all network devices and creates a map. It then implements monitoring, which is particularly strong at tracking traffic flows.
Traffic indicators need to be set up by specifying an acceptable level of traffic per link. When that level is exceeded, the system will raise an alert, which is shown through animation on the overwhelmed device.
The network discovery process also generates an IT asset inventory, which can be viewed in the system console. Network scans occur periodically, so any changes to the network are immediately reflected in a redrawn map and an updated inventory.
Device statuses also get tracked so if there is any other issue apart from capacity problems, they will trigger alerts.
It is possible to customize an automatically generated map by changing the settings of the mapper. You can also upload a floor plan to get the actual physical location of devices shown in the console.
As well as mapping LANs, the Intermapper system will show VLAN traffic and wireless systems on your premises.
Who is it recommended for?
This package is a good option for mid-sized businesses. Its price bracket competes with ManageEngine OpManager, so anyone with about 25 network devices to monitor should compare those two network monitoring systems side by side. This software is available for macOS as well as Windows and Linux.
Pros:
- Better suited for smaller networks
- Can easily toggle between top-level and granular overviews
- Supports native alerts
- Features a physical floorplan option – great for MSPs
Cons:
- The interface is fairly outdated
Fortra Intermapper runs on-premises and is available in versions for Windows, macOS, and Linux. You can examine Intermapper on a 30-day free trial.
12. AppNeta Performance Monitor (acquired by Broadcom)
AppNeta Performance Monitor
AppNeta Performance Monitor (acquired by Broadcom) is a cloud-based monitoring service for network and Web applications. Although all of the processing for the service is carried out in the cloud on the AppNeta server, the system does include an element that installs on the monitored network.
Why do we recommend it?
AppNeta has recently been taken over by Broadcom and its Performance Monitor is a cloud-based system that focuses on the delivery of web applications. It chains backwards to discover where response time issues that arise in user-facing systems actually originated. The tool will also examine connections to remote workers.
The on-site element is a data-gathering agent. This tool constantly gathers data on the network and uploads it to the server for processing. A key piece of information that the monitor needs is the layout of the network, which it derives by collecting information from switches and routers about their neighbors.
The network device data collected by the agents is constantly required, keeping the cloud-resident network inventory updated. The system also draws up a network topology map, which is kept up to date.
The monitor will check on internet performance and wireless systems as well as LANs. It can be used to pay particular attention to QoS for interactive services, such as VoIP.
The AppNeta system is particularly useful for checking on device availability and it has a visual TraceRoute service that can be used for performance analysis.
Who is it recommended for?
This system focuses on the delivery of applications to users and visitors who are outside the company network, so it examines internet connection performance as well as LAN issues. This means that the tool is going to be of interest to businesses that have many remote workers or are reliant on the performance of their websites.
Pros:
- Operates as a cloud-based SaaS making it flexible and easy to deploy
- Utilizes a proprietary traffic analysis method that provides detailed reports based on each network hop
- A great option for companies that rely on many public-facing applications to conduct business (DMZs, SaaS tools, cloud services)
- Pairs DPI with application performance, allowing users to correlate attacks and uptime easily
Cons:
- Must contact sales for an undetermined free trial period
- Could use more security features to stop threats as they’re identified
- More expensive than similar DPI tools
An account with AppNeta includes the server that runs the monitoring software and storage for gathered statistics, which is retained for a full year. You can get to know the AppData system by requesting a demo.
13. SolarWinds Network Performance Monitor
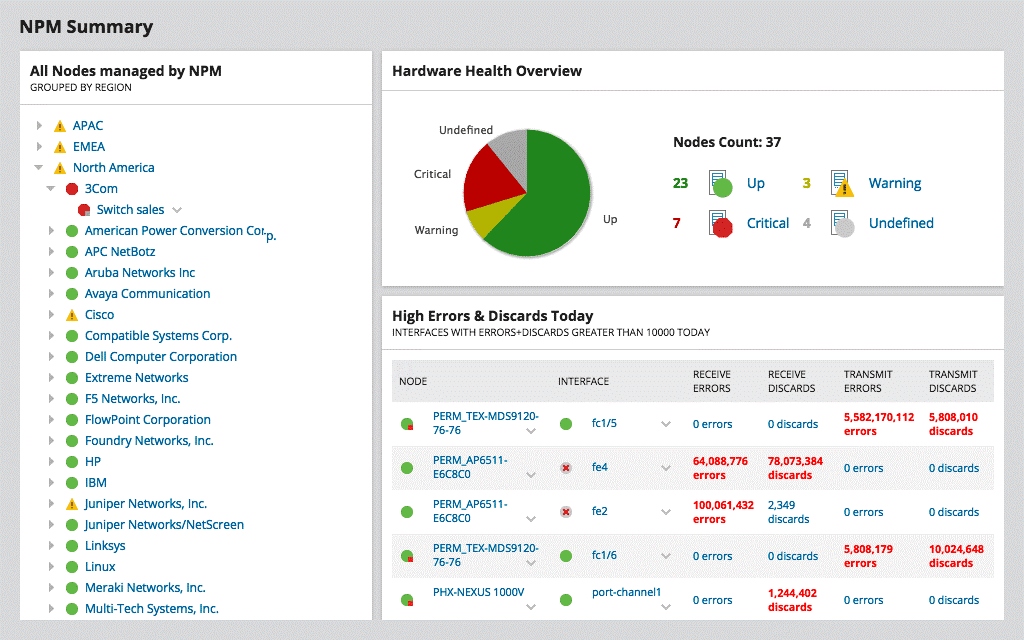
SolarWinds NPM Summary
SolarWinds is a heavyweight in the network-monitoring world, and for good reason. For years, SolarWinds Network Performance Monitor (NPM) has provided all-around monitoring capability.
Why do we recommend it?
SolarWinds Network Performance Monitor sets itself up by scanning the network and identifying all connected devices. The tool generates an inventory and a network topology map and continues this search on a schedule, spotting changes to the network and gathering status reports from each device.
With the release of NPM 12, SolarWinds has considerably upped the usability and primary feature of the set of their core product, adding a fully refreshed UI, new NetPath services to help you discover and troubleshoot network paths hop-by-hop, F5 BIG-IP load balancer monitoring, Cisco switch stack monitoring and more.
NPM 12 handles all the basics a network management tool must have, like performance troubleshooting and problem isolation, fault alerting, capacity forecasting, and detailed usage reporting. Support for wifi heat mapping and network topology advancements, including network topology detection across multiple, global sites is also included.
Additionally, dependency detection automatically calculates node-to-node dependencies based on topology connections.
Integration with SolarWinds and other AppStack monitoring products helps NPM provide deeper views across the application stack, from storage to virtualization to server infrastructure.
Version 12 also adds support for the ServiceNow incident management system, along with the ability to use Active Directory for discovery.
On the other hand, NPM doesn’t include application monitoring, which we’d like to see included soon. Finally, the SolarWinds pricing structure is based on network “elements” being monitored – like interfaces, CPUs, etc.
Depending on the size of your network and monitoring requirements, this can add up quickly.
SolarWinds NPM Screenshots:
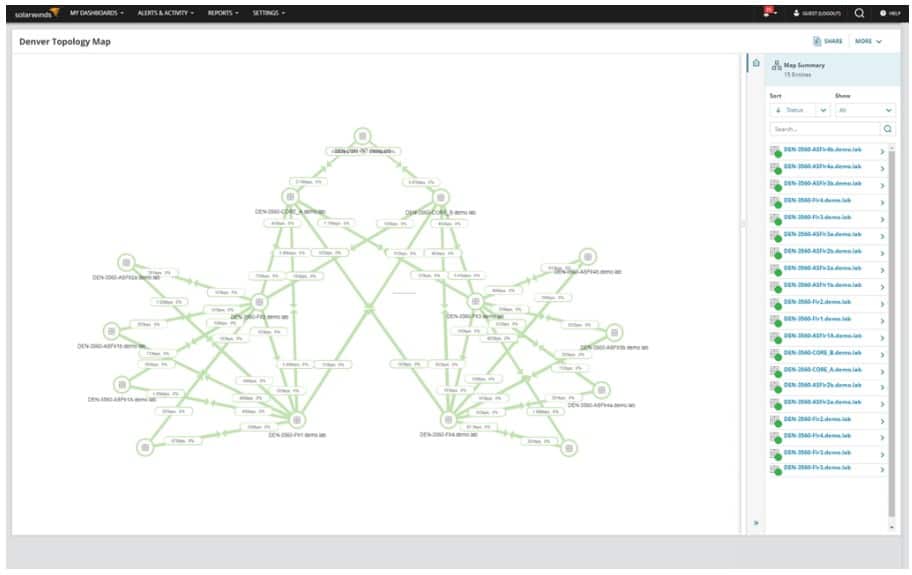
SolarWinds NPM Network Topology Map
Who is it recommended for?
This system is ideally suited for mid-sized and large companies. In fact, large businesses will gain the most benefit from the system. Watching the status of every network device gets exponentially more time-consuming for larger networks. Performance expectation thresholds that trigger alerts make monitoring an automated process.
Pros:
- Takes a holistic approach to server performance and health monitoring
- Supports auto-discovery that builds network topology maps and inventory lists in real-time based on devices that enter the network
- Supports both SNMP monitoring as well as packet analysis, giving you more control over monitoring than similar tools
- Uses drag and drop widgets to customize the look and feel of the dashboard
- Robust reporting system with pre-configured compliance templates
Cons:
- Designed for IT professionals, not the best option for non-technical users
How We Pick a Winner…
In this year’s Network Management & Monitoring Smack-down there are a number of new considerations that have gone into picking a winner:
UI is a Big Deal
UI design and ‘understandability’ is becoming a bigger deal as the number of devices and elements being monitored is growing so quickly now.
The old-school UIs of some of these products are generally not scaling well to meet this demand and are starting to look like a ‘dog’s breakfast’ when you’re trying to get a decent, birds-eye view of what’s going on across the network.
Quite frankly, some of these products aren’t keeping up, and they’re showing their age. They could take a lesson from the Web-UIs that SaaS apps have been rolling out for a while now when it comes to reporting and dashboard design.
The Playing Field is Evening Out
The top three leaders in this space, SolarWinds, ManageEngine, and WhatsUpGold are matching each other feature-for-feature in most areas.
All have realized that they need to effectively monitor wireless and virtual infrastructure and do a better job of automatically mapping complex, distributed networks without requiring as much manual mapping on the part of admins trying to implement the solutions.
Scalability is King
In larger Infrastructures and Network Environments with more complex routing and topologies, you need to choose your steps very carefully when it comes to investing in a Management platform.
If you box yourself in too tightly with a poor-scalability solution, you’re going to have to end up deploying multiple standalone instances of the core monitoring applications (in the best-case scenario) or (in the worst-case scenario) be left without support for upcoming or changing requirements and complexity forcing you into a rip-and-replace situation.
Neither scenario is good, you’re best off considering scalability and upgrade support now rather than later.
Cost Factors for Small Environments
These products and their associated add-ons are getting pricey, fast.
If you’re a small office or non-profit organization, and have technical chops for self-deploying open-source products (and waiting for community-added features and support) then give OpenNMS a test run.
If you’re in a Larger Environment, Integration with other products, patching, compliance reporting and ongoing upgrade paths and support will lead you to a product from one of the top three vendors here like SolarWinds, ManageEngine, or WhatsUpGold.
Network Monitoring Tools FAQs
What are the different types of network monitoring?
The different types of network monitoring include active monitoring, passive monitoring, and real-time monitoring.
What is active monitoring?
Active monitoring is a type of network monitoring that involves sending test traffic to network devices to identify network issues.
What is passive monitoring?
Passive monitoring is a type of network monitoring that involves collecting network traffic data without interfering with network traffic.
What is real-time monitoring?
Real-time monitoring is a type of network monitoring that involves monitoring network devices and traffic in real-time, to identify and respond to network issues immediately.
What are the different types of network monitoring tools?
The different types of network monitoring tools include packet sniffers, network analyzers, and SNMP-based monitoring tools.
What are some examples of network monitoring tools?
Some examples of network monitoring tools include PRTG Network Monitor, SolarWinds Network Performance Monitor, and Nagios.
Can network monitoring tools be integrated with other network management tools?
Yes, network monitoring tools can be integrated with other network management tools, such as network mapping software and IP scanners, to provide a more comprehensive view of network performance and security.