In my previous article on network monitoring basics, we did an overview of some of the network areas that you might want to monitor and some of the tools available to do the job.
In today’s article, we’ll discuss monitoring applications, which is complementary to network monitoring tools already employed in your infrastructure!
Here is our list of the best application performance monitoring tools:
- Progress WhatsUp Gold – EDITOR’S CHOICE This on-premises monitoring platform includes modules for different layers of the IT environment, including an Application Performance Monitor. Runs on Windows Server. Start a 30-day free trial.
- ManageEngine Applications Manager – FREE TRIAL This package tracks all software, middleware, services, and server resources as they interact and it has an APM Insight module for Web application tracking. Runs on Windows Server, Linux, AWS, and Azure. Start a 30-day free trial.
- Site24x7 – FREE TRIAL A hosted application performance monitoring service that discovers applications, maps their dependencies, and tracks web, middleware, and on-premises workloads. Get a 30-day free trial.
- Datadog APM This SaaS package provides code profiling, distributed tracing, and application dependency mapping to provide full observability.
- AppOptics This SaaS package provides application monitoring facilities for both on-premises and cloud-hosted systems. Use this service to trace through code and observe the performance of interdependent applications.
Application Monitoring Are Not the Same!
If your organization is like most, putting in the request for application monitoring after the request for network monitoring will probably get you a statement something like: “Didn’t we just buy a monitoring solution?”
How can you explain the difference between application monitoring and generalized network monitoring?
One easy way to explain it is to point out that network monitoring tells you when people can’t get to an application, and application monitoring tells us when an application is not working properly, even though people can get to it.
Application monitoring will let you know when your main line of business apps, or their related databases, email system, etc… are not performing properly. Proper app monitoring software will give you a visual dashboard to trend usage, performance, and growth. All these are extremely important for capacity planning, meeting SLA’s, and finding problems before they cause outages.
App Monitoring Options
The Application Monitoring field is large, and there are even a couple of mature, well-used open-source options, such as Nagios and Hyperic which provide powerful monitoring solutions for all sizes of business. In addition to these open-source options, there are several commercial options available as well.
How it Works
All Application monitoring packages work in one of two ways, using either an agent-push, or a polling method. In some cases, they use a combination of both methods. Agent-push uses a locally-installed monitoring agent on the server to push monitored data, while the polling method uses WMI, SNMP, or other similar methods of gathering application information.
Historically, agent push has had more powerful monitoring options, but it introduces a management headache, as you have to install and update agents to the monitored servers. Polling is becoming the preferred method, due to the ease of deployment of the monitoring solution.
Application Performance Monitoring Tools
Our methodology for selecting application monitoring tools and software
We reviewed various application tools and analyzed the options based on the following criteria:
- An autodiscovery system to log new applications
- Multi-tenant support
- Integrations and support for a wide range of 3rd party applications
- A facility to analyze application performance and usage over time
- Graphical interpretation of data, such as charts and graphs
- A free trial period, a demo, or a money-back guarantee for a risk-free assessment
- A good price that reflects value for money when compared to the functions offered
1. Progress WhatsUp Gold – FREE TRIAL
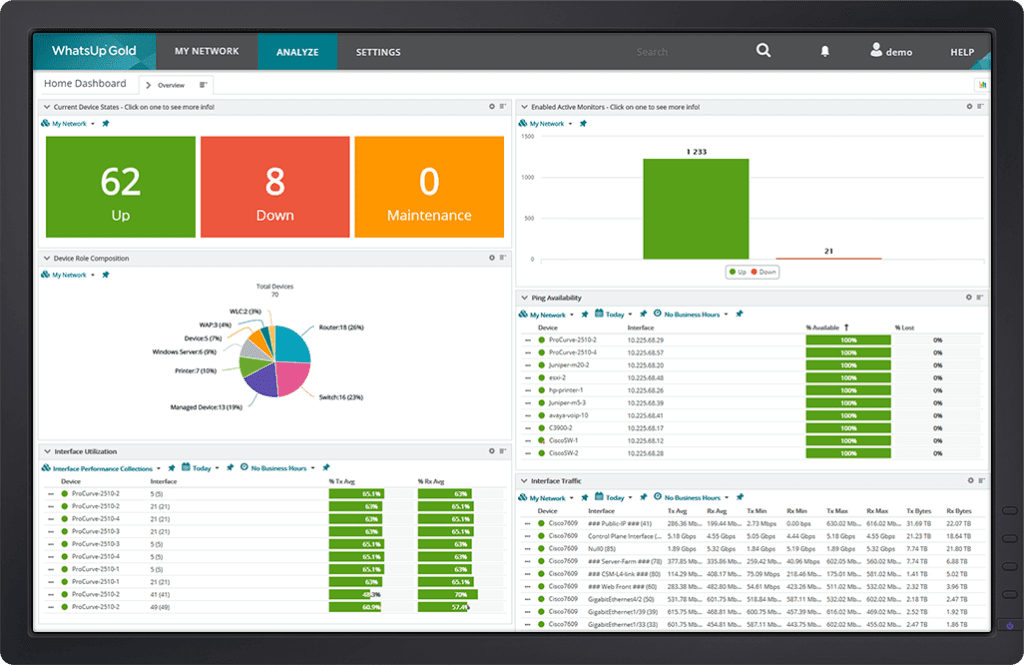
Progress WhatsUp Gold is a broad monitoring suite made up of separate modules, one of which is its Application Performance Monitoring service. One of the strongest parts of that APM is its discovery process, which finds applications automatically and maps the relationships between them, showing which services depend on others.
Key Features:
- Application discovery
- Dependency mapping
- Connectors for widely used applications
- Custom dashboards
- Real-time alerts
Why do we recommend it?
The APM in Progress WhatsUp Gold is useful on its own, but it becomes more valuable because it sits alongside other modules that support application delivery, such as the network performance monitor and server monitor. That wider platform makes it easier for administrators to trace application slowdowns back to the underlying cause instead of checking separate tools one by one.
The APM also groups together the components that make up a single user-facing service. That makes management and troubleshooting faster for more complex applications, especially web applications built from multiple layers of microservices.
It also includes alert triggers. When a threshold is breached, the alert appears in the console and can also be sent automatically to named technicians by email, SMS, or Slack. The module comes with a library of predefined alert rules, but administrators can also create their own. Alerts can also be linked to actions, which allows automated remediation.
The wider WhatsUp Gold platform also includes monitoring for servers, storage, cloud platforms, and virtual environments. All of those functions are presented through one console, which makes administration easier than switching between separate monitoring products. The platform also includes network device status monitoring and traffic analysis.
Who is it recommended for?
Smaller businesses are unlikely to need a package of this size. However, WhatsUp Gold will suit mid-sized and large organizations. The bundle is offered in four editions. The first does not include the APM and provides only the network performance monitor. Of the remaining three editions, the highest tier is mainly aimed at very large organizations because it is a tailored package.
Pros:
- Full-stack observability platform
- Raises alerts for performance issues
- Logs state changes continuously
- Out-of-the-box monitoring profiles
- Well-developed dashboards and reports
Cons:
- Only available for on-premises installation
Progress offers WhatsUp Gold on a 30-day free trial.
EDITOR'S CHOICE
WhatsUp Gold is the editor’s choice for the best application performance monitoring tool as it combines deep application monitoring with full-stack visibility. It offers templates for monitoring many applications, so you can get started right away with little customization of the templates. It even covers interconnected devices and servers to provide comprehensive visibility into your applications’ health and performance. Moreover, WhatsUp Gold can trigger multi-step scripts automatically to log events, restart services, and send alerts, to ensure that operations can continue with minimal manual intervention. Such automation capabilities make it a good choice for all environments, including complex hybrid environments.
Download: Get a 30-day free trial
Official Site: https://www.whatsupgold.com/
OS: Windows Server 2012 or later
2. ManageEngine Application Manager – FREE TRIAL
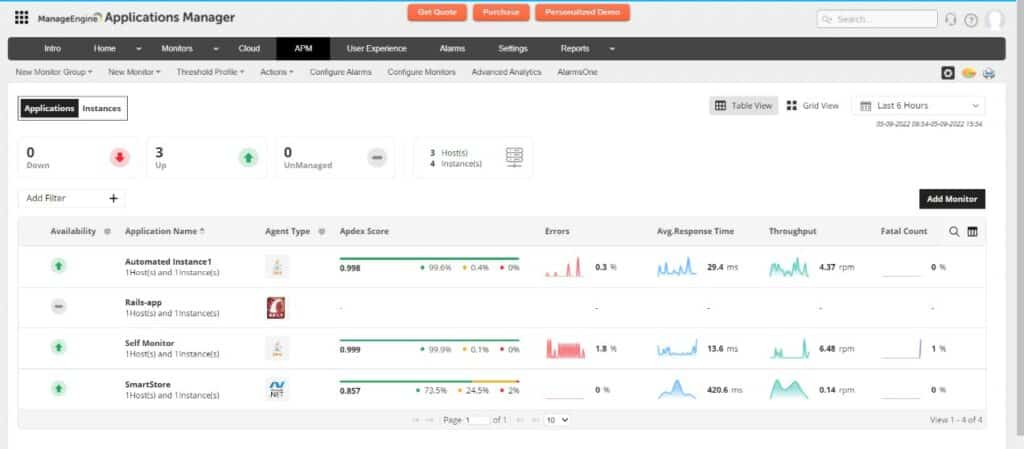
ManageEngine Applications Manager includes an APM Insight module that tracks the performance of Web applications. While this package is monitoring Web applications, microservices, and serverless systems. The rest of the Applications Manager package is watching over hosted software packages and middleware. The tool also tracks the activities and availability of server and cloud platform resources.
Key Features:
- Application discovery
- Application dependency mapping
- Distributed tracing and code profiling
Why do we recommend it?
ManageEngine Application Manager implements performance tracking for traditional applications and software and also provides distributed tracing and code profiling for web applications. This system is designed to scrutinize more than 500 applications and can also be adapted to monitor custom software. This is a software package rather than a SaaS platform.
The APM Insight crawls through known applications to discover contributing backend functions and APIs. The APM system includes distributed tracing for watching the execution of compiled code and inaccessible functions that are hosted on third-party servers. There is also a code profiler that will step through code written in PHP, Node.js, Java, .NET, Python, and Ruby on Rails.
The Applications Manager provides a discovery service that logs all software and notes how they interconnect. This also applies to the microservices that build up Web applications. This discovery process generates an application dependency map. With this record of system interaction, the service is able to identify when multiple applications running simultaneously could overload underlying resources.
The service is able to raise predictive alerts, which are sent out as notifications to technicians. These can be sent by email, SMS, Slack post, or Service Desk ticket. Technicians can trace through alerts in the system console and identify which occurred first in a recent batch. This provides an instant root cause analysis and speeds up the time it takes to head off problems.
Who is it recommended for?
This is a large package for large companies. However, ManageEngine makes the tool accessible to small businesses by producing a Free edition. That version is limited to monitoring five assets and it doesn’t include monitoring services for web applications to ERPs. The top plan can monitor multiple sites and cloud platforms.
Pros:
- Distributed tracing for Web application performance tracking
- Code profiling for text-based programming languages
- Simultaneous monitoring of all software, services, and server resources
- Predictive alerts and root cause analysis
Cons:
- Not a SaaS package
There is a Free edition of Applications Manager but this is limited to monitoring five assets. The two paid editions are suitable for single sites or WANs. The software package runs on Windows Server or Linux and you can also get it as a service on AWS Marketplace and Azure Marketplace. Assess Applications Manager with a 30-day free trial.
3. Site24x7 – FREE TRIAL
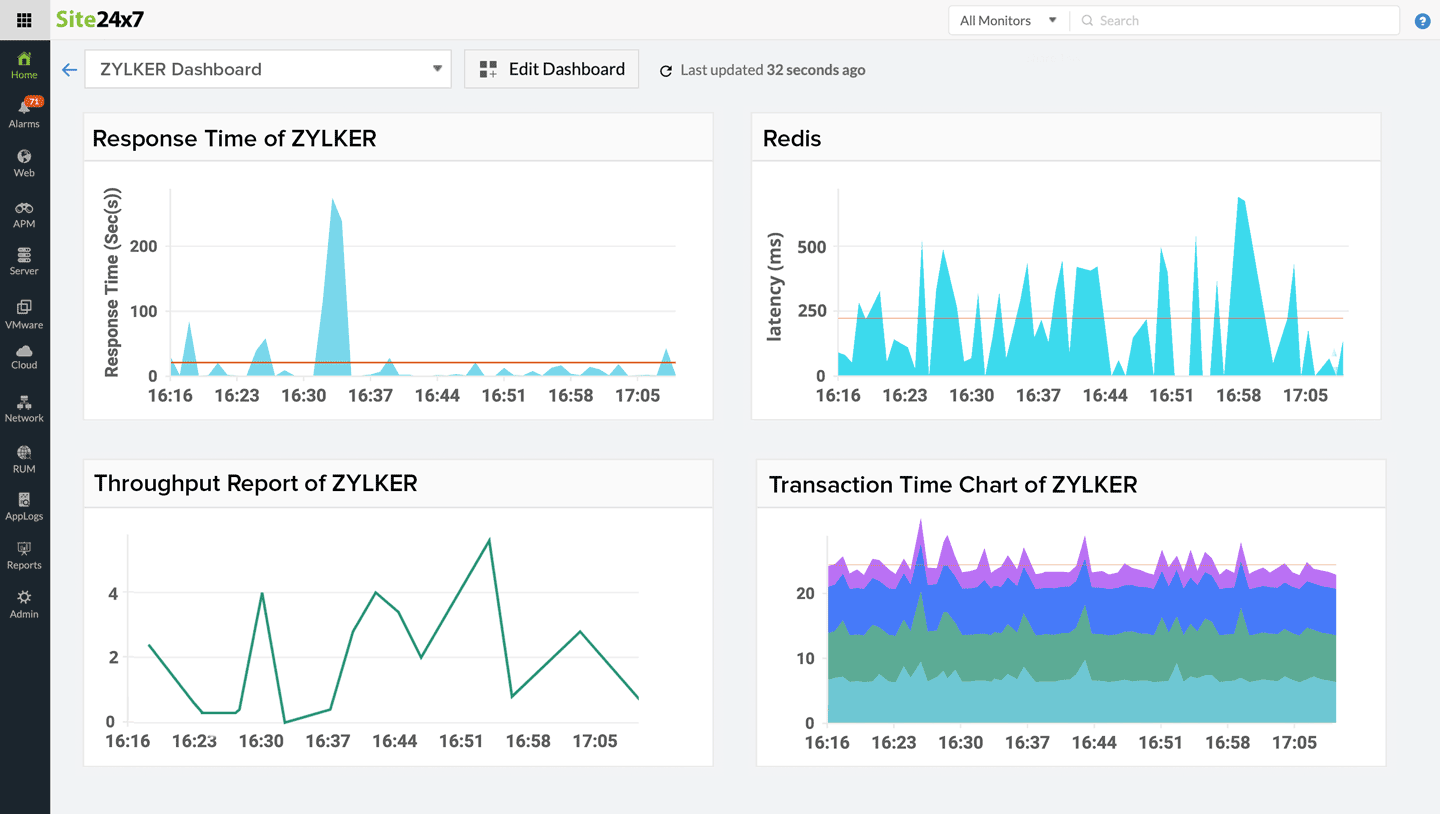
Site24x7 includes an application performance monitor that follows web applications across hosted and on-premises environments. It tracks response times, error rates, transaction activity, and resource usage so teams can find problems before users start to feel the impact.
Key Features:
- Watches on-premises systems as well as hosted workloads
- Tracks databases, web servers, and related services
- Provides dedicated visibility into web application performance
Why do we recommend it?
Site24x7 is worth recommending because it shows application behavior from the user-facing layer down into the supporting stack. That makes it easier to spot bottlenecks, failures, and service degradation before they spread into wider downtime. The APM also sits alongside server and network monitoring, so teams can investigate application slowdowns in the context of the infrastructure around them.
Integration with application servers, databases, web servers, and other dependencies adds another layer of value. Instead of reviewing isolated metrics, administrators can see how the different parts of the stack interact and where performance issues originate.
The service also includes distributed tracing, which is especially useful in microservices and multi-tier environments. By following individual requests across services and layers, the platform can highlight slow transactions and failing components with much less guesswork.
Who is it recommended for?
This package is a strong fit for organizations that run distributed application architectures and want easier troubleshooting in complex environments. Automatic discovery and dependency mapping reduce setup effort, and the platform is also available in an MSP edition for service providers.
Pros:
- Includes code profiling and distributed tracing
- Uses AI-driven alerts for earlier warning of abnormal behavior
- Sits inside a broader full-stack observability platform
Cons:
- No on-premises hosting options
Site24x7 APM is part of the wider monitoring and management platform. You can try the full service through a 30-day free trial.
4. Datadog APM
Datadog is a cloud platform of system monitoring and management tools. Its services keep expanding and evolving and the APM module is actually a group of services. With an APM subscription, you get application dependency mapping, distributed tracing, and code profiling.
Key Features:
- Part of a cloud platform of IT system monitoring tools
- Distributed tracing and code profiling
- Application discovery
Why do we recommend it?
Datadog APM is part of a SaaS platform of monitoring and system management tools. The APM is specifically designed to track web applications. Datadog provides the Infrastructure Monitoring package for all other applications and software packages. The APM includes a distributed tracing and code profiling system.
The distributed tracing service implements the OpenTelemetry and OpenTracing standards. These systems are industry-wide standards and many producers of microservices integrate debug messages within their procedures that the distributed tracing system in Datadog is able to pick up.
The code profiler will scan through plain text code, written in PHP, Python, Java, .NET, Node.js, Ruby, Go, and C++. The combination of mapping tracing, and profiling provides a full stack record of everything that your systems do together with reports of supporting services and the activities that your applications provoke.
The operation of many interacting modules is complicated and there is often no standard pattern to look out for. This makes programming performance measurements difficult and so there are customizable thresholds in the Datadog platform that relate statistics to each other, looking for variations in throughput levels, identifying outliers, and raising alerts. By refining these alerts, you can iron out false-positive reporting and get accurate notifications when they matter.
Who is it recommended for?
This unit is aimed at companies that create and manage web applications, particularly when used in conjunction with the continuous testing unit for CI/CD pipelines or the Application Security Management service. Consumers of web applications can also use this system to identify security or performance problems.
Pros:
- Offers numerous real user monitors via templates and widgets
- Can monitor both internally and externally giving network admins a holistic view of network performance and accessibility
- Changes made to the network are reflected in near real-time
- Allows businesses to scale their monitoring efforts reliably through flexible pricing options
Cons:
- Would like to see a longer trial period for testing
The APM is available with or without the Code Profiler module. You can get a 14-day free trial of the entire Datadog platform.
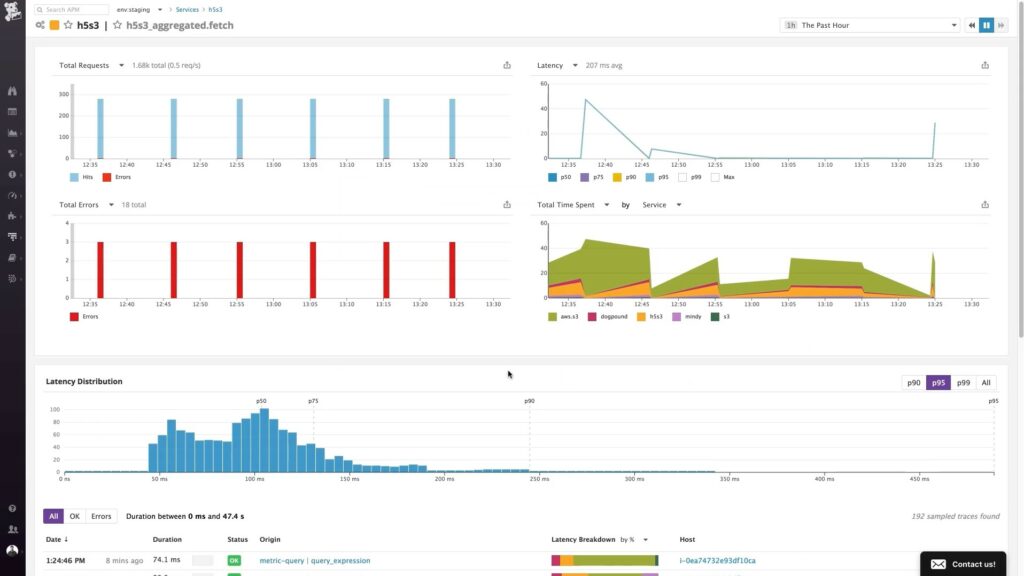
5. AppOptics APM
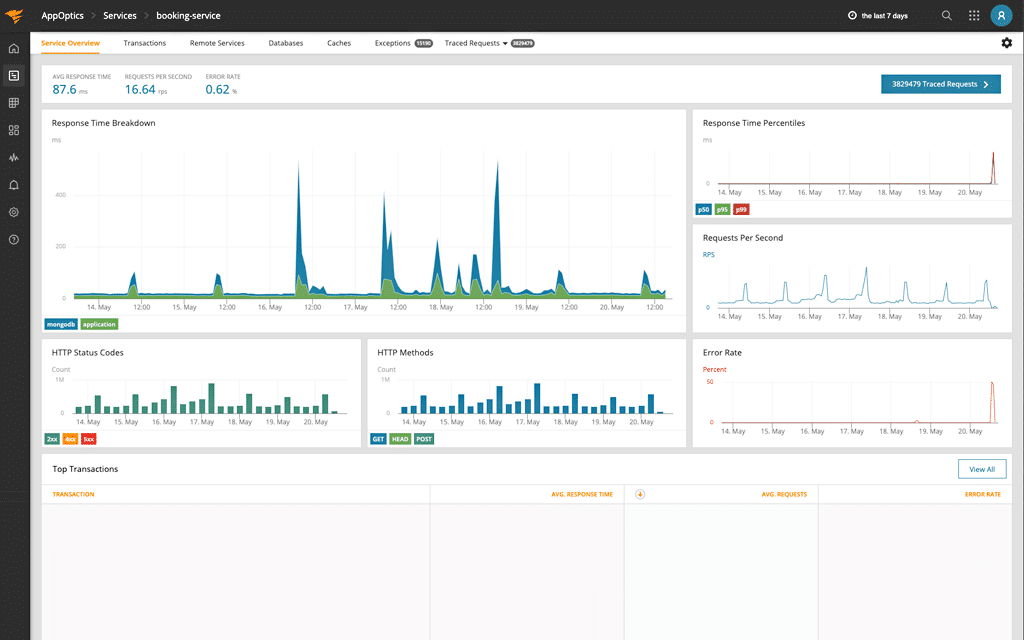
The AppOptics system gives you a choice of Infrastructure Monitoring or APM + Infrastructure Monitoring. Thus, the AppOptics APM is always delivered with monitoring services for all of the systems that support applications. The package watches over all of the server resources that support software and chains all the way up to the interfaces that users see.
Key Features:
- Monitors infrastructure and middleware
- Distributed tracing for third-party web applications
- Code profiling for visible code
- Two plan levels
- A SaaS platform
Why do we recommend it?
AppOptics is able to implement distributed tracing for web applications in its APM module and services, such as databases and web servers in its Infrastructure Monitoring unit. This combination of services covers all of the applications that any business might run. This is a SaaS package.
The APM focuses on serverless systems, identifying all of the code that lies behind microservices, APIs, and frameworks. These units can often be overlooked when tracking the performance of an application even though they perform the bulk of the work that produces the user-facing system. The monitoring system provides a live application dependency map and then performs distributed tracing on each discovered module to record performance metrics.
Systems that are delivered in plain text programming languages, such as Java, Python, and PHP are subjected to code profiling, which tracks each line of a function as it executes. This enables the APM to identify exactly where performance problems originate. Right down to the line of code.
The full stack observability system that is at the heart of the APM + Infrastructure package provides live root cause analysis, enabling system managers to see immediately whether the true cause of an application’s performance problem is actually a server resource or a connectivity issue.
Who is it recommended for?
This package is very scalable, sold in units of 10 servers or 100 containers. Businesses that don’t manage web applications will be able to subscribe to just the Infrastructure Monitoring unit, which is more affordable than the full package that includes the APM. Plans scale up to cater to large companies as well.
Pros:
- Offers great visualizations reflecting live and historical health metrics and resource consumption
- Is easily scalable cloud service
- Tracks all major resources focusing on over 180 different metrics
- Can monitor Docker, Azure, and Hyper-V platforms, offering more flexibility than competing options
Cons:
- Would like to see a longer trial period
The AppOptics service is charged for by subscription with a monthly rate or an annual charging period.
You can try AppOptics APM on a 30-day free trial.
Summary
App monitoring is another essential piece of the puzzle to ensuring your infrastructure stays operational, you know how your applications are running, how they’re being utilized, and how they’re growing. With this data, you can more easily plan equipment acquisition, find problems with your applications easier, and know that your clients are able to complete their transactions smoothly.
Don’t forget or neglect this crucial piece of IT infrastructure. When you’re in a bind, your application monitoring package will probably save your bacon.
Application Monitoring FAQs
Why is application monitoring important?
Application monitoring is important because it allows organizations to identify and fix performance issues before they impact end users. By monitoring applications, organizations can improve user experience, reduce downtime, and improve overall application performance.
What are some common application monitoring tools?
There are several application monitoring tools available, including AppOptics, New Relic, AppDynamics, Dynatrace, and Splunk.
What types of applications can be monitored?
Most types of software applications can be monitored, including web applications, mobile applications, desktop applications, and cloud-based applications.
What is synthetic monitoring?
Synthetic monitoring involves simulating user interactions with an application to monitor its performance. This can help identify performance issues before they impact end users.
What is real user monitoring (RUM)?
Real user monitoring (RUM) involves monitoring the performance of an application from the perspective of end users. This can include collecting data on user behavior, such as page views and clicks, and using that data to identify issues and improve user experience.
What is code-level monitoring?
Code-level monitoring involves monitoring the performance of application code to identify issues and optimize performance. This can include collecting data on function calls, memory usage, and CPU usage.