Are you winning the battle to tame your network? Or are you constantly are surprised by servers running out of disk space and bandwidth shortages?
Does the ring of your cell phone make you shudder and wonder what just broke? If you answered yes, then you need better network management software!
ManageEngine OpManager can help you take control of the network. OpManager is a powerful network management system that includes features like network monitoring, alarm notification, health reporting, and more.
Features
OpManager has a long list of features that make network monitoring simple and efficient, including some great new features over earlier versions.
Some of the new features include:
- Hyper-V support – OpManager now provides Hyper-V tracking, monitoring, and inventory features.
- New Improved UI – Menus have been reworked for easier navigation and more intuitive use.
- REST API – New APIs provide a way to fetch data from OpManager from other 3rd party service desk applications.
How well does it all work? Let’s jump right into the product, starting with:
Easy Installation and Configuration
Installation was fast and simple. A small number of options presented themselves: whether to install as a service, which web port to use, and whether to use the built-in MySQL or a standalone MSSQL server to name a few.
Configuration is the next step, and OpManager presents a helpful list of recommended tasks on startup. First on the list is network discovery – enter your SNMP strings and IP ranges, and away you go.
In general, configuration is very easy.
It’s simple to add devices or to discover new networks.
OpManager allows admins to create Templates that can be assigned to devices, making it easy to set a large number of devices to be treated the same way.
Templates specify settings like polling intervals, and parameters that will be monitored on each device.
For example, all file servers could be placed into a template that would activate disk utilization, memory, and CPU monitoring.
IT Workflow Automation
One of the new features in OpManager 9 is something they call “IT Workflow Automation.” What is it?
IT Workflow automation allows administrators to automate routine maintenance, as well as troubleshooting tasks that they would perform when a network fault occurs.
For example, suppose that whenever a website fails, your first tasks would be to ping the server, and attempt to re-start the web-service if the server is up.
IT Workflow automation can do that for you – minimizing downtime and giving you time to find the real cause of the problem.
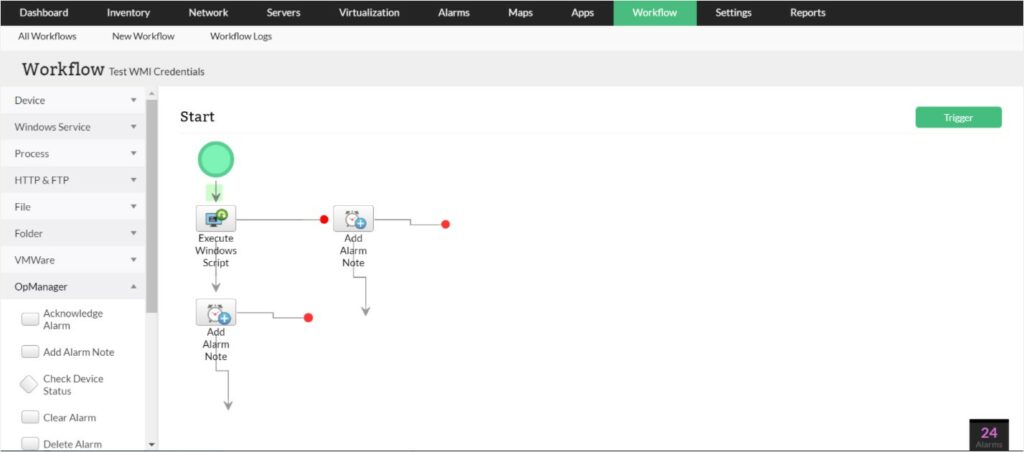
IT Workflow Automation
Script Monitoring
Closely related to Workflow Automation is Script Monitoring. If you’re like most admins, you have a many scripts that you use to retrieve data and perform tasks on your servers.
OpManager allows you to bring all of those scripts together into a single management console – making it easy to share common scripts among all of your servers.
It also supports setting thresholds and alerts on script results – which could then kick off automated tasks to repair problems. All in all, a very cool set of features!
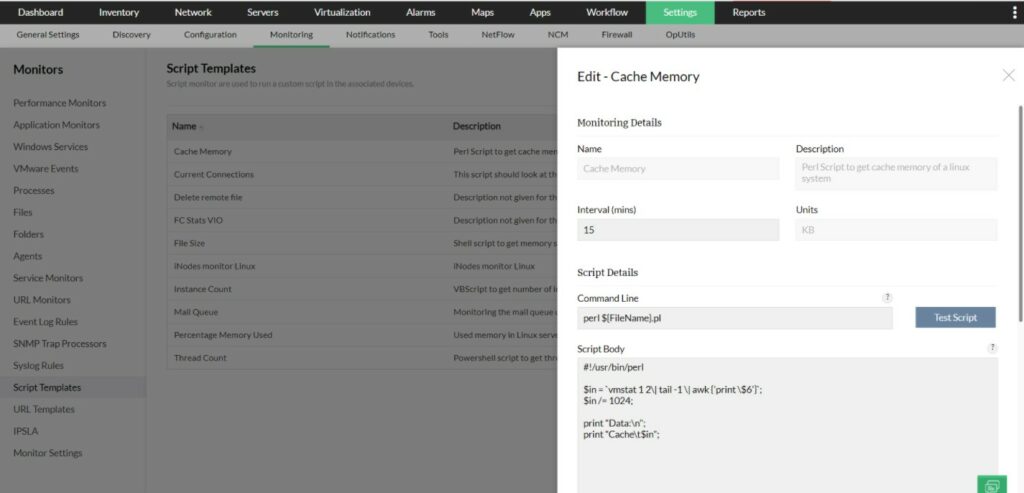
Script Templates and script monitoring
Dashboards
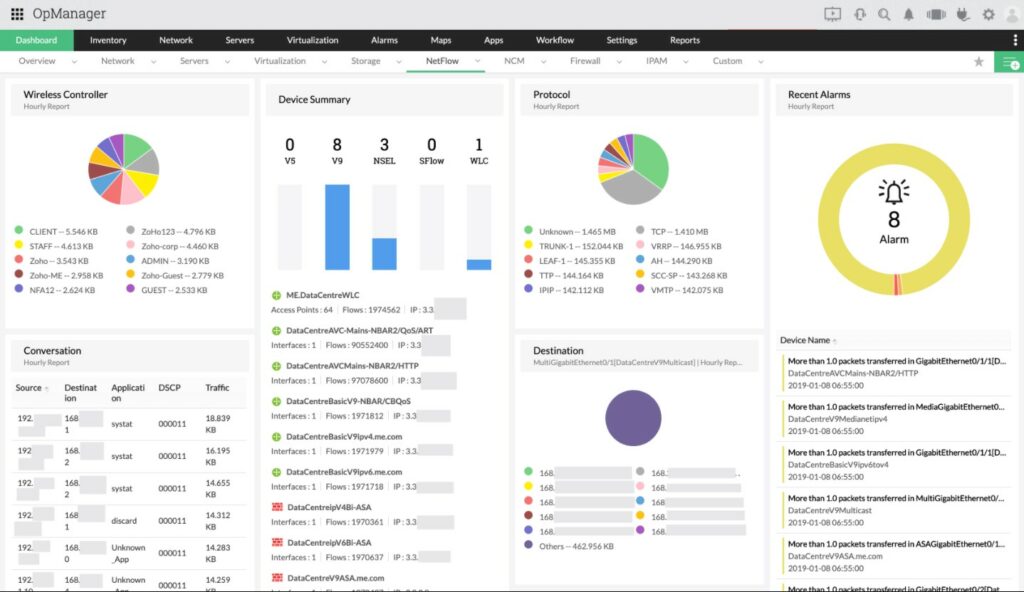
One of the first things you’ll see in OpManager is the Dashboard, an at-a-glance summary of your network.
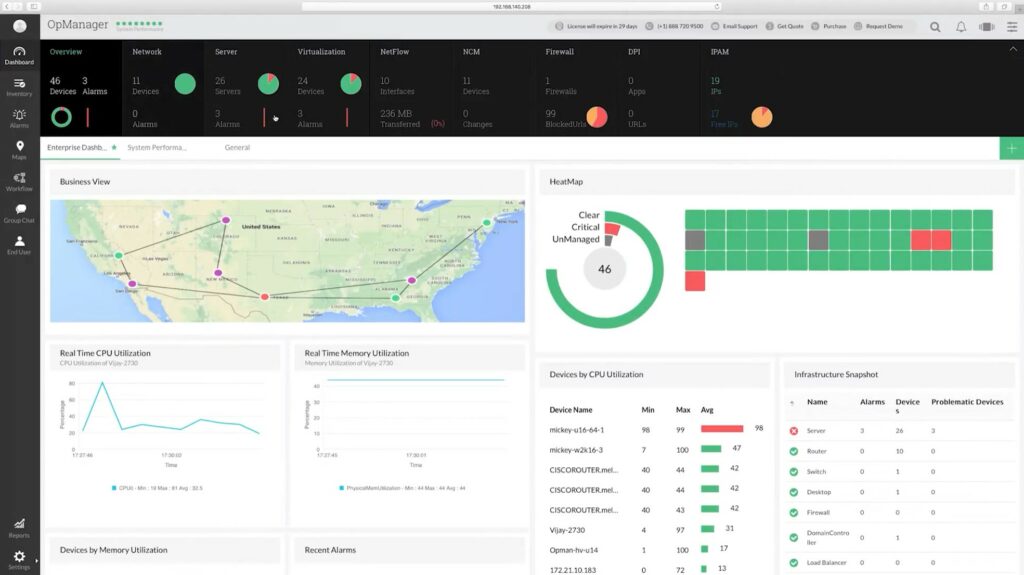
Dashboard Widgets
Several different dashboard views are available, and all can be customized to suit your particular needs. Widgets can be added, removed or customized to show data you find useful.
The dashboard is a great help for troubleshooting. For instance, you could add a real-time chart to monitor key variables – memory, CPU, interface traffic, and much more.
Then, you can see instantly if your internet connection is saturated, or if your server is out of disk space.
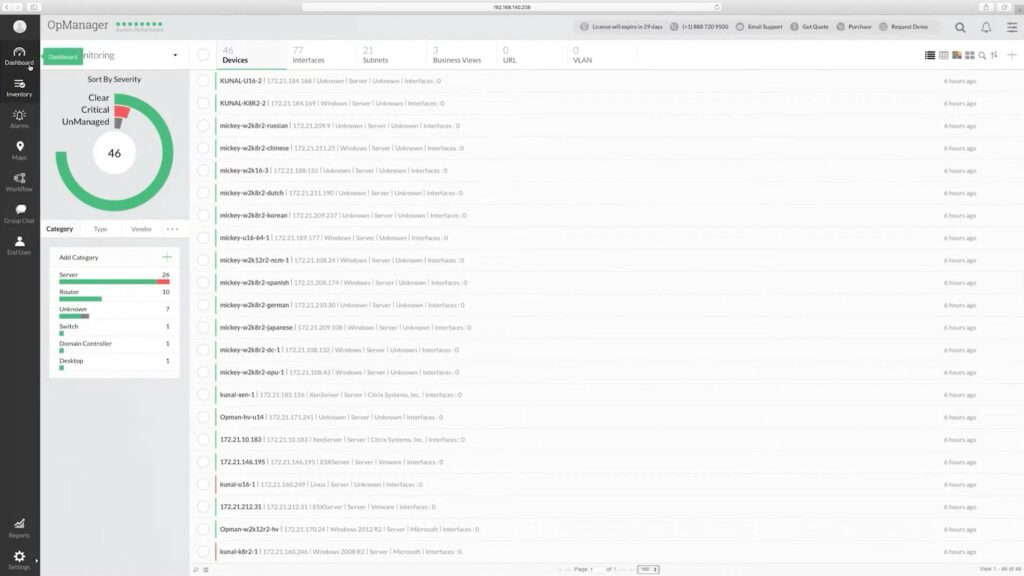
Dashboard Overview
Device Monitoring
Device monitoring is at the heart of any network management software.
OpManager does a great job of monitoring devices for potential problems.
It can use standard SNMP as a monitoring method, but it can also use WMI to monitor Windows servers and Active Directory.
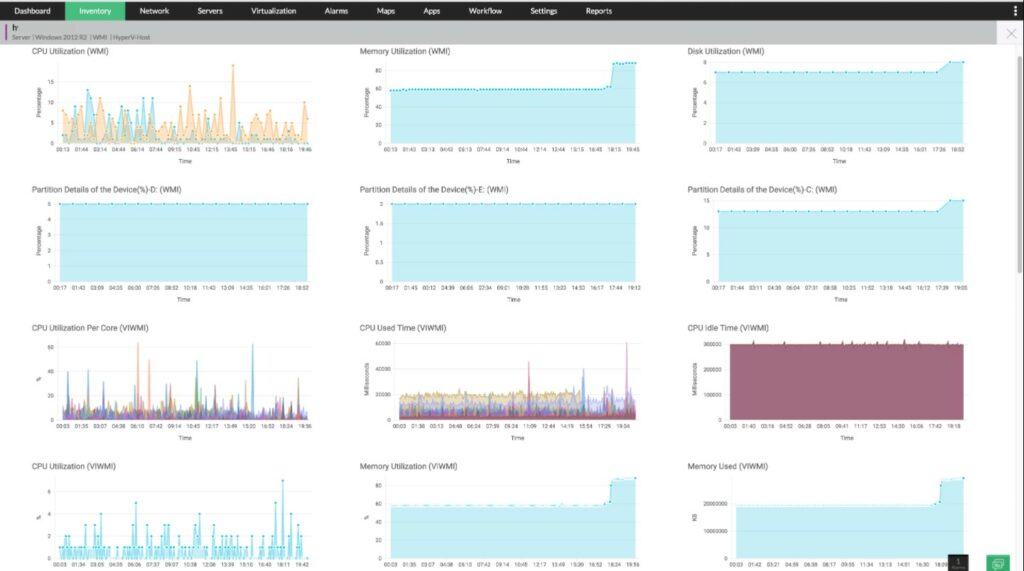
WMI Monitoring
And, it can use SSH/Telnet to monitor statistics for Linux servers.
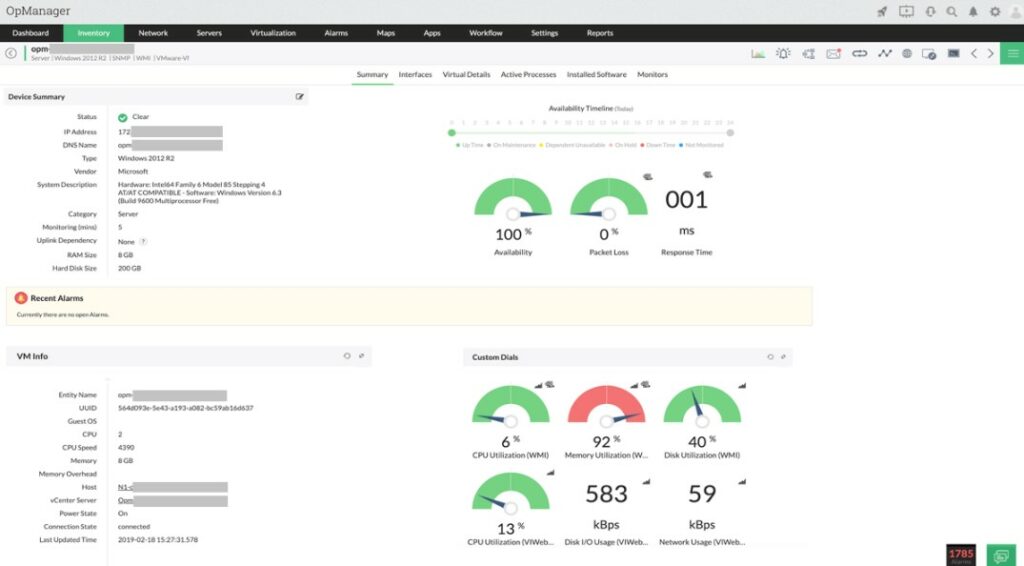
Device snapshots display current statistics for monitored systems.
The snapshot page contains information on response time, availability, and various other key metrics depending on the type of system being monitored.
Network Devices
You’ll also find detailed information on interfaces, as well as trend data through links at the bottom of the snapshot window.
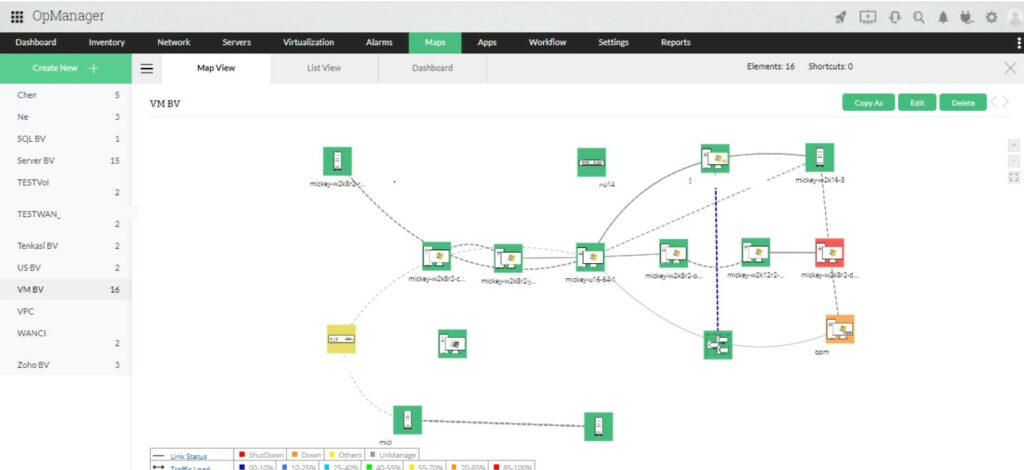
Mapping
The newest version of OpManager adds some nifty new automatic mapping features.
Administrators simply chose a “seed device,” and the system dynamically maps the other devices connected to it.
Devices are shown with a status icon, enabling an instant view of any trouble spots on the network.
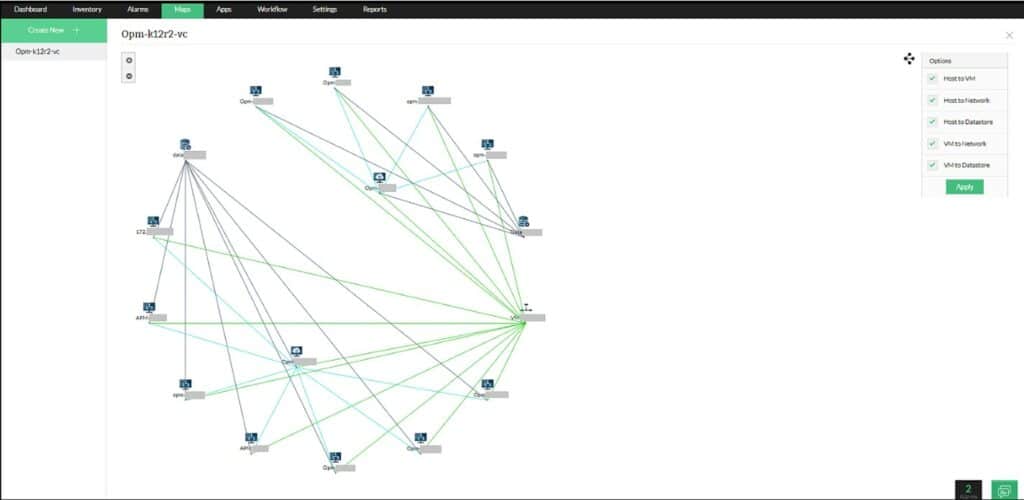
Network Mapping
URL monitoring
Have you ever been caught when a website failed, even though the server was up and running?
Say goodbye to that problem thanks to the URL monitor. The URL Monitor can perform synthetic transactions, testing to verify that login pages and other web-applications are always working.
Another feature is called “Content Match.” This useful tool allows administrators to monitor a page for specific text.
If that text ever goes missing for any reason – maybe an accidental delete or worse, a malicious attack – then an alert is triggered allowing a fast response.
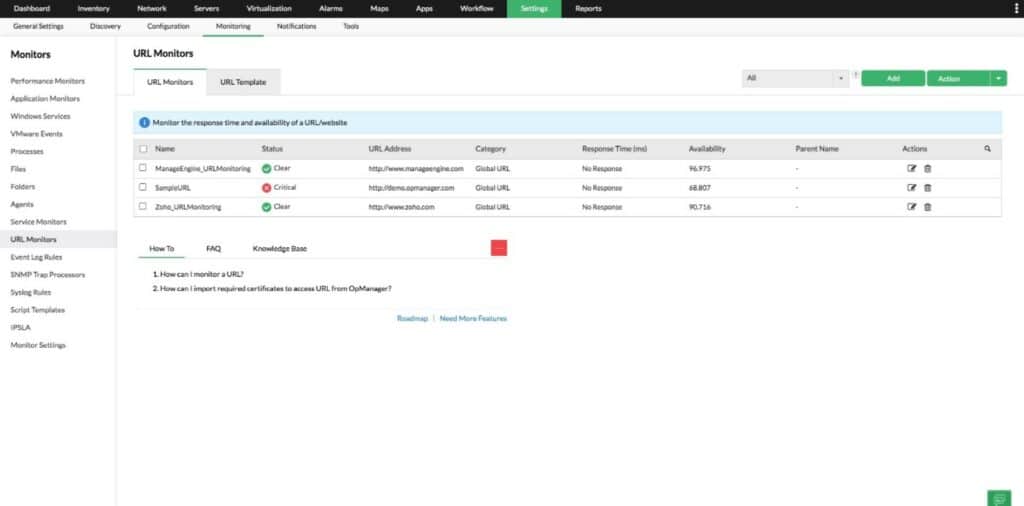
URL Monitoring
Reporting
OpManager has a fantastic reporting engine that can generate many different types of reports.
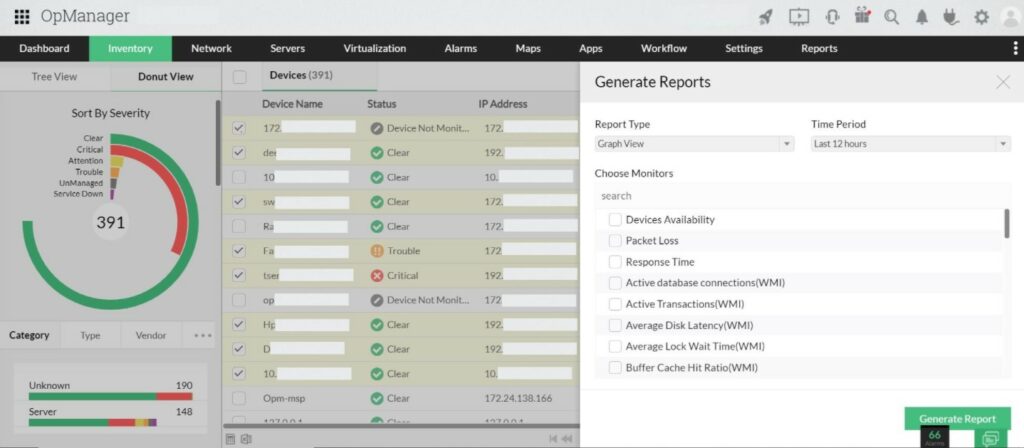
Report Generation
We can’t cover them all, but here are a few examples of the kinds of reports available.
Service level reporting provides a helpful overview of the network’s availability – great for showing the boss what an excellent job you’re doing of keeping the network running.
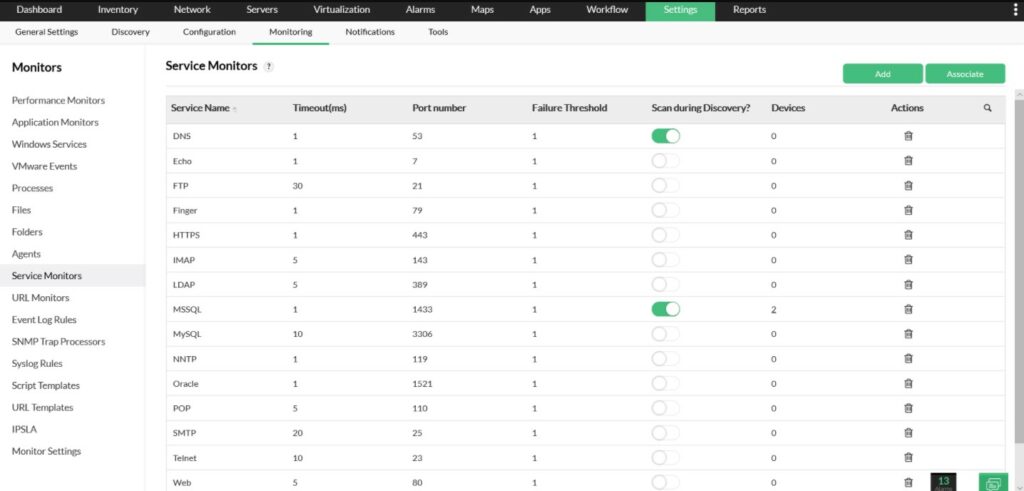
Service Monitors
At a glance reports provide a summary of key metrics for a device, providing a fast way to identify potential performance problems and bottlenecks.
Index Snapshot
Health reporting dives a little deeper, and contains statistics for key performance metrics for specific devices.
This type of report helps to identify problem devices or circuits in relation to the rest of the network.
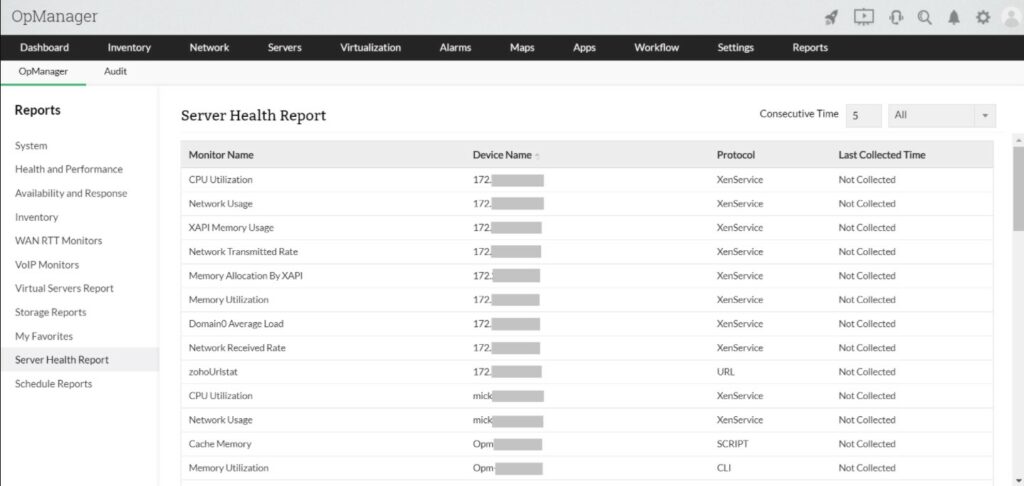
Server Health Report
Finally, custom reporting allows administrators to query variables for specific devices and date ranges.
The only downside to custom reporting is that it is not run from the Reporting module – it is accessed by clicking on a device, then by opening up one of the graphs shown on the device’s detail pages.
Overall, the reporting module is improved over previous versions of OpManager.
It is more fully-featured and easier to use, and allows creating of custom reporting as well as filtered report views based on “business views” which are like lists of devices.
On the other hand, I’d still love to see a simple query engine that would allow an admin to generate trend reports on the fly, for any monitored SNMP variable on any device.
But we’re getting into wish-list territory, and the default reporting is generally excellent.
The User Experience
Overall, OpManager provides a great user experience and version 9 brings several improvements that make it much easier to use.
The menu system has been reworked, and is now much more user friendly and intuitive.
The system allows for creation of multiple users with various levels of access. The UI also supports rebranding – changing the overall look-and-feel to use your own corporate colors and logos.
Additionally, the entire console is administered and accessed almost entirely via the web-console. This makes management a breeze.
Alarms
What network management software would be complete without alarms and notifications?
OpManager doesn’t disappoint here either, with the ability to set threshold alarms to trigger a range of notification methods. All the usual suspects are here: email, SMS text, run scripts, etc.
Two useful features help to make the alarms well rounded.
A downtime scheduler allows admins to set outage windows in the system – perfect for reducing needless notifications during planned maintenance.
And, dependencies can be set so that an outage to a key device doesn’t flood admins with alerts for all of the systems behind that device.
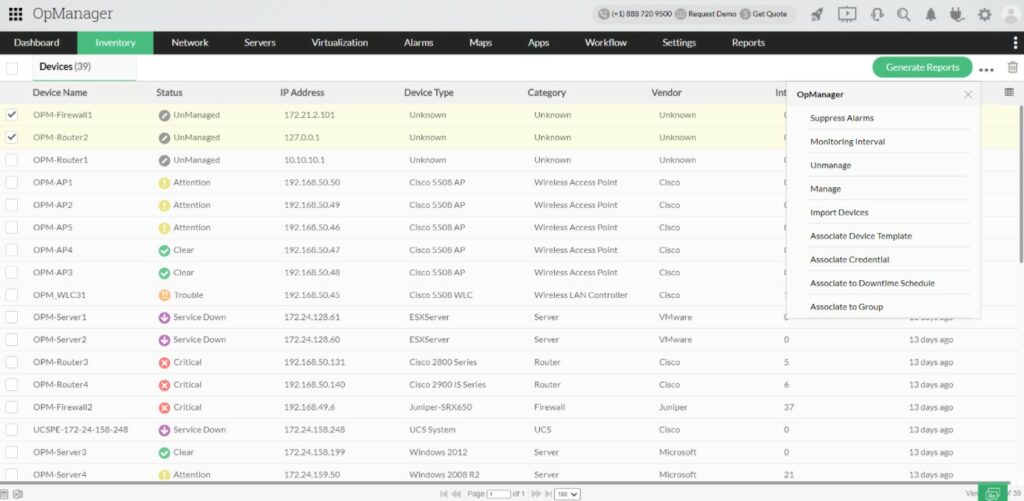
Suppress Alarms
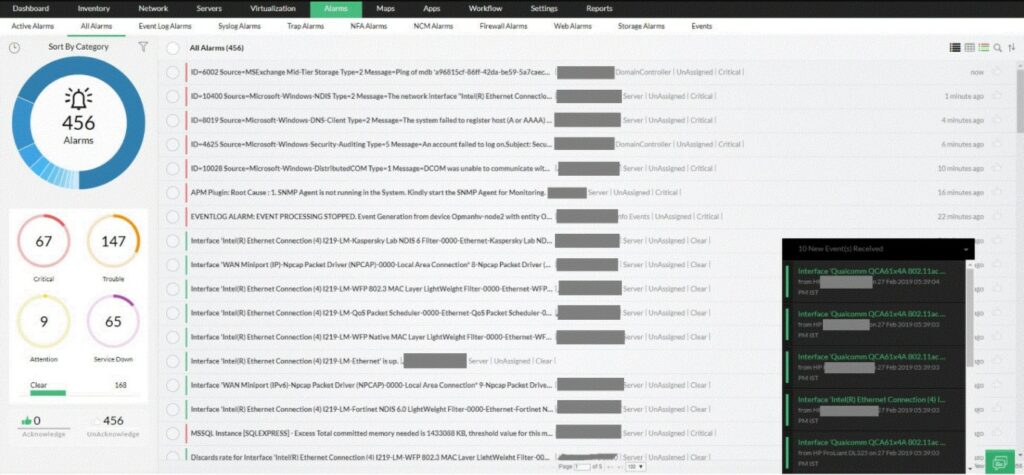
Clicking on an alarm provides a drill-down view of the alarm and event history for the device in trouble.
The detailed view is a great troubleshooting tool, helping to identify chronic problems.
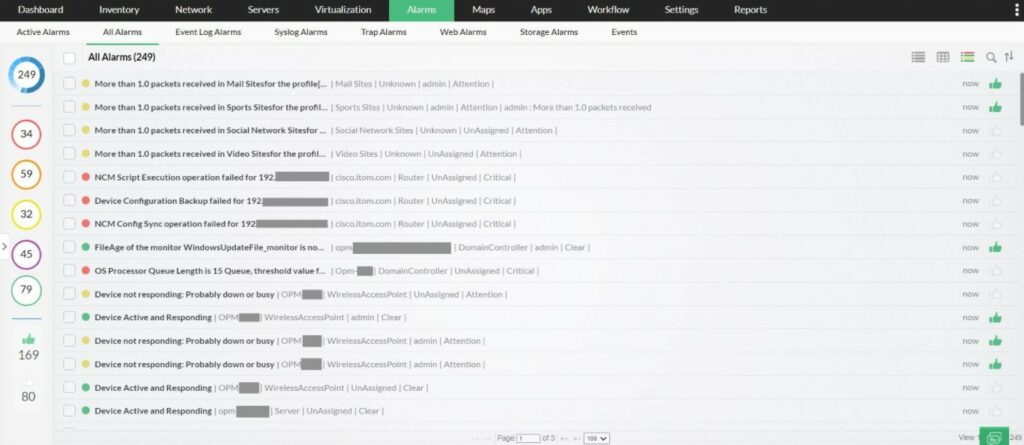
Alarms Event History
Also under the Alarms module: a useful “Devices to Watch” dashboard, which shows all devices that have triggered various types of alarms.
The dashboard shows the device name, status, and key performance stats on CPU and Memory usage.
Alarms Devices – List View
The only complaint I can find is that OpManager still doesn’t have the ability to set multiple threshold alarms – yet.
The good news: ManageEngine tells us this feature is coming in a very near future release of the product.
Having multiple thresholds allows an administrator to specify that warnings will be triggered at a certain threshold, and a critical alarm at another level.
This would be useful for monitoring things like temperature or disk utilization that might creep up gradually – and allow administrators to monitor the situation before a critical state is reached. It will be a welcome addition once it’s available.
Plugins
ManageEngine offers several plugins as separate products that integrate smoothly with OpManager.
There are too many to cover here, but examples include their VOIP monitor, and a useful tool called “Compliance Manager.” Compliance Manager scans devices and identifies if a specified policy is not met.
For example, in the screenshot below Compliance Manager has identified several critical violations on a Cisco device.
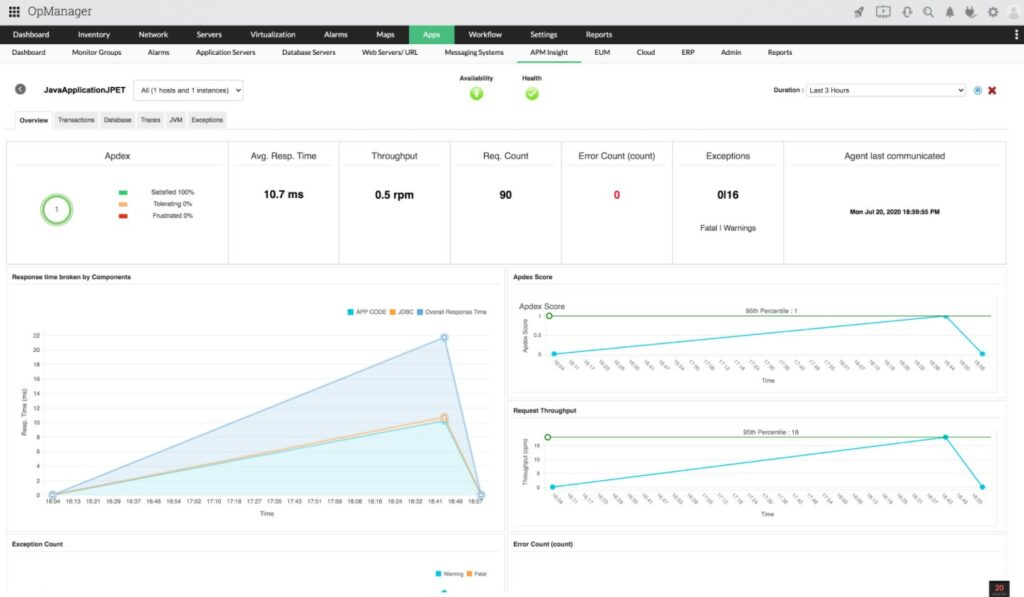
Apps and Plugins – Insights
Other available plugins include:
- WAN RTT (Round-Trip-Time) Monitor, using Cisco IP SLA Technology.Monitor WAN links for latency, bandwidth utilization, Round–Trip–Time and other key performance indicators.
- NetFlow Traffic Analysis The NetFlow plugin provides detailed graphs and reports that show not just how much traffic, but also what kind of traffic is flowing over the network.We recently reviewed the stand-alone NetFlow Analyzer from OpManager, and recommend it for anyone struggling to understand why they never have enough bandwidth.
- Network Change Configuration Detect changes to your network devices when they happen, and automate backups.
Pricing and Editions
OpManager’s pricing varies depending on how many devices you need to monitor – but the pricing scale has affordable options for everyone from small business to large enterprises. For example, a 50-device license would cost as little as $1,995.
In addition, different plug-in software can be purchased that add extends functionality.
OpManager has several editions, including an Enterprise edition which is scalable up to 50,000 interfaces.
It also has options for high-availability thanks to hot-standby servers and probes.
Given the range of pricing available, we recommend contacting ManageEngine for a price quote. More information can be found on their website.
| Features | Standard Edition | Professional Edition | Enterprise Edition |
|---|---|---|---|
| Starting Price | $245 [10 devices] | $345 [10 devices] | $11,545 [250 devices] |
And, trial versions of OpManager are free for 30 days!
Summary & Video Walkthrough by Aaron
OpManager was good before – now it’s great! It is an extremely versatile, feature-rich system, made better by new features like Mapping, Hyper-V support, and the improved UI. Alerting is comprehensive and full of information sure to help administrators fix problems faster.
The reporting module provides data that will be useful for everyone from administrators to service managers. And, features like URL monitoring provide assurance that websites critical to the business are online.
On the downside, it still doesn’t have multiple-threshold alarms, but that feature is on the roadmap and no doubt will appear soon.
In our opinion, the new and improved OpManager is well worth your time to test out.
Try out OpManager’s 30-day free trial download and see what you think.
Product: ManageEngine OpManager
Review Date:
Rating: 4.5 

Pros:
- Great monitoring features: URL Monitoring, SNMP, Hyper-V, and more.
- Cool mapping abilities!
- Automate routine tasks and troubleshooting.
- Improved UI make navigation easier.
Cons:
- No multi-threshold alerting.
- Custom trend reporting for any variable is still on the wishlist.
ManageEngine OpManager FAQs
What are some of the features of ManageEngine OpManager?
Some of the features of ManageEngine OpManager include network performance monitoring, bandwidth analysis, network configuration management, virtualization monitoring, server monitoring, application monitoring, firewall log analysis, and advanced network analytics.
What are the benefits of using ManageEngine OpManager?
The benefits of using ManageEngine OpManager include improved network performance, enhanced security and compliance, reduced downtime, better resource utilization, simplified network management, and cost savings through consolidation of multiple tools.
Is ManageEngine OpManager easy to use?
Yes, ManageEngine OpManager is designed to be user-friendly and easy to use, with a customizable dashboard and intuitive navigation.
Does ManageEngine OpManager support multiple platforms and devices?
Yes, ManageEngine OpManager supports multiple platforms and devices, including Windows, Linux, Unix, VMware, Hyper-V, routers, switches, firewalls, and other network devices.
What is the pricing model for ManageEngine OpManager?
ManageEngine OpManager is available in both perpetual and subscription-based licensing models, with pricing based on the number of network devices and the level of functionality needed. A free trial is also available.
What kind of support is available for ManageEngine OpManager?
ManageEngine provides a range of support options for OpManager, including online documentation, forums, email support, phone support, and professional services such as training and consulting.
What are some alternatives to ManageEngine OpManager?
Some alternatives to ManageEngine OpManager include SolarWinds Network Performance Monitor, PRTG Network Monitor, Nagios, Zabbix, and Datadog.
Is ManageEngine OpManager suitable for small businesses?
Yes, ManageEngine OpManager is suitable for small businesses as well as large enterprises, with a range of licensing options to meet the needs and budgets of organizations of all sizes.
