First thing I am going to admit, is that that PRTG has certainly come a long way.
I remember using this monitoring tool years ago a few jobs ago and it was not the same tool it is today.
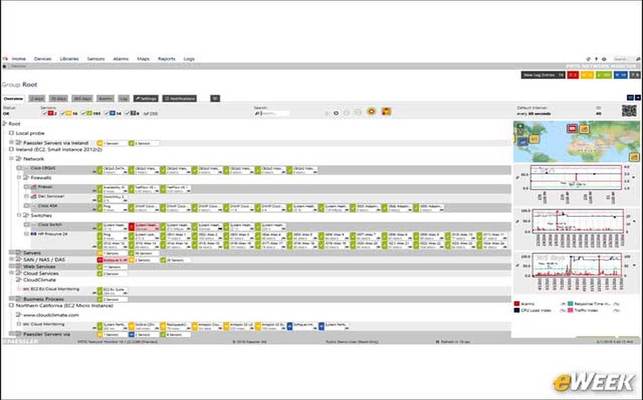
If I had to describe PRTG in one world it would be holistic, this network management suite is far more than a simple network monitor.
This tool has the capability of monitoring server infrastructure with just as much detail as it can monitor your network infrastructure.
Similar to other network management suites we have the typical functionality:
- Ability to generate network maps
- Built-in reporting capabilities
- Log and event monitoring
- Alerting capabilities
However PRTG offers quite a few things that set it apart from other network management suites:
- Built-in ticketing system
- Mobile Apps for iOS, Android, Windows, & BlackBerry, including an app for the Apple Watch
- Thick client for Windows Desktop operating systems
- Simplistic licensing system and a simple scaling nature
- Number of different sensors you can monitor out of the box without the need to install plug-ins or additional modules.
The built-in ticketing is without a doubt a simple and very useful feature, monitoring the network is one thing but being able to keep up with infrastructure troubles and issues is usually an entirely different obstacle in itself.
The feature is simple enough, you can create tickets based on specific assets within PRTG with the ability assign and resolve tickets.
I feel there is definitely some room here for improvement perhaps with adding functionality to create a knowledge base articles or a more advanced reporting feature centered around ticketing.
However, the current features are helpful and useful within its own right.
Accessing PRTG Ticketing
PRTG Ticketing Windows Overview
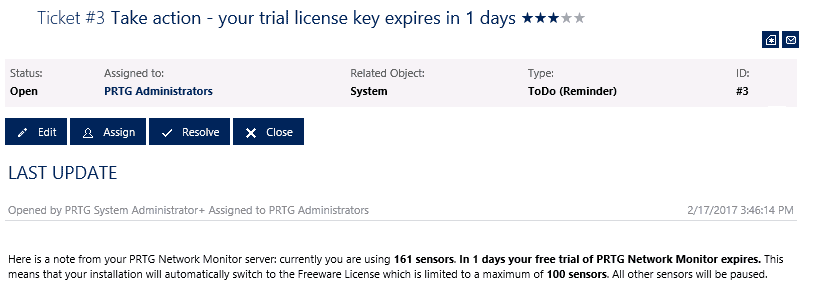
Viewing a single ticket.
PRTG also has quite the simplified licensing model, unlike other monitoring solutions that require you to license multiple independent modules this application simply applies licenses based on the number of sensors you utilize.
You can see the simple breakdown on Paessler’s Licensing & Pricing Page.
The one thing to keep in mind with licensing and PRTG is the fact that every single sensor utilizes a license so it is very easy to utilize 5+ sensors on a single server depending on the applications running on that server.
You can occupy licenses extremely quickly without realizing it.
You can see from the below screenshot we are monitoring via ICMP, HTTPS, and the status of the SSL Certificate installed on the web server itself.
So there is certainly no lack of information available to you.
You can click into any of these sensors to gain a much more detailed look into what each sensor provides you.
For example, let’s review an SSL Sensor:
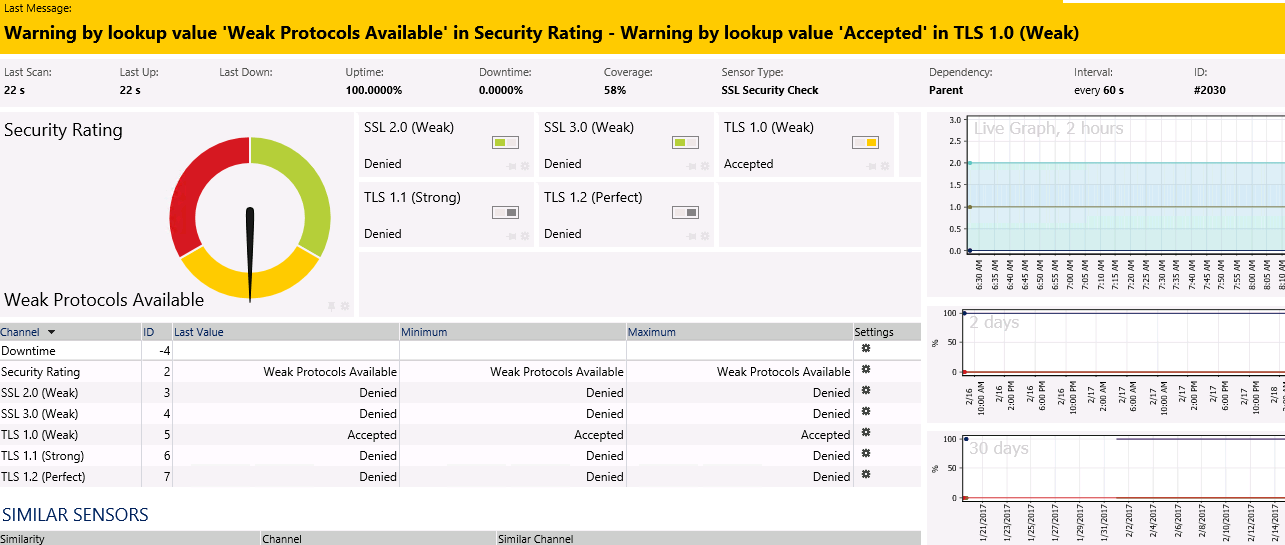
Overview shot of an SSL Sensor
Close-up view of historical sensor data
Time lapsed tabs for easy access to more details
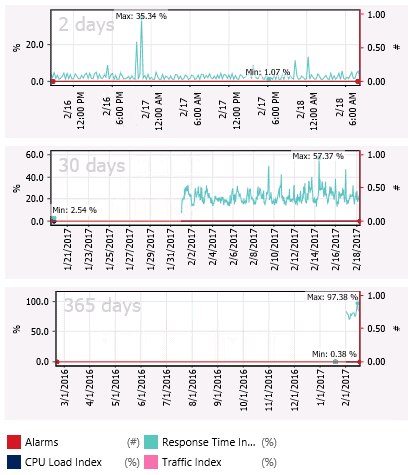
We can see on right hand side, historical information ranging from 2x hours, 2x days, then 30x days out giving us a brief birds eye view of any trending data.
You can also see how much detail was placed into this individual type of sensor.
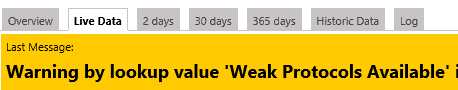
Considering this is an SSL sensor PRTG breaks down the ‘security’ level of the sensor. This particular sensor is smart enough to know what SSL & TLS version are considered strong or weak and flag it as such.
When it comes to viewing your infrastructure within PRTG, Paessler has quite afew different surfaces you can access this information from:
- Windows App (Thick Client)
- Mobile phone client – iPhone, Android, Windows, and even an app for your Apple Watch. I will admit when I heard about the application for the Apple Watch I had to think about that for a minute. I didn’t think that was such a terrible idea especially for the on-call engineer during the night or weekends when you want keep yourself informed about infrastructure events but don’t want to stay by your laptop all weekend.
- All PRTG extension applications can be found on Apps for PRTG page.
The next important part of this tool is the effectiveness of the user interface itself. I will say the interface may seem busy at times, but it is very effective for the amount of information it can delivery in a single screen.
The UI itself has not changed too much since the last review. As many widgets and graphs that are displayed on the screen may appear overbearing, they have incorporated a few different shortcuts to assist you with isolating the information you want.
I do hope for additional customization options involving the UI in the future.
Compared to other tools UI customization appears to be a little lacking.

Easily view historical viewing through time lapsed tabs.
Quick analysis summary of the different alarm types
Next up we will be comparing PRTG against many of the other network management suites, so stay tuned for the next network management software smackdown.
Steve’s Verdict
There is no question about it. PRTG is without a doubt a very holistic infrastructure management solution.
Now, after this review I hope you think of PRTG as more than just a network monitoring application. This tool is fully capable of monitoring server infrastructure just as in depth as it can monitor network devices if not better.
It Is difficult to find such an all encompassing solution without the added complicity of managing the tool or deciphering its licensing model, and that is where PRTG truly shines. Considering the ease the install, simplistic licensing model, and scalability of PRTG it is perfect for almost any organization.
There is one piece though, a key feature I find PRTG is lacking in and that feature is configuration management.
While you can say PRTG is a strict monitoring platform, I would argue that monitoring the configuration of your network equipment is just as important as monitoring the overall health of the actual device.
With that said though this tool certainly pulls its own weight even with the oversight of configuration management.
With the rise of of certain technologies like Ansible and the popularity of python configuration functionality can be offloaded with a little bit more work.
A friend and co-worker has also blogged about his experience with a recent presentation from Paessler in which he offers another great perspective regarding this monitoring platform touching on additional topics I did not discuss in this article.