![]() In today’s networks, bandwidth consumption seems to expand to use up any available bandwidth. Demand can be driven by business use of cloud services, VOIP and Video, online applications, and centralized services.
In today’s networks, bandwidth consumption seems to expand to use up any available bandwidth. Demand can be driven by business use of cloud services, VOIP and Video, online applications, and centralized services.
But, it can also be consumed by users with their own devices like iPads, Android Phones, and laptops; or for personal use of social media, video and photo sharing sites, and peer-to-peer networks.
Often, the solution is to throw more bandwidth at the problem – but that’s an expensive approach that doesn’t address the real issue. In time, critical applications are once again starved of needed bandwidth, and eventually slow down or stop working.
But there is a better way!
The ManageEngine NetFlow Analyzer helps by identifying exactly what types of traffic travel over the network. This allows administrators to take action that could save bandwidth, and delay or reduce the need for costly upgrades.
Key Features:
- Traffic Analysis: Identifies and categorizes network traffic to optimize bandwidth usage.
- Graphing and Reporting: Provides detailed charts and graphs to visualize traffic by devices, applications, and custom groups.
- Bandwidth Hog Identification: Allows creation of device groups to identify and manage bandwidth-heavy users.
- Detailed Reporting: Generates comprehensive reports on traffic, applications, sources, and conversations.
- Alerting System: Configurable alerts based on thresholds for IPs, subnets, applications, and protocols.
- Security Analysis: Advanced Security Analytics Module for detecting unusual traffic and potential threats.
The NetFlow Analyzer is installed on a server, and then network devices configured to send data to the Analyzer. Administrators access the Analyzer via an easy-to-use web console.
ManageEngine supports “Flow” data from a large number of hardware vendors, so it can collect NetFlow, J-Flow, and sFlow, data.
Graphing and Reporting
NetFlow Analyzer has a wide array of charts and graphs to help identify exactly what traffic is flowing on your network. Graphs are sorted by network devices, application types, or other custom groupings.
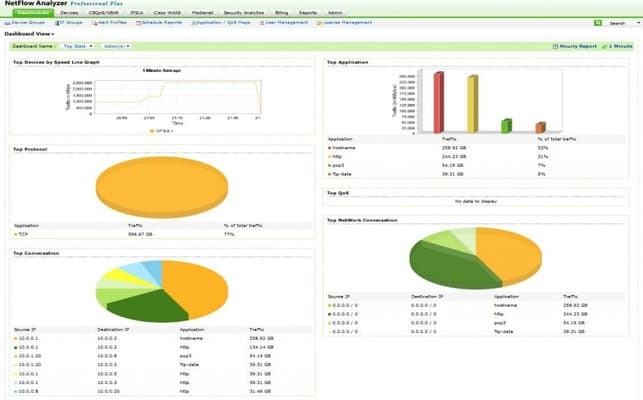
It shows who the “top talkers” are on the network, and what kind of traffic they are generating. Helpful dashboards, like the one below, show your network at a glance. The “Top Applications” graph shows what kind of applications use the most traffic – and NetFlow Analyzer can identify most common application types so there’s little guesswork involved.
“Top Conversations” shows which data flows and devices are generating the most traffic overall.

NetFlow Analyzer Dashboard
Identify Bandwidth Hogs
Device grouping allows administrators to create logical groups of devices or network subnets. This enables NetFlow Analyzer to generate charts and reports sorted by those custom groups. So for example, administrators could create groups sorted for different branches to determine what kind of data needs a specific workgroup has.
This could be useful for troubleshooting or move planning. Or, it could be easily used to monitor traffic for a group of application servers helping to show the network impact of new services.

NetFlow Analyzer Logical Groups
Drill down to an IP group to see more detail, including Total traffic, and in/out utilization.

Group Detail Reporting
Next you could click on the “Capacity Planning” link to jump to a detailed usage report for that group. The report includes some of the information already covered, as well as a very useful Application Report. The Application Report shows top applications used by volume and by percentage of total traffic.

NetFlow Analyzer Application Reports
Data for the group can be displayed in several ways: by application, source, destination, or conversation to name a few.
The screenshot below shows a conversation view.

Traffic by Top Conversation
Reports can be exported for use with other applications. NetFlow Analyzer includes native support for emailing reports, exporting to PDF, or exporting to CSV to make it easier to mine through data in Excel.
Alerting
Another useful feature is the ability to set Alerts. An alert can be created to trigger when specific IP addresses, subnets, applications, or port/protocol combinations exceed a threshold. Thresholds can be based on utilization, volume limits, speeds or packet rates.
If an alert is triggered, an email will alert administrators to the situation. Alerts can also be configured to only alert during business hours, though this appears to be a global setting and not configurable for individual alerts.
Security Analysis
NetFlow Analyzer can also help administrators to monitor network security with the add-on “Advanced Security Analytics Module”. Obviously this isn’t the same as running a dedicated security appliance, but rather it adds another layer of monitoring which is never a bad thing – and in fact might be just the right tool to complement existing security.
The Security Analytics module monitors all network flows for anomalies. If an unusual traffic flow is detected, it logs it and attempts to classify the behavior. This can be very helpful for detecting traffic generated by worms or DOS attacks.

Security Analytics Identify Threats
Reporting
The reporting module is where administrators can configure reports that are accessed regularly. A small range of application, conversation, source/destination, and other reports are available.
On the plus side, reports can be scheduled to run and be emailed on a regular schedule. But on the downside, the scheduling module doesn’t seem to talk to the report profiles – so setting up a schedule means that reports must be configured from scratch again.
It would be great if the reporting module felt more integrated with the other great reporting capabilities of the tool. The reporting UI can be a little frustrating to use. For instance when expanding a profile to select a report to view, after selecting the report the selection tree would disappear.
So if you clicked on the wrong report, you need to expand the tree again to find another report. But other than those few minor complaints, reporting works well and provides a wealth of information.

NetFlow Reporting Module
Pricing
Pricing for All of this is available at a surprisingly affordable price. Prices for the “Essential” edition start at $595 USD to monitor 10 network interfaces – which would be sufficient for most medium businesses to monitor their internet access and other key network devices. More information is available by requesting a quote from their website.
More information is available by requesting a quote from their website.
Summary
A NetFlow monitor is a crucial piece of network management software that every administrator should have. With ManageEngine’s NetFlow Analyzer it’s easy for an administrator to identify users who are sucking back excessive bandwidth for Peer-to-Peer file transfers, or even find machines infected with worms that could be generating malicious traffic.
Or, departments and workgroups can be grouped together for reporting, helping a business to fine-tune bandwidth needs when parts of the office move to new locations. On the other hand, it has a few small faults. For one, it would be nice to see the UI updated to be a little more intuitive and menu-like.
Clicking on various parts of the tab-style layout often doesn’t seem to produce the desired result – the application felt as if it jumped around from module to module in an unexpected way. With time I began to understand the logic behind the UI and became more comfortable with it.
But, it would be nice to see the UI get the great treatment that ManageEngine recently gave to their updated OpManager console. (You can read our review of the updated version here.)
But those are small complaints on a great tool overall. The NetFlow Analyzer does a great job of monitoring the network and helping to present that information in an understandable, useful manner. If you’re still struggling to understand what traffic is flowing over your network, then we recommend downloading the free 30-day trial of the NetFlow Analyzer, or checking out the Live Demo.
You might be surprised to find out what users are really doing on your network!
Product: ManageEngine NetFlow Analyzer
Review Date:
Rating: 4 
![]()
Pros:
- Extensive Visualization Tools: Offers a wide array of charts and graphs for clear traffic analysis
- Custom Group Reporting: Enables logical device grouping for detailed traffic reports and capacity planning
- Exportable Reports: Supports exporting reports to PDF, CSV, and email for easy data sharing
- Real-Time Alerts: Provides timely alerts for traffic anomalies and threshold breaches
- Affordable Pricing: Starts at $595 for monitoring 10 network interfaces, suitable for medium businesses
Cons:
- Complex UI: User interface can be non-intuitive and requires time to get used to
- Separate Report Scheduling: Scheduling reports requires setting them up from scratch, which could be more integrated
ManageEngine NetFlow Analyzer FAQs
What are the main benefits of using ManageEngine NetFlow Analyzer for network monitoring and analysis?
The main benefits of using ManageEngine NetFlow Analyzer for network monitoring and analysis include increased visibility into network traffic patterns, improved troubleshooting and problem resolution, and better capacity planning for network resources.
What types of reports and dashboards are available in ManageEngine NetFlow Analyzer?
ManageEngine NetFlow Analyzer offers a wide range of pre-built reports and dashboards, including top talkers and applications, flow analysis, and security reports. Custom reports can also be created based on specific business requirements.
How easy is it to set up and configure ManageEngine NetFlow Analyzer?
ManageEngine NetFlow Analyzer is relatively easy to set up and configure, with a user-friendly interface and comprehensive documentation. The software can be deployed on-premises or in the cloud, depending on the organization's needs.
How does ManageEngine NetFlow Analyzer handle multi-vendor network environments?
ManageEngine NetFlow Analyzer is vendor-agnostic, meaning it can collect and analyze data from a wide range of network devices and vendors. This makes it an ideal solution for organizations with diverse network environments.
What types of network performance issues can be identified and addressed using ManageEngine NetFlow Analyzer?
ManageEngine NetFlow Analyzer can help organizations identify and address a wide range of network performance issues, such as network congestion, bottlenecks, and application performance degradation. By providing visibility into network traffic patterns, the software helps IT teams optimize network performance and improve the end-user experience.