MongoDB is an open-source and cross-platform database that uses JSON-like schema for storing records. It has been a popular choice among developers because of its flexibility and scalability with queuing and indexing data.
This document-driven NoSQL database is also a preferred choice for high-volume data. It uses collections and documents instead of tables and rows standard in relational databases. The key-value pairs of documents are the primary storage unit in these databases, while collections are sets of papers and functions.
The good news is that many third-party tools can monitor this database for you.
Here is our list of the best MongoDB Monitoring tools:
- ManageEngine Applications Manager – FREE TRIAL Track performance statistics on your MongoDB systems with this monitoring package for software, services, middleware, server resources, and cloud platforms. Runs on Windows Server, Linux, AWS, and Azure. Start a 30-day free trial.
- Site24x7 MongoDB Monitoring – FREE TRIAL Monitors the performance of MongoDB databases with its advanced plugin integration to give in-depth visibility into related metrics. Start 30-day free trial.
- ManageEngine OpManager Nexus – FREE TRIAL A comprehensive monitoring solution that can track the health and performance of your MongoDB databases. Download a 30-day free trial.
- Datadog A robust monitoring system that collects and aggregates the critical metrics of MongoDB extensively to give you a precise understanding of its health and performance.
- Foglight Proactively monitors the performance of your MongoDB databases while providing in-depth insights into the entire architecture.
- OpsView Provides unified database monitoring both on-prem and in the cloud and gives a comprehensive understanding of your entire database infrastructure.
- MongoDB Compass Analyzes your documents and displays them through a rich structure.
- SolarWinds Database Performance Monitor This SaaS-based tool is a popular choice for monitoring and optimizing MongoDB databases. It comes with advanced features and a web interface that can be accessed from anywhere.
Join us as we do a deep dive into the capabilities of each of these tools further down.
Why Should You Monitor MongoDB?
Since databases, in general, are a critical resource for organizations, their health and performance must continually be monitored. Specifically, MongoDB monitoring enables you to,
- Understand the current capacity of your database and plan for the future based on your business needs
- Optimize the utilization of resources to get the best ROI
- Look for abnormal behavior that can be identified and fixed at the earliest before it impacts your end-users
- Detects problems in your tech stack
- Comply with existing standards and industry practices
- Beef up your overall security
Now that you know why you should monitor your MongoDB database, the next question is what aspects you must consider.
The five aspects that must be monitored are:
- Replication metrics
- Instance status and health
- Cluster operations
- Connection metrics
- Instance hardware metrics
And finally, comes the big question – how do you monitor these aspects of a MongoDB database?
The Best MongoDB Monitoring Tools
1. ManageEngine Applications Manager – FREE TRIAL
ManageEngine Applications Manager provides middleware monitoring services, which include database performance tracking. This tool can track activities on MongoDB as well as other NoSQL database systems. The tool can also monitor relational databases. In fact, it can monitor many different DBMS instances simultaneously.
Features
- The major features of Applications Manager are:
- Monitoring of multiple instances
- CPU, memory, and network interface activity tracking
- Disk interaction tracking
- Alerts for emerging resource shortages
- Notice for performance issues, such as slow-running queries
- Statistics on administration actions, such as asserts and replication
- Recording of throughput capacity and timings
- Simultaneous tracking of server performance
- Applications dependency mapping that identifies which other systems access the MongoDB service
Why do we recommend it?
ManageEngine Applications Manager provides performance tracking for many applications, not just databases. It can monitor databases that are hosted on the cloud as well as those on your own servers. The MongoDB monitoring tool watches performance metrics, resource usage, throughput, and replication events. It provides query tuning and database object optimization recommendations.
Who is it recommended for?
This package offers good value for money because it can monitor many applications as well as MongoDB. The package will run on Windows Server and Linux and you can also get it as a service on AWS and Azure. There is a Free edition that is limited to monitoring five assets.
Pros:
- Supports a freeware version
- Uses both SNMP and NetFlow for monitoring giving it more coverage options than other tools
- Can scale easily, Enterprise package supports up to 10,000 endpoints
- Utilizes automatic network discovery to create live inventories and network maps for administrators to track assets and network size
- Viable for both large and small networks
Cons:
- OpManager is dense with features, integrations, and settings, and may take time to fully learn
Pricing: ManageEngine provides three editions of Applications Manager:
- Free (to monitor five assets)
- Professional – from $395 per year
- Enterprise – from $9,595 per year
Download: Click here to download a 30-day free trial onto Windows Server or Linux. That page also includes links to the tool in AWS Marketplace and Azure Marketplace.
2. Site24x7 MongoDB Monitoring – FREE TRIAL
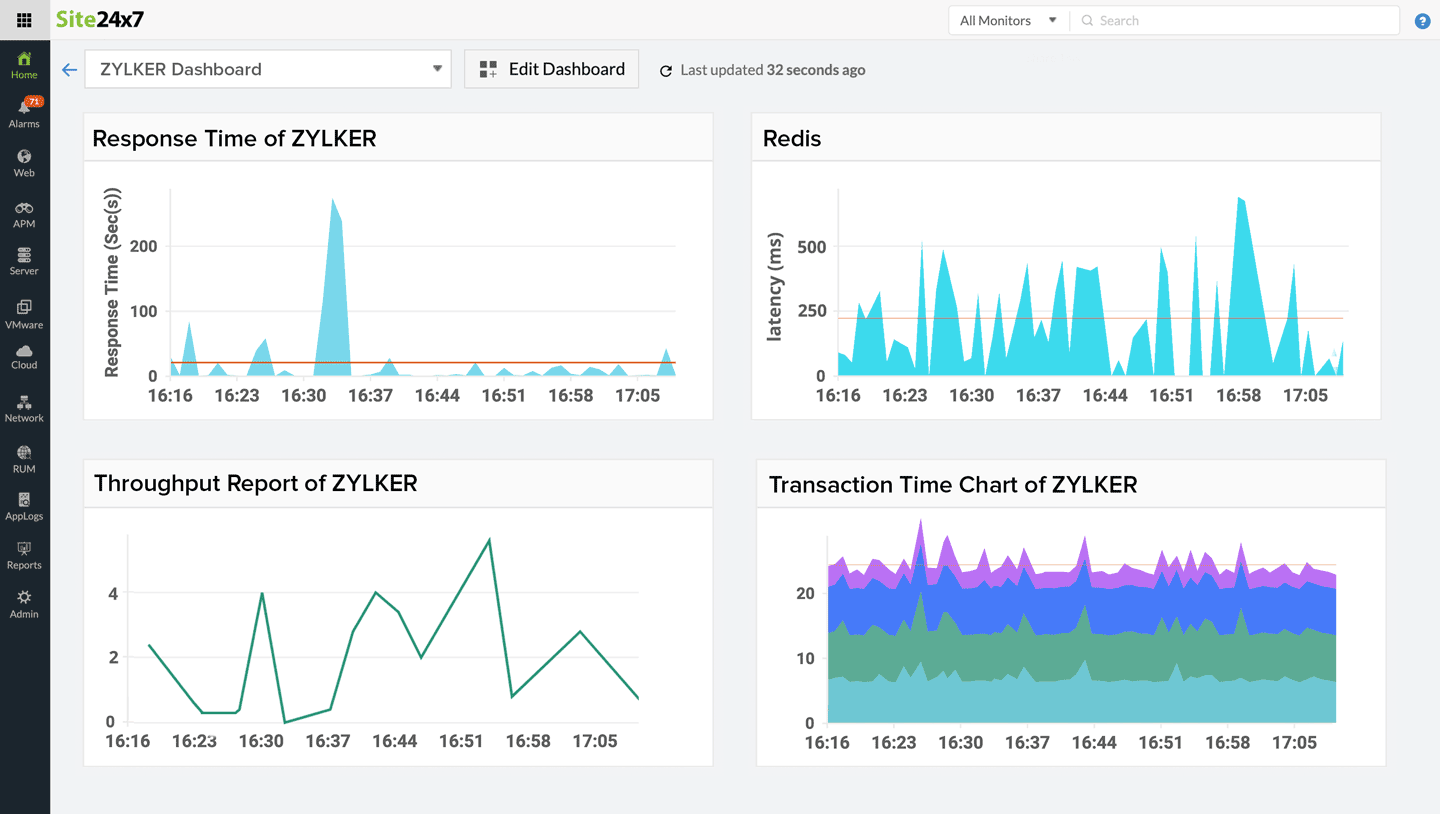
Site24x7 MongoDB Monitoring offers a ready-to-use plugin for monitoring MongoDB databases and their performance. It even provides the necessary insights needed to help resolve issues.
Features
Below are the MongoDB monitoring capabilities of Site24X7.
- Provides in-depth visibility into the right MongoDB metrics needed for optimizing your infrastructure
- Provides information on the available connections, current connections, heap usage, total open cursors, and more
- Pools all the logs in a single interface to give you a complete understanding of the health and performance of MongoDB in the context of the larger environment
- Automates the process of aggregations so that you can configure its frequency
- Easy to use as you simply have to download the plugin and install it
- Generates visually appealing charts for easy understanding
- Checks the status and load times and alerts if these values exceed the established threshold values
- Monitors the performance of individual queries to understand which ones are more efficient
- Generates reports needed for compliance
Why do we recommend it?
Site24x7 MongoDB Monitoring is part of a cloud platform of monitoring modules that cover networks, servers, cloud platforms, services, applications, and Web assets. The system’s MongoDB monitoring service is a plug-in. Each plan allows one plug-in in the price and if you want to use more, you have to pay a supplement.
Who is it recommended for?
The Site24x7 plans are priced and sized to suit small businesses. Larger businesses pay expansion fees for more capacity. You can monitor MongoDB with any plan but if you want to monitor other applications, you will have to pay extra for more plug-ins. There is also a plug-in for MongoDB Atlas.
Pros:
- One of the most holistic monitoring tools available, supporting networks, infrastructure, and real user monitoring in a single platform
- Uses real-time data to discover devices and build charts, network maps, and inventory reports
- Is one of the most user-friendly network monitoring tools available
- User monitoring can help bridge the gap between technical issues, user behavior, and business metrics
- Supports a freeware version for testing
Cons:
- Is a very detailed platform that will require time to fully learn all of its features and options
Pricing: Site24X7 offers four different pricing plans, and they are
- Starter plan priced at $9 per month
- PRO plan that starts at $35 per month
- Classic plan priced at $89 per month
- Enterprise plan that starts at $225 per month
Download: Click here to start a 30-day free trial.
3. ManageEngine OpManager Nexus – FREE TRIAL

ManageEngine OpManager Nexus, formerly OpManager Plus, comes with extensive database monitoring capabilities to stay on top of your MongoDB’s performance. It gathers and analyzes the key metrics related to database performance and displays the insights on dashboards for easy understanding.
Key Features:
- Tracks key metrics, like CPU, memory, and I/O, to better understand resource utilization, so you can plan accordingly.
- Correlates events to identify the root cause of issues.
- Pinpoints the source of slow query performance.
- Offers event-driven workflows that can automatically remediate key issues.
- Uses ML-based algorithms to support decision-making.
- Generates scheduled and on-demand reports that can be shared with stakeholders.
- Provides information about storage to avoid errors and help with capacity planning.
- Detects anomalies using adaptive baselines.
Why do we recommend it?
OpManager Nexus is known for its comprehensive approach to database monitoring. It gathers data related to resource usage, cache efficiency, query performance, storage rates, and sessions, and correlates them to provide detailed insights into potential issues. With this data, you can avoid common database problems and improve its overall efficiency and performance.
Who is it recommended for?
It is a good choice for MongoDB database owners, administrators, and developers who are responsible for maintaining its security and performance.
Pros:
- Enables you to send dynamic baseline values that reflect real-world conditions.
- Visualizes the KPIs on dashboards.
- Drills down the metrics to pinpoint the root cause.
- Sends alerts via email, SMS, and Slack.
Cons:
- Some users have reported a learning curve due to its extensive features.
OpManager Nexus costs $1,233 for 50 devices if you go for the Professional edition and $19,995 for 1000 devices under the Enterprise edition. Start a 30-day free trial.
4. Datadog MongoDB Monitoring
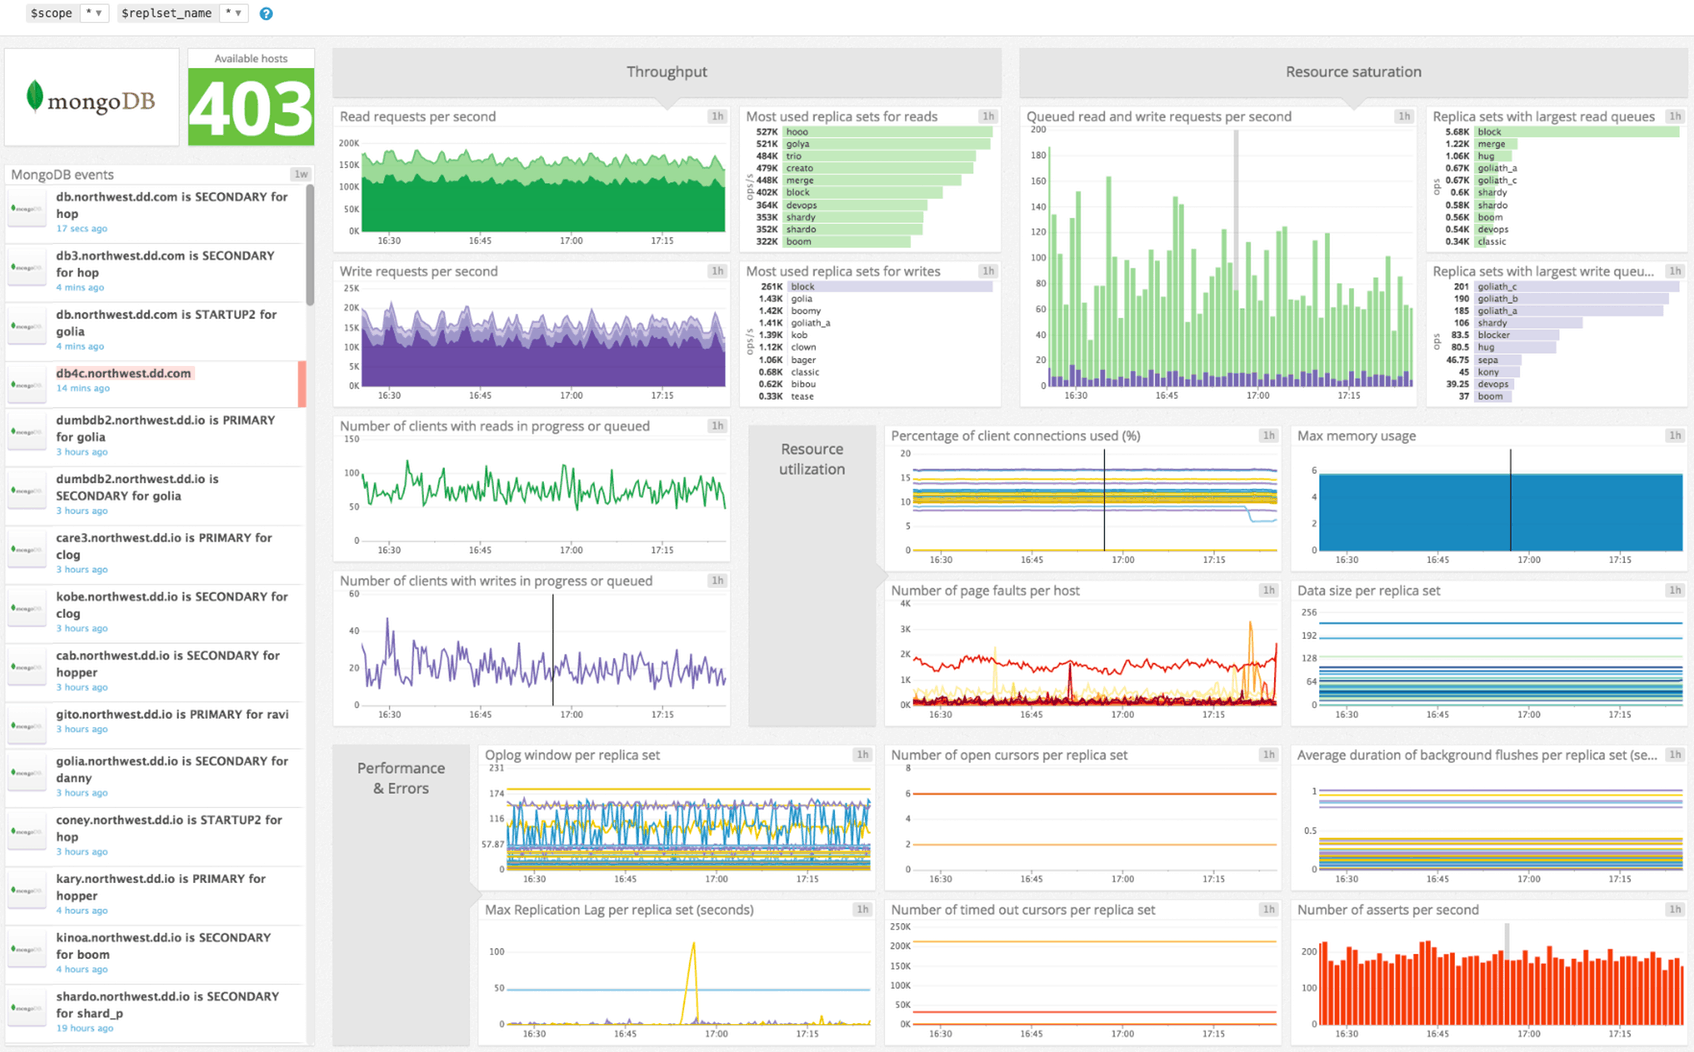
Datadog is a robust monitoring tool that collects and aggregates MongoDB metrics to give you a comprehensive understanding of the performance of MongoDB databases. It even comes with extensive alerting mechanisms to update you as needed.
Features
Here are the features of Datadog related to MongoDB monitoring.
- Monitors a wide range of metrics to give you a precise idea
- Visualizes MongoDB metrics with other metrics collected within your infrastructure
- Comes with advanced alerting mechanisms to inform you at the earliest when things go down south
- Easy to set up and use
- Allows you to create your metrics using the find, count, and aggregate queries
- The installation can be customized according to the deployment cluster of your MongoDB
- Collects traces across the entire distributed environment to give you a high-level overview of performance
- Generates detailed reports that can help with decision making
- Integrates with communication tools such as Slack and PagerDuty
Why do we recommend it?
Datadog MongoDB Monitoring is a cloud-based system but it can monitor the performance of MongoDB databases on your servers or on other cloud platforms. On-premises instances can be running on Windows, Linux, or macOS. As well as tracking performance metrics for database activity, the tool is able to assess the success of links to other applications. Comparing the two assessments can provide root cause analysis.
Who is it recommended for?
The Datadog MongoDB Monitoring system is a plug-in, known as an integration, for the Datadog Infrastructure Monitoring package. There is a Free edition of the Infrastructure Monitoring system but that doesn’t provide access to the integrations library. There are more than 650 integrations available and, unlike Site24x7, Datadog doesn’t charge extra for them.
Pros:
- Offers numerous real user monitors via templates and widgets
- Can monitor both internally and externally giving network admins a holistic view of network performance and accessibility
- Changes made to the network are reflected in near real-time
- Allows businesses to scale their monitoring efforts reliably through flexible pricing options
Cons:
- Would like to see a longer trial period for testing
Datadog offers a ton of pricing options, depending on what you want to monitor.
- Infrastructure monitoring comes in three plans, namely, Free, Pro ($15/host/month), and Enterprise ($23/host/month)
- Log Management – Ingest ($0.10/scanned or ingested GB) and Retain or Rehydrate ($1.70/million log events/month)
- APM and Continuous Profiler – APM ($31/host/month) and APM & Continuous Profiler ($40/host/month)
- Real-user monitoring – $15/10k sessions/month
- Incident management – $20/user/month
- Security monitoring – #0.20/GB of analyzed logs
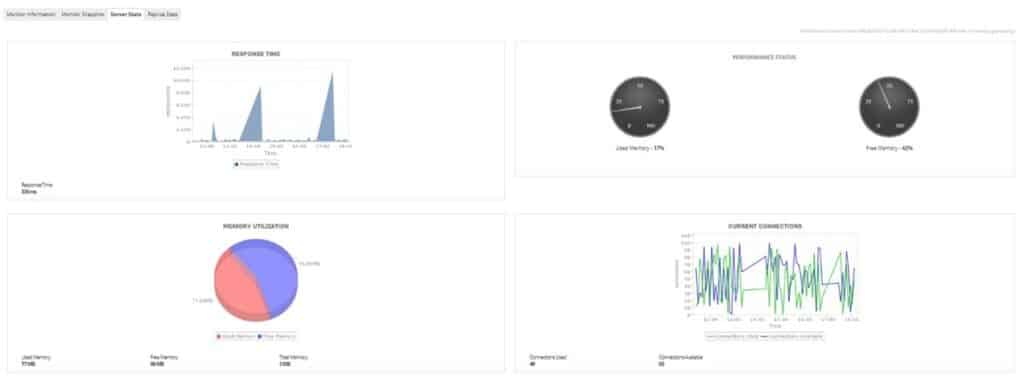
5. Foglight MongoDB Monitoring
Foglight is a tool designed to ensure the health of your MongoDB infrastructure and, at the same time, provide deep insights into its infrastructure.
Features
The following are the salient features of Foglight for MongoDB.
- Provides a quick view of the critical parameters
- Tracks the number of current connections and the associated memory requirements. Sends alerts when the number of contacts exceeds the established threshold
- Generates reports detailing a host of factors ‘
- Provides information on memory utilization, including allocated and resident memory. Sends alerts when the memory is insufficient to carry out the existing operations
- Monitors page faults
- Tracks and analyzes the load on your database, including sharding and replication lag
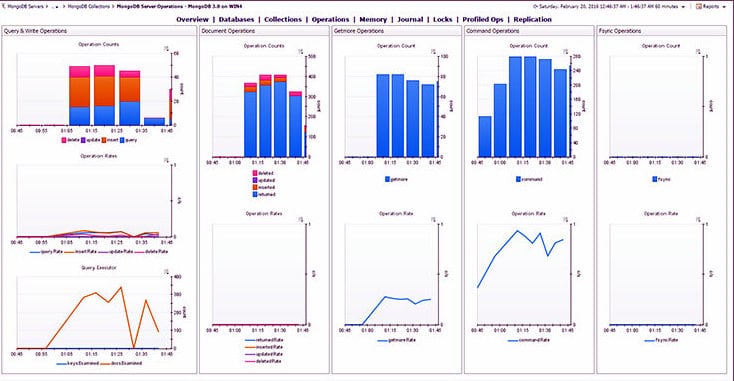
- Monitors profiled operations and allow the flexibility to add your queries in the aggregation process.
- Automatically discovers and monitors MongoDB replication sets
- Monitors multiple metrics related to commits to the journal to ensure the resiliency of MongoDB
- Resolves concurrency issues with lock analysis
- Identifies discrepancies by comparing existing node configurations with the standard ones.
- Uses adaptive Intelliprofile thresholds to reduce false alerts
- Reduces the overhead associated with monitoring
- Stores historical monitoring data in the embedded data warehouses
- Supports both on-prem and cloud installations
Why do we recommend it?
Quest Foglight for Databases is a specialized database performance monitoring system that is able to cover MongoDB and many other DBMSs. Some of the other databases covered by this package are SQL Server, MySQL, PostgreSQL, Oracle, AWS RDS, and Azure SQL. The package provides performance analysis and problem alerting.
Who is it recommended for?
This system is delivered as a software package for Windows, Windows Server, and Linux. The service can monitor cloud platforms remotely from its host on our site. The package has a mid-market price at around $500 per year. That’s probably a bit pricey for cash-strapped small businesses but not a strain for mid-sized and large organizations.
Pros:
- Can monitor cloud and physical host environments
- Uses autodiscovery to find and monitor new VMs as they are created
- Good option for those looking to specifically monitor multiple Citrix environments
Cons:
- Interface feels outdated, can be clunky when managing a large number of VMs
- Reporting is a bit canned, could benefit from more customization options
Pricing: Click here for a custom quote.
Download: Click here for a free trial.
6. OpsView
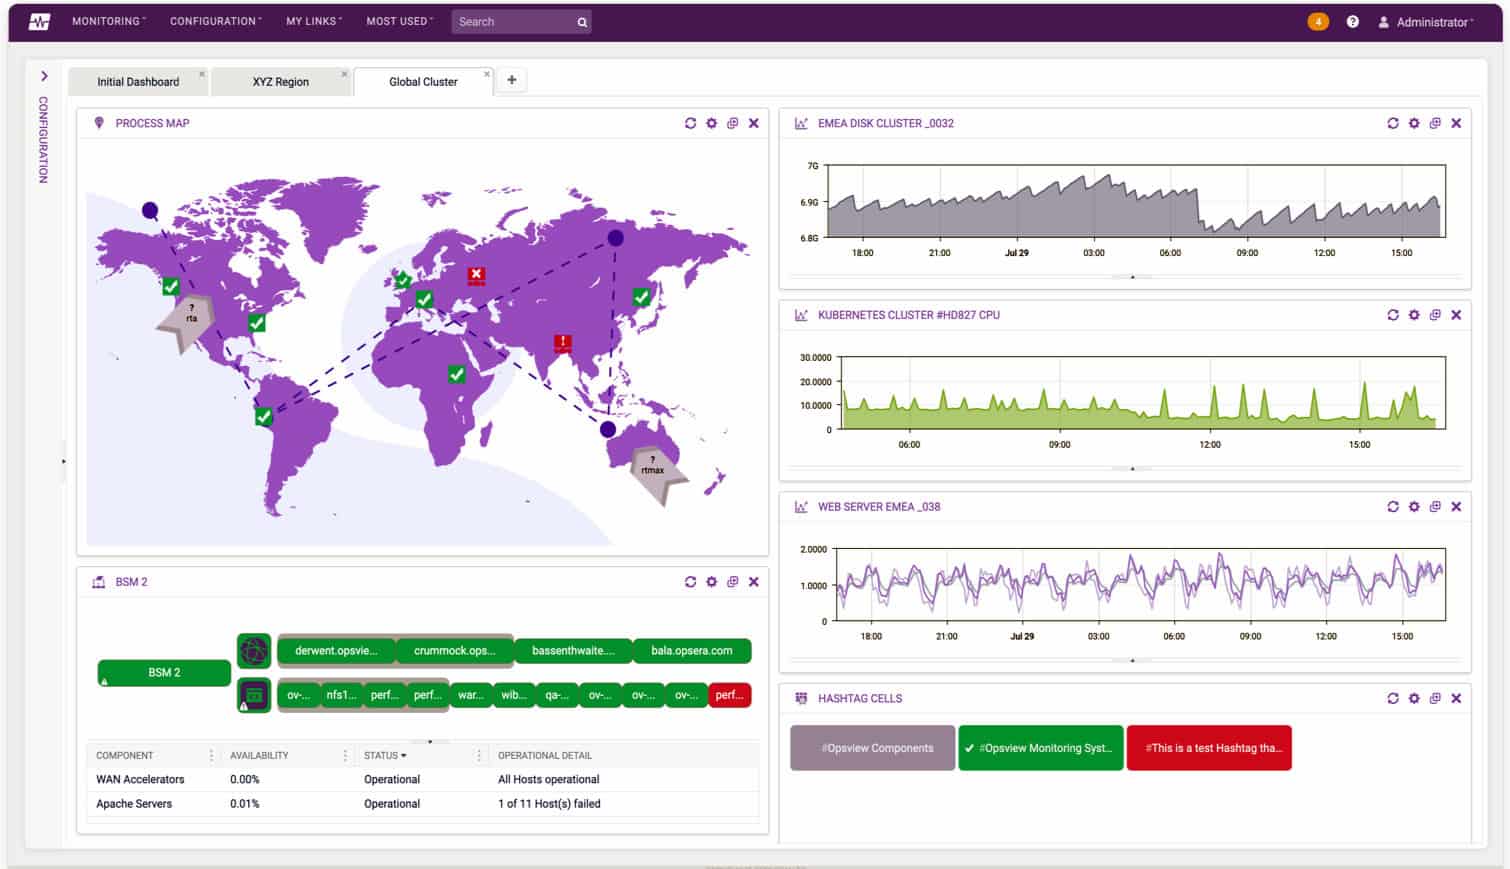
OpsView monitors your on-prem and cloud databases to give you unified and comprehensive visibility into your complete database architecture and infrastructure.
Features
Below are the features of OpsView related to MongoDB monitoring.
- Monitors the CPU information for all your MongoDB instances
- Provides memory statistics including MongoDB_config and arbiter
- Captures all the essential metrics such as page faults, database size, replication state, collection size, and more
- Comes with 29 service checks to ensure the good health of your MongoDB databases
- Sends notifications if the health metrics go outside recommended range
- Monitors databases proactively to avoid transaction failures and prevent data loss
- Ensures the availability of databases by proactively sending information on the metrics
Why do we recommend it?
OpsView is a full stack monitoring package that includes database monitoring. The
Database monitoring capabilities of the package are implemented by plug-ins, which are called opspacks. The MongoDB opspack provides live monitoring with a long list of possible statistics that it can gather – you don’t have to include them all in the dashboard.
Who is it recommended for?
OpsView is available in cloud and on-premises versions. There is also a limited capacity version for SMBs and another edition for managed service providers. The on-premises software package runs on Debian, Ubuntu, CentOS, RHEL, and Oracle Linux and it can monitor cloud systems as well as assets on your site.
Pros:
- Is a comprehensive platform that supports MongoDB monitoring through a plugin
- Clean easy to use interface
- Great native reports and data visualizations
- Supports a free and paid version
Cons:
- Expandable through plugins – not the best option for companies looking for a comprehensive single-tool
OpsView comes in two editions, and they are OpsView Cloud and Enterprise. Click here to get a quote for OpsView Cloud and Enterprise, respectively. There is also an option for SMB that starts at $1,300 yearly for 50 hosts.
7. MongoDB Compass
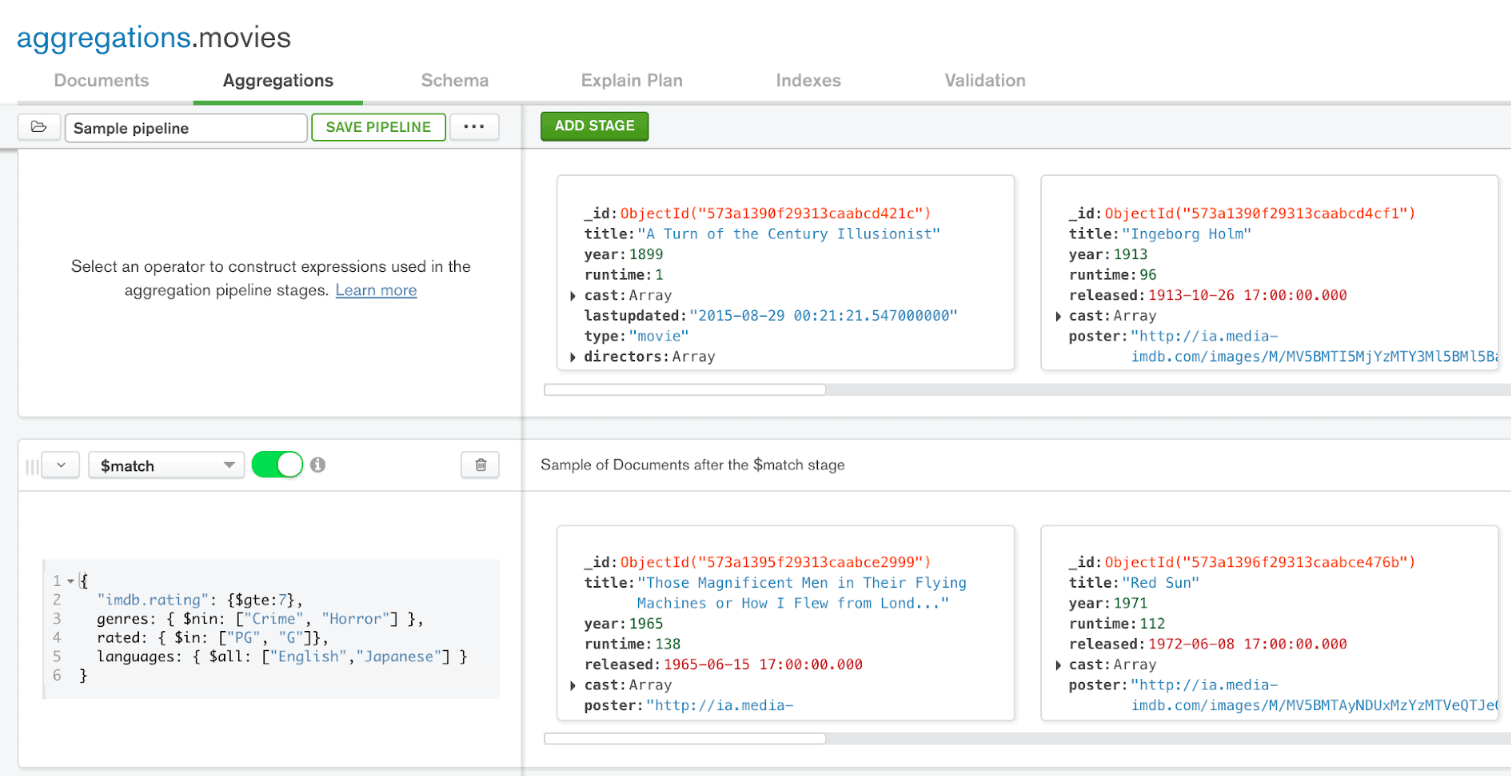
MongoDB Compass is a GUI for a MongoDB database and enables you to explore your data in a structured format visually. It also allows you to interact with the data by running ad hoc queries to monitor the performance of your MongoDB database.
Features
The features of MongoDB Compass are:
- Comes with full CRUD functionality
- Enables you to view and optimize the performance of your queries
- Works well on Linux, Mac, and Windows
- Empowers you to make better decisions related to indexing and validations
- Allows you to run ad hoc queries within a few seconds
- Helps you to visualize the data to understand its structure and relevance better
- Comes with a powerful visual editing tool
- Provides information on resource utilization to help with capacity planning
- Analyzes your documents and displays the rich structures within it
- Provides insights in real-time about the server status
- Enables you to work with geospatial data
- Highly extensible with plugins
Why do we recommend it?
MongoDB Compass is a free tool that provides a console for your MongoDB instances. The system enables you to easily perform administrative tasks and it also provides monitoring and analysis services. This tool enables you to optimize database structure and tune queries for better performance. It can also be used for data analysis.
Who is it recommended for?
This is a DBA tool and most likely, if you are setting up MongoDB databases, you have probably already downloaded it. Developers could also use the interface to see database objects and create efficient queries. MongoDB Compass is free to use and it is available for Windows, macOS, and Linux.
Pros:
- Includes intuitive visual editing
- Can easily compare live metrics
- Includes a visual explainer for simple insights
- Has an intuitive query builder that makes searching simple
Cons:
- Best for environments that only use MongoDB
Click here to download for free.
8. SolarWinds Database Performance Monitor
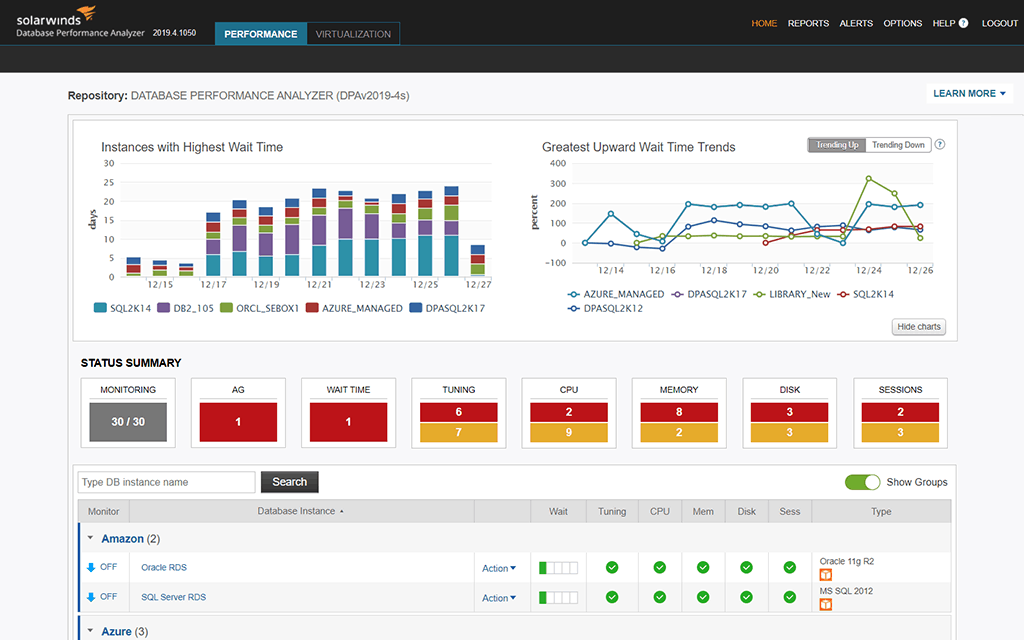
SolarWinds Database Performance Monitor is a database performance monitoring and optimization tool that works well for all databases, including MongoDB. Its advanced features make it a popular choice for developers and database administrators worldwide.
Features
Here’s a look at the reasons for this tool’s popularity.
- Continuously monitors databases to provide insights into their health and performance
- Comes with flexible tools and expert guidance to fill in critical gaps in the monitoring stack
- Its real-time monitoring ensures you stay on top of your business and monitoring goals always
- Quickly detects faults when they are small, so it’s easy to diagnose and fix
- Its patented Adaptive Fault Detection technology is geared to detects faults and fissures before they lead to significant outages
- Provides the flexibility to build custom dashboards, so you can monitor the metrics that matter the most to you
- Makes intelligent recommendations based on your configuration and the industry’s best practices
- Comes with a powerful and customizable alerting system that detects abnormalities and communicates the same to you at the earliest
- It can be installed in four ways – manual, containerized, on-host, and off-host
- Efficiently isolates environment changes after code deployments
- Uses real-time and historical data to point you to the correct database issues
Why do we recommend it?
SolarWinds Database Performance Monitor is an on-premises software package that provides monitoring for MongoDB and also SQL Server, Azure SQL, MySQL, MariaDB, PostgreSQL, and Redis. The tool combines a number of important performance metrics into an analysis profile. These include response times, throughput, and error rates.
Who is it recommended for?
This is a DBA tool that accesses the database’s settings and recommends improvements, It also tracks any issues with admin processes such as backup and replication. The constant performance monitoring provides alerts for problems and is also ready with root cause analysis when things go wrong. It can monitor multiple databases from different DBMSs simultaneously.
Pros:
- Takes a holistic approach to server performance and health monitoring
- Supports auto-discovery that builds network topology maps and inventory lists in real-time based on devices that enter the network
- Supports both SNMP monitoring as well as packet analysis, giving you more control over monitoring than similar tools
- Uses drag and drop widgets to customize the look and feel of the dashboard
- Robust reporting system with pre-configured compliance templates
Cons:
- Designed for IT professionals, not the best option for non-technical users
Pricing starts at $1,340. You can test-drive SolarWinds Database Performance Monitor for a fully functional 14-day free trial.
Conclusion
To conclude, MongoDB is a popular database because of its flexibility and scalability. As a result, many developers are looking to leverage its features for building advanced and next-gen applications.
Given the growing importance of MongoDB, it becomes necessary to monitor it continuously as any issues here can have severe repercussions for the applications that run on it. The good news is there are many tools available for monitoring MongoDB databases, and we have listed some of the best ones in this article. We hope it was an exciting read for you.
MongoDB Monitoring Tools FAQs
What is MongoDB monitoring?
MongoDB monitoring refers to the process of tracking and analyzing the performance and health of MongoDB databases, clusters, and related infrastructure.
What types of metrics can be monitored in MongoDB?
MongoDB metrics can include CPU usage, memory usage, disk I/O, network I/O, read/write operations, query latency, and more.
What types of tools can be used for MongoDB monitoring?
There are several tools available for MongoDB monitoring, including open-source solutions like MongoDB Cloud Manager and commercial tools like SolarWinds Database Performance Analyzer.