Databases are an essential asset of every organization. They contain critical data related to business operations, including the details of customers, employees, sales and marketing-related data, financial information, and more.
If these databases crash or malfunction, it can impact the performance of all organization-critical applications that depend on them. Also, there’s a possibility for permanent data loss, depending on the backup plan in the organization. Further, databases tend to be so big that it can get challenging to identify bugs and fix them. Finally, poor database management practices can make it an easy target for hackers.
Here is our list of the best database monitoring tools:
- ManageEngine Applications Manager – EDITOR’S CHOICE Provides deep visibility into the health and performance of databases so that you can finetune them for greater efficiency. Get a 30-day free trial.
- Paessler PRTG Network Monitor – FREE TRIAL A sensor-based tool that can monitor specific aspects of your database to give the insights you need. Access a 30-day free trial.
- Site24x7 Database Monitoring – FREE TRIAL Comes with many out-of-the-box features that ensure the high availability of your databases and their optimal performance. Get a 30-day free trial.
- ManageEngine OpManager Nexus – FREE TRIAL A full-stack observability tool that monitors all the databases in your network, including relational, in-memory, cloud, NoSQL, and more. Start a 30-day free trial.
- Idera Provides complete control and visibility into the health and performance of your database.
- SolarWinds Database Performance Analyzer This system tool monitors SQL query performance and provides the necessary insights for fine-tuning them. It supports cross-platform tuning as well.
- Datadog Database Monitoring Proactively tracks the health and performance of your databases to reduce downtime and troubleshoot any problems that may come up.
- SQL Power Tools A lightweight and straightforward tool that gives detailed insights into the performance of your SQL databases.
- dbWatch Monitors and manages your entire database farm as well as individual instances.
Given all these aspects, staying on top of the health and performance of databases is critical. Unfortunately, it may not be possible to manually monitor every database table, which is why using database monitoring tools can be necessary for the company.
The Best Database Monitoring Tools
Our methodology for selecting database monitoring tools and software
We reviewed various database monitoring tools and analyzed the options based on the following criteria:
- Support for various database types and environments
- Ability to automate and schedule continuous monitoring
- Integration support
- Reporting and alert capabilities
- Graphical interpretation of data, such as charts and graphs
- A free trial period, a demo, or a money-back guarantee for no-risk assessment
- A good price that reflects value for money when compared to the functions offered
1. ManageEngine Applications Manager – FREE TRIAL
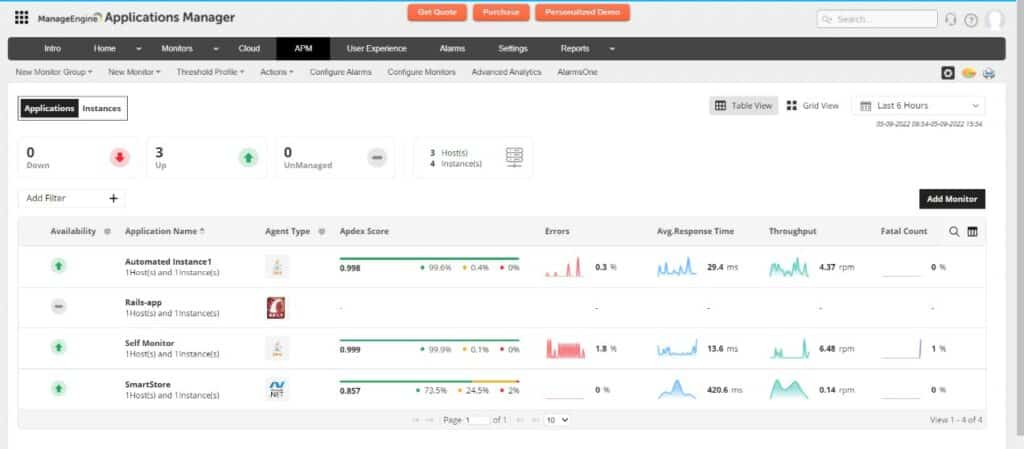
ManageEngine Applications Manager is an advanced database monitoring tool that ensures the optimal performance of your databases and generates notifications in case of issues.
Key Features:
The features of Applications Manager are:
- Automatically discovers, categorizes, and monitors your RDBMS
- Collects in-depth metrics for comprehensive monitoring
- Troubleshoots quickly with code-level insights
- Provides intelligent analytics to make informed decisions
- Offers deep visibility into essential metrics such as CPU utilization, connection statistics, query performance, buffer cache details, user sessions, resource pools, deadlock users, and system and user errors
- Drills down to SQL statements to monitor database calls
- Analyzes error traces and resolves database performance issues before they impact the end-users
- Provides detailed performance metrics to identify slow database calls
- Measures and tracks database utilization
- Generates customizable reports that can be exported in PDF or CSV formats
- Supports most popular databases
Why do we recommend it?
ManageEngine Applications Manager is a general monitoring tool for many types of applications and the servers that host them. Databases are among the applications that this system can monitor. Its capabilities include SQL-based relational databases, NoSQL databases, and big data systems. The package will discover all applications and create an application dependency map for root cause analysis.
Who is it recommended for?
This is a large system that can track the performance of Web applications as well as traditional server-based systems, so it is useful for a wide range of system monitoring needs. It will identify the applications that access your databases and the server resources that support those systems and your databases.
Pros:
- Offers on-premise and cloud deployment options, giving companies more choices for install
- Can highlight interdependencies between applications to map out how performance issues can impact businesses operations
- Offers log monitoring to track metrics like memory usage, disk IO, and cache status, providing a holistic view into your database health
- Can automatically detect databases, server hardware, and devices for real-time asset management
Cons:
- Can take time to fully explore all features and options available
Start a 30-day free trial.
EDITOR'S CHOICE
ManageEngine Applications Manager is our top pick for a database monitoring tool because this package is able to monitor a wide range of database types, not just relational databases. The RDBMSs that it can track include SQL Server, MySQL, PostgreSQL, and Oracle. There are many more. The package will monitor NoSQL systems, such as MongoDB and Cassandra, the Memcached in-memory data system, and bog data services, such as Hadoop and Spark. The tool focuses on database statuses and environment performance rather than offering query optimization services. Database performance is considered in the context of all of the applications with which each instance interacts. It also tracks the physical server resources on which the database relies. The service scans your servers and discovers all fo the software there. The tool also looks at which other packages and functions each running application calls. This creates an application dependency map, which the tool uses to create predictive alerts for resource shortages.
Download: Get a 30-day free trial
Official Site: https://www.manageengine.com/products/applications_manager/download.html
OS: Windows Server, Linux, AWS, and Azure
2. Paessler PRTG Network Monitor – FREE TRIAL
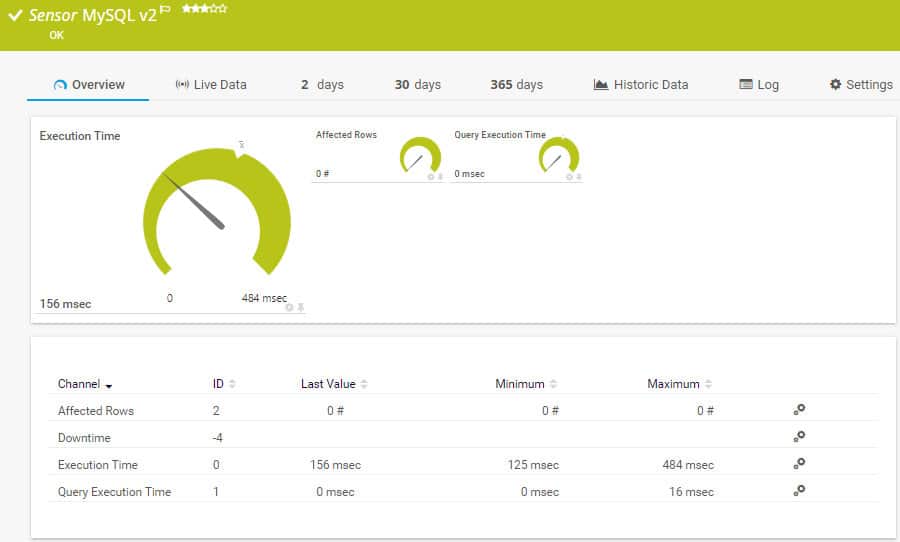
Paessler PRTG Network Monitor ensures the health of your database and points out the database queries that are not processed in time, thereby helping you point in the right direction.
Key Features:
The features of PRTG related to database monitoring are:
- Sends alerts if the database query returns unpredictable results
- Comes with built-in native sensors for Microsoft SQL servers, MySQL, PostgreSQL, and Oracle databases
- Monitors databases from a user perspective, where the sensor sends a request to the database server and receives corresponding values
- Can process data tables and display values in individual transactions
- Monitors transactions when needed
- Can also monitor databases with an abstract view by staying on top of performance counters via the Windows Management Instrumentation
- It comes with sensors for monitoring the contents of the database
- Some sensors can execute a query and report the time taken for the execution of the same to give a precise idea of the database’s performance
- You can set the scanning interval
- There are sensors for specific databases like MySQL v2 for MySQL databases and PostgreSQL v2 sensor for PostgreSQL databases. Alternatively, you can use ADO SQL v2 sensor for scanning multiple databases, provided they have an ADO connection
Why do we recommend it?
Paessler PRTG Network Monitoring will discover all devices on your network, create a hardware inventory, and draw up a network topology map. However, the bundle doesn’t just monitor networks. It includes sensors to monitor servers and applications and database monitoring is on the list of its capabilities.
Who is it recommended for?
All system management technicians will be able to use the features in PRTG and the database performance sensors will appeal to your DBA. Use the database monitoring features in conjunction with sensors for server and network monitoring in order to identify the root cause of any application delivery problem.
Pros:
- Uses a combination of packet sniffing, WMI, and SNMP to report network performance as well as discover new devices
- Autodiscovery reflects the latest inventory changes almost instantaneously
- Drag and drop editor makes it easy to build custom views and reports
- Supports a wide range of alert mediums such as SMS, email, and third-party integration
- Supports a freeware version
Cons:
- Is a very comprehensive platform with many features and moving parts that require time to learn
- Custom sensors can sometimes be challenging to manually configure
The cost of this tool depends on the number of sensors you use. Typically, one sensor is used to monitor a single metric on one device. The pricing structure is as follows
- 500 sensors – $1,750
- 1000 sensors – $3,200
- 2500 sensors – $6,500
- 5000 sensors – $11,500
- Unlimited sensors – $15,500
You can use the first 100 sensors for free. You can also start a 30-day free trial to figure out your network requirements.
3. Site24x7 Database Monitoring – FREE TRIAL
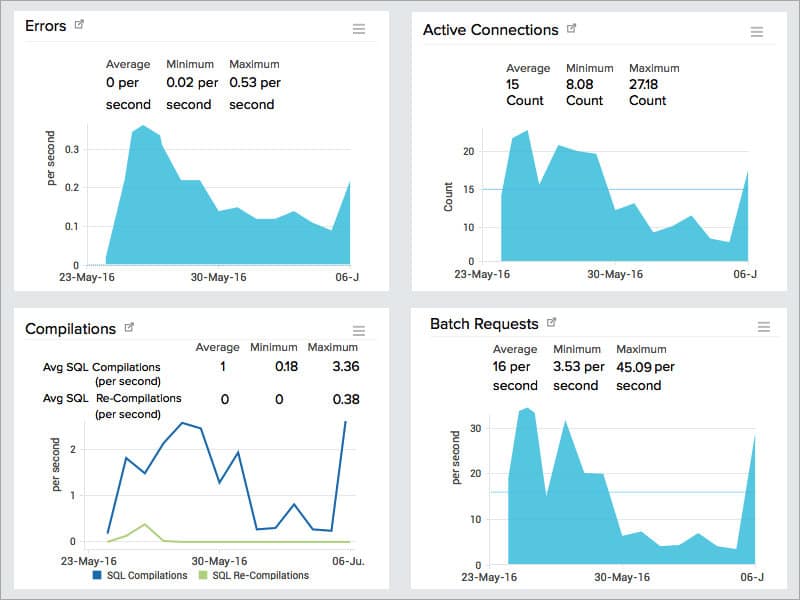
Site24x7 is an advanced tool that ensures the high availability of databases and, at the same time, mitigates server sprawl and delivers optimal database performance. It also sends notifications on failovers.
Key Features:
The features of Site24X7 are:
- Provides memory and buffer manager details for optimal capacity planning
- Drill down the performance details to give you a granular understanding of the database’s performance
- Captures the database attributes like log file size, cache hit ratio, and more
- Assists the DevOps team to focus on essential aspects of database performance
- Monitors the status, availability, and health of different databases
- Analyzes slow and inefficient SQL queries
- Allows you to sort through the log files to find the information you want
- Sends notifications on failover between active and passive nodes
- Displays all metrics in a single dashboard
Allows you to create your custom dashboard
Why do we recommend it?
Site24x7 Database Monitoring is part of a cloud-based SaaS package of system monitoring tools. Database monitoring services cover the management mechanisms of the DBMS as well as live activity tracking. The tool can analyze queries to identify inefficiencies and support the redesign of objects to improve performance.
Who is it recommended for?
The database monitoring feature in Site24x7 is implemented through the selection of an appropriate “integration” for a specific DBMS. This adds on extra screens to the dashboard and specializes in a specific DBMS. There are integrations for the most widely-used systems, including SQL Server, MySQL, PostgreSQL, and Oracle.
Pros:
- Flexible cloud-based monitoring option
- Offers a host of out-of-box monitoring options and dashboard templates
- Allows administrators to view dependencies within the application stack, good for building SLAs and optimizing uptime
- Offers root cause analysis enhanced by AI to fix technical issues faster
Cons:
- Site24x7 is a feature-rich platform with option that extended beyond databases management, may require time to learn all options and features
Site24X7 offers a starter plan that costs $9 per month. After that, you can add as many features and add-ons as needed to build what you want. Start a 30-day free trial.
4. ManageEngine OpManager Nexus – FREE TRIAL

ManageEngine OpManager Nexus, formerly OpManager Plus, can monitor all kinds of databases at scale. It tracks the health and performance of NoSQL, relational, in-memory, and cloud databases, and displays the findings on well-designed dashboards to facilitate better understanding.
Key Features:
The key features of OpManager Nexus are:
- Tracks key metrics related to CPU, memory, and I/O.
- Analyzes cache efficiency and locks to isolate the cause of performance degradation.
- Identifies the root cause of slow query performance.
- No scripts are needed to monitor legacy databases.
- Offers unified views of all dashboards through a single console.
- Visualizes the analyzed data on dashboards.
- Generates reports for compliance and stakeholder communication.
- Enables you to set static and dynamic thresholds for accurate alerts.
Why do we recommend it?
OpManager Nexus works well for environments that have thousands of databases from a single or multiple vendors. Since it can monitor almost any kind of database, it offers a unique advantage for distributed environments and applications. The metrics from all these databases are correlated and displayed on a unified console to help you understand the state of your database performance. If required, you can drill down into the specific metrics for a deeper understanding of the root cause of issues.
Who is it recommended for?
It is recommended for organizations with thousands of databases across multiple geographic locations. It also works well for database administrators and developers who are responsible for maintaining the optimal performance of databases.
Pros:
- Uses adaptive baselines to detect anomalies.
- Sends alerts through multiple channels.
- Highly scalable and can cover almost any database.
- Supports workflows to automatically trigger event-driven actions.
Cons:
- Technical help may be required for the initial setup.
OpManager Nexus starts at $1,233 for 50 devices and $19,995 for 1000 devices. Start a 30-day free trial.
5. Idera
Idera provides advanced database monitoring to help secure and improve the performance of databases, besides looking out for pitfalls and downtimes.
Key Features:
Below are the notable features of Idera.
- Supports most cloud and on-prem databases
- Comes with a scalable user interface to support high-resolution monitors
- Enhances the usability of job chain schedule
- Makes it easy to run automated policies every day repetitively
- Manually rebuild and refragments the problem hotspots
- Runs policies using different analysis types
- Offers enterprise-scale monitoring for business-critical applications
- Improves data quality for reliable decision making
- Prevents security breaches with strong access policies
- Ensures regulatory compliance with extensive auditing
Why do we recommend it?
The Idera platform provides tools for database management and you choose a unit that relates to the DBMS that you need to manage. For example, the company offers Idera Diagnostic Manager for SQL Server and another for MySQL/MariaDB. These systems will monitor databases on premises and on the cloud.
Who is it recommended for?
The Idera platform mainly provides tools for use by DBAs. However, its systems also assist programmers and database designers. So, DevOps teams that deploy databases would particularly benefit from an Idera package. DBA tools include automated system monitoring, performance tuning, and resource planning features. The software runs on Windows Server.
Pros:
- Simple, but powerful interface – great for new users
- Auto formatting and syntax color makes helps DBAs stay organized when at scale
- Offers numerous presets and recommendations to improve performance out of the box
- Supports collaboration with real-time feedback and team features
Cons:
- The trial could be longer
Idera’s database monitoring comes in two editions, and they are:
- SQL Diagnostic Manager for SQL Server – $997.60 per instance
- SQL Doctor – $500 per user.
Register for the 14-day free trial.
6. SolarWinds Database Performance Analyzer
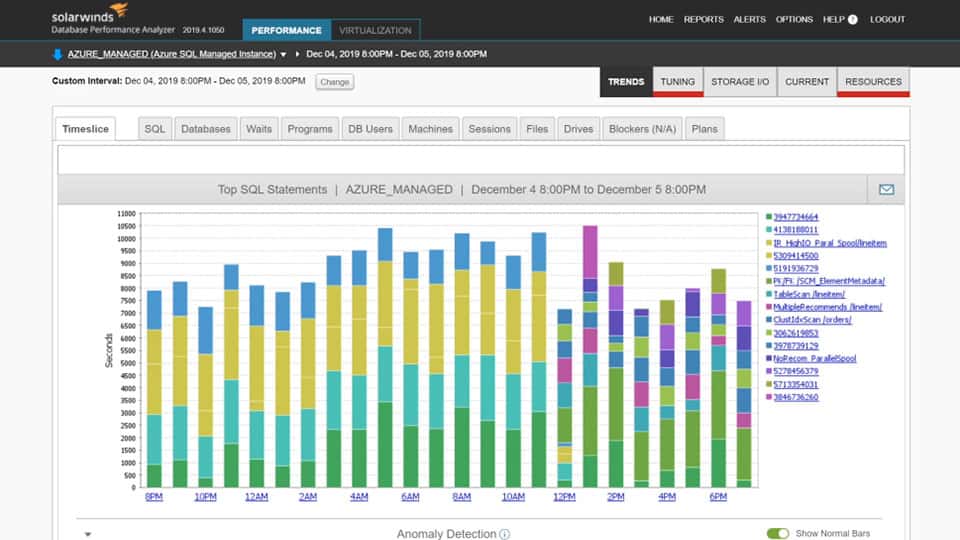
SolarWinds is one of the leading companies for monitoring, and the Database Performance Analyzer sure meets the high standards laid down by this company. It continuously monitors the performance of SQL queries, analyzes them, and fine-tunes them for performance accordingly.
Key Features:
The salient features of SolarWinds DPA are:
- Supports cross platforms databases on both cloud and on-premises
- Uses machine learning to detect anomalies
- Provides advanced suggestions on query tuning and indexing
- Monitors the performance of VMware vSphere
- Provides real-time and historical data, second by second
- Integrates with the SolarWinds Orion Platform
- Monitors Oracle databases, databases on Amazon AWS EC2, RDS, MySQL, DB2, Azure SQL, Sybase, and more
- Detects performance across platforms to give you complete visibility
- It helps you understand database performance issues
- Leverage database DevOps to resolve them
- Provides suggestions for database optimization and performance
- Generates extensive reports
- Reduces SQL server deadlocks
- Checks and reports index fragmentation slowdowns
- Optimizes memory usage
Why do we recommend it?
SolarWinds Database Performance Analyzer gives you monitoring and management capabilities to look after databases running SQL Server, MySQL, PostgreSQL, Oracle, and other DBMSs. It can track activity in databases on your servers or on cloud platforms. The system can analyze the queries that run on the database, optimize them, and recommend database structure improvements.
Who is it recommended for?
This package would be used by a company that is heavily reliant on its databases. This is because it doesn’t offer the ability to track any other assets, whereas many other system-wide monitoring packages include database monitoring capabilities. The software for this tool runs on Windows Server.
Pros:
- Takes a holistic approach to server performance and health monitoring
- Supports auto-discovery that builds network topology maps and inventory lists in real-time based on devices that enter the network
- Supports both SNMP monitoring as well as packet analysis, giving you more control over monitoring than similar tools
- Uses drag and drop widgets to customize the look and feel of the dashboard
- Robust reporting system with pre-configured compliance templates
Cons:
- Designed for IT professionals, not the best option for non-technical users
SolarWinds DPA starts at $1,170. Both subscription and perpetual licensing options are available at https://www.solarwinds.com/database-performance-analyzer-sql-server/registration
7. Datadog Database Monitoring
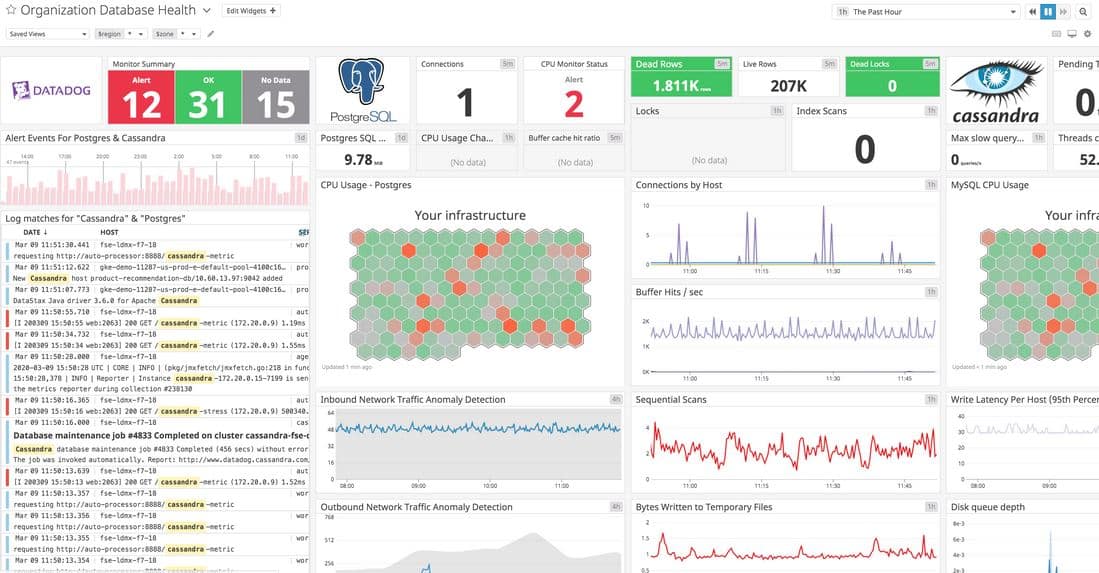
Datadog database monitoring capabilities are extensive as it proactively monitors the health and performance of all databases in your infrastructure. It collects data across these databases, analyzes their performance, and sends alerts when needed.
Key Features:
The features of Datadog database monitoring are:
- Monitors key database metrics such as throughput, execution performance, connections, buffer pool usage, and more in real-time
- Identifies issues like slow queries, error rates, application tracking, and complete latency breakdowns
- Automatically detects log patterns to identify database-related issues
- Provides critical visibility into application dependencies in real-time
- Traces application requests to identify code-level bottlenecks
- Offers out-of-the-box monitoring dashboards and templates that can be customized with a drag-and-drop editor
- Allows you to configure intelligent alerts
- Correlates database performance with the health of applications
Why do we recommend it?
Datadog Database Monitoring is a similar system to the Site24x7 cloud-based service. In this case, you subscribe to the Infrastructure Monitoring package and then activate an integration for your specific DBMS. The list of integrations includes systems to monitor SQL Server, MySQL, SAP HANA, Oracle, and PostgreSQL. This is a SaaS package.
Who is it recommended for?
Some DBMS are more widely used than others and many database monitoring tools focus on just the big names of SQL Server and MySQL. The integrations list for Datadog is very extensive and you are more likely to find one that tracks your database from this platform than any other database monitoring option in this review.
Pros:
- Offers numerous real user monitors via templates and widgets
- Can monitor both internally and externally giving network admins a holistic view of network performance and accessibility
- Changes made to the network are reflected in near real-time
- Allows businesses to scale their monitoring efforts reliably through flexible pricing options
Cons:
- Would like to see a longer trial period for testing
Datadog offers many custom plans, but infrastructure monitoring comes in three plans. They are:
- Free – $0
- Pro – $15/month/host
- Enterprise – $23/month/host
Click here to get started.
8. SQL Power Tools
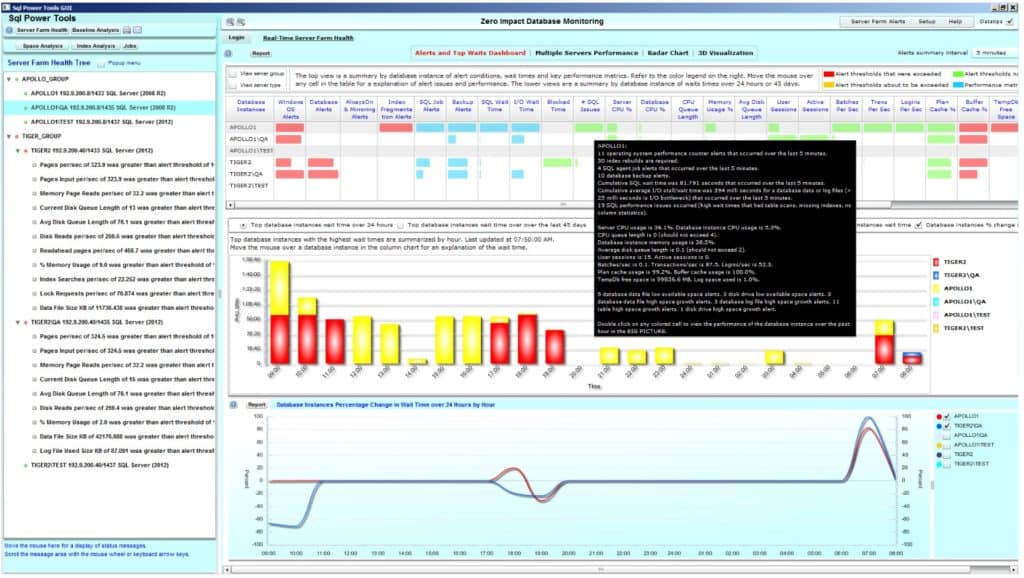
Dubbed as a “zero impact monitoring tool”, SQL Power Tools is simple and lightweight yet packed with powerful features that give a thorough understanding of the SQL database’s performance. This is a suite of tools, where each tool provides a specific functionality such as security, monitoring, etc.
Key Features:
The features of SQL Power Tools are:
- Detects and prevents the theft of confidential data stored in databases
- Informs the DBA of data breaches within milliseconds, so the same can be fixed at the earliest before it impacts end-users
- Complies with GDPR requirements
- Provides advanced SQL behavioral analysis to pinpoint vulnerabilities
- Uses machine learning solutions to send relevant alerts in real-time
- Runs non-intrusively on a network tap or proxy server
- Performs a deep-packet inspection of all the database server network packets
- Does not need to connect to the monitored network or database servers
- Works well for DB2, Informix, MySQL, Oracle, PostgreSQL, SQL Server, and Sybase
- Baselines the performance of every SQL statement provided its unique
- Generates 3D graphs of metrics such as SQL wait times, I/O stall times, performance counters, procedure cache, buffer cache, and disk usage
- Automatically identifies SQL queries having high wait times
- Provides a summary of the results in the form of dashboards and heatmaps
Why do we recommend it?
SQL Power Tools stresses its low-impact monitoring strategies. It samples log files rather than running constant queries within a database, so it won’t overload your database with monitoring processes. It watches over database management issues, such as backup and replication, as well as identifying slow queries and locked resources.
Who is it recommended for?
SQL Power Tools provides monitoring for SQL Server, MySQL, MariaDB, DB2, Informix, Sybase, Oracle, and PostgreSQL databases. Your databases can be running on Windows, Linux, Unix, cloud platforms, or virtualizations. So, this package has a wide audience. The company also offers a database security system that is particularly strong at blocking ransomware attacks.
Pros:
- Was specifically built to be as lightweight as possible, allowing it to manage a large number of SQL servers with little resource consumption
- Offers built-in security auditing and monitoring that leverages behavioral analytics to stop SQL attacks
- Clean user interface takes little time to learn
Cons:
- Doesn’t support other applications beyond SQL
- Must contact sales for pricing
Contact the sales team for a custom quote. Click here for a free trial.
9. dbWatch
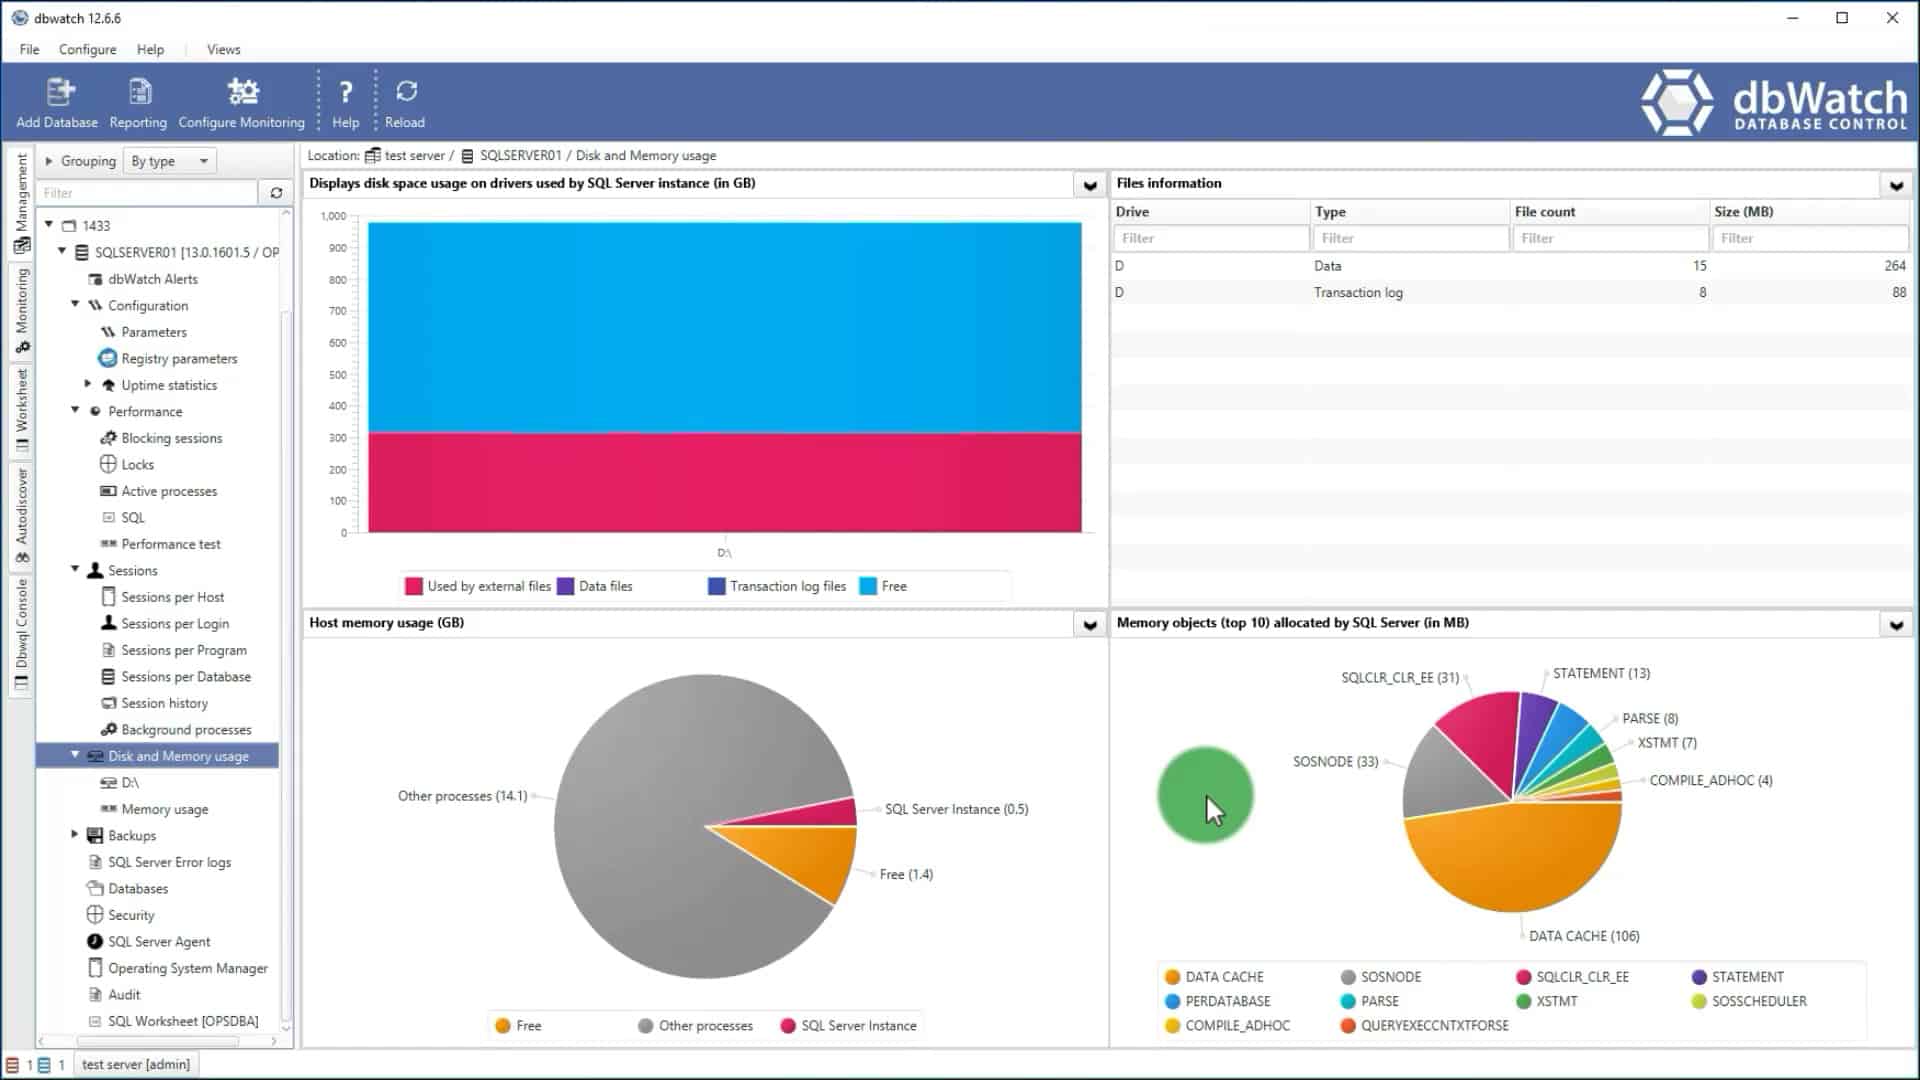
dbWatch is a monitoring tool capable of monitoring both individual instances and entire database farms to give you all the information you need to know the performance of any database at any time.
Key Features:
Below are the features of this tool.
- Monitors all instances in a single global view to give insights across the entire database farm
- Drills down into single instances for deeper analysis and understanding
- Allows you to manage different cases from a single dashboard, so you don’t have to switch between consoles
- Provides a wide variety of reports to suit every need
- Offers full support for AlwaysOn and RAC Clustering
- Supports both on-prem and cloud environments
- Scales well from a handful of instances to large database farms
- Its unique scalable architecture ensures that there’s minimum impact on the system
- Allows you to manage your SQL server or Oracle instances from dbWatch itself
- Highly scalable and secure
- Installation is simple and easy
- Dashboards are fully customizable
- You can add your custom tasks and reports as needed to improve your productivity
Why do we recommend it?
You can manage a large number of databases simultaneously with dbWatch. This tool is designed to watch over database farms rather than just one or two instances. The software installs on Windows Server and it will monitor SQL Server, MySQL, MariaDB, Oracle, PostgreSQL, and Sybase databases, which can be on your servers or on cloud platforms.
Who is it recommended for?
The dbWatch package is designed for large organizations with multiple database instances. Its smallest plan covers 10 database instances, so this system won’t be suitable for small businesses that have just one or two databases. The console shows a performance overview for all instances and provides alerts for performance problems.
Pros:
- Supports multiple database types including cloud-based databases like Azure SQL
- Good option for businesses that have a large amount of SQL servers in operation
- Can proactively alert based on set thresholds
- Available cross-platform on Windows, Linux, and Mac
Cons:
- Minimum license requirement of 10, not for small businesses
dbWatch comes in two editions, and both require a minimum of 10 instances. The first is the Enterprise edition which costs $490 per instance, and ten instances cost $4900. The second edition is the dbWatch Control Center which costs $550 per instance, coming to $5,500 for ten instances.
While there are no free trials, you can get a free evaluation of the dbWatch Control Center by clicking here.
Conclusion
To conclude, databases are a critical component of your infrastructure, and hence they have to be monitored for availability and performance. However, in large organizations with multiple databases, it is not practical to monitor manually. This is why you need automated tools that come with advanced capabilities to monitor these databases for you.
The tools mentioned above also present the monitoring results in a visually appealing format so that you can know the status at a mere glance. Therefore, we hope you find the above information and recommendations helpful in deciding the right database monitoring tool for your organization’s infrastructure.
Database Monitoring Tools FAQs
What are the common metrics monitored in a database?
Common metrics monitored in a database include CPU usage, memory usage, disk usage, I/O activity, query response time, and transaction throughput.
How is database performance monitored?
Database performance is monitored by collecting and analyzing various metrics related to the database's performance. This can be done using a variety of tools, including monitoring software, log files, and performance counters.
What are the different tools used for database monitoring?
There are many tools available for monitoring databases, including commercial tools such as SolarWinds Database Performance Analyzer, AppDynamics, and New Relic, as well as open-source tools like Nagios, Zabbix, and Prometheus.
What are the benefits of using a database monitoring tool?
Some benefits of using a database monitoring tool include improved database performance, increased uptime, faster problem resolution, and more efficient use of resources.
What are the common issues that can be detected using database monitoring?
Common issues that can be detected using database monitoring include slow query performance, resource bottlenecks, database crashes, security breaches, and data corruption.
What are some best practices for database monitoring?
Some best practices for database monitoring include monitoring key metrics regularly, setting up alerts for critical issues, monitoring databases across different environments, and analyzing performance trends over time.
How can database monitoring help with capacity planning?
Database monitoring can help with capacity planning by providing data on resource usage and performance trends over time. This information can be used to determine when additional resources or infrastructure may be needed to support the database.