If you’re looking for a product that will map your network, and help manage your network connections, then you might want to take a look at a product called InterMapper, from Fortra.
InterMapper is designed to provide a real-time, dynamic visualization of your network. It can automatically scan your network, create maps of all network devices – and will also determine how those devices inter-connect. Connections are drawn on the map, making it easy for administrators to see at-a-glance if either a device or an interface is in trouble.
Features
At first glance, InterMapper maps look a bit simplistic. But don’t let apparent simplicity fool you. In fact, InterMapper has a great deal of sophistication lurking just below the surface – no doubt it took a lot of thought on the part of the software engineers to make the product look as simple as it does.
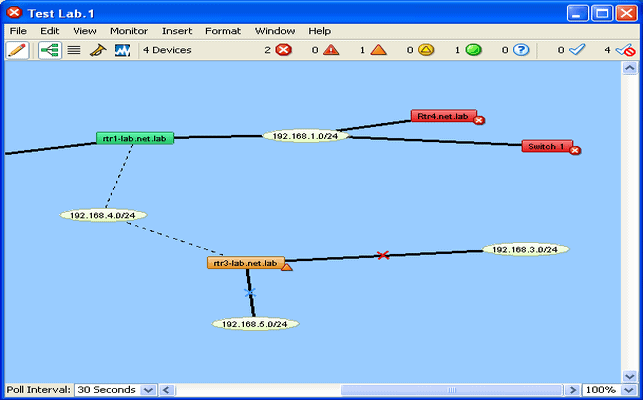
InterMapper uses network scans and SNMP polling to build a graphical representation of your network. Just enter either the the IP addresses of a network device, or a starting IP for a scan, and InterMapper will automatically generate a map like the one of my test-lab below. No need to manually draw in subnets or other links, it’s all automatic!
You can overlay discovered devices over top of a graphic to help organize your maps in great detail – for examples check out some of the user generated maps on the InterMapper site.
Link speeds are indicated by different types of connectors, and helpful “crawling-ants” indicate traffic flow volumes over those links. Devices are color coded to indicate status. Green is good, Red is bad. The Orange devices are in a warning state – the device is up, but one or more interfaces are down.

InterMapper Test Lab Map
A couple of clicks on any device can bring up a statistics summary window for that object. The summary for rtr3-lab looks like the screenshot below.

InterMapper Device Status
Compare that to the next screenshot, which is for the rtr3-lab interface that connects to rtr1-lab. Detailed interface statistics provide a great at-a-glance view of interface speed, utilization, and errors.

InterMapper Interface Status
Problem notification is a large part of the job for most network management systems, and InterMapper handles the task well.
Probes can be configured to test application servers for connectivity, which simulate things like HTTP connection attempts. This allows InterMapper to detect if your web server application stops responding, even if the server OS doesn’t actually go offline. A large number of probes are installed with the software, and more are available from the helpful InterMapper user community.
Notifications can be configured to send alerts on warning or certain error conditions. For example, you can specify the number of errors required before triggering an alert. Other options include alerting delays, and options for repeat notifications for critical systems.
InterMapper allows notifications to be acknowledged too, which can permanently or temporarily suppress alerts on a device or interface. Administrators can enter comments into the acknowledgment window, which can help other administrators who might end up looking at the problem later.

InterMapper Notification Selection
Strip charts can be generated on the fly, by simply clicking on a metric from one of the interface or device status windows. Strip charts begin collecting data immediately, allowing administrators to gather real-time trend data.

InterMapper Strip Chart
InterMapper also makes visualizing large networks simple, thanks to a few clever tricks. One helpful technique is the use of summary maps. Summary maps can be used to group collections of devices – for instance branch offices. Clicking on the office would then allow you to drill down to see detail for the network at that site.
Also helpful are the built-in display options that can auto-arrange maps on the fly. Maps can be instantly auto-arranged into different displays like a bus, or star, making it easy to see groups of networks connected to core devices, like in the screenshot below.

InterMapper Large Map
During product testing I found InterMapper to be reliable and easy to use. Installation was a quick process – don’t blink or you’ll miss it. The next step after installation is configuration, which was also painless. The network can be auto-discovered, or either IP addresses or subnets can be specified.
Another nice add-on option is the InterMapper Flows module, which enables netflow/jFlow/sFlow/etc, or whatever flavor your particular hardware manufacturer supports. Flow reports are great for identifying exactly what traffic is causing those unusual spikes and for identifying bandwidth hogs.
On the Other Hand…
I only have a couple of complaints about InterMapper. It’s important to realize that most of InterMapper’s functionality is built in to the map window. There are no separate modules for things like Syslogs, and reporting. While this makes for an astonishingly simple user interface, it leads to a couple of weaknesses compared to some competitors.
Historical reporting is difficult. Granted, there’s an add on component called “InterMapper DataCenter” that can store historical data, but no UI is provided to help mine that data – you’ll need to write your own scripts for that. On the plus side, you can create strip charts which will continually gather and store data. This would help to provide some baseline information. But if you didn’t think to create a strip-chart for a specific element and you discover you need to find out what the latency on a link looked like last night, then you’re out of luck.
The same goes for Syslogs. InterMapper can’t function as a Syslog server – though it does receive and store SNMP logs. This may not be crucial depending on your requirements.
One last limitation: the base version of InterMapper installs and runs on a single server. Web-access can be enabled to give your administrators some remote functionality, but another add-on product called InterMapper RemoteAccess is required to have full access from remote workstations. A five-pack of RemoteAccess licenses will cost around $1000(USD).
That said, the RemoteAccess module adds some nice functionality. With RemoteAccess, everyone viewing a map sees the same changes at once – similar to a shared whiteboard. So, event acknowledgments and map changes can be seen instantly by all InterMapper users instantly.
InterMapper is priced by the device, as opposed to the number of interfaces or services to be monitored. This model of pricing is easy to work with – a license to monitor 500 devices and 2 NetFlow exporter devices, will cost $3,385(USD), with various options to monitor more devices. Additional Netflow sources cost another $350(USD) each. Full pricing can be found on the InterMapper website.
To sum it up: InterMapper is a great tool for documenting and managing your network. It has an easy to use, simple interface. It allows you to visualize your entire network at-a-glance to instantly detect if any systems are in trouble, and it can probe virtually any SNMP variable that you need to monitor.
No, it doesn’t do everything else that other management software can. But, what it does is fairly unique – and it does it very well – making InterMapper well worth considering for your NMS needs.
Product: Fortra InterMapper | A free evaluation copy of Intermapper can be downloaded here.
Rating: 

![]() 3.5
3.5
Pros:
- Excellent way to visualize your network
- Maps make the network self-documenting
- Identify trouble spots at a glance
- Notifications alert administrators to problems
Cons:
- Historical reporting is weak
- Some potentially important features are missing e.g. Syslog logging
- Remote-access not included in base product
Fortra InterMapper FAQs
What is the pricing model for Fortra InterMapper?
Fortra InterMapper is priced based on the number of devices being monitored and the specific features and modules selected.
How does Fortra InterMapper support network mapping and visualization?
Fortra InterMapper includes a variety of mapping and visualization tools, including graphical maps, network diagrams, and network topology maps, which help administrators visualize network performance and identify potential issues.
What types of support are available for Fortra InterMapper?
Fortra InterMapper offers a variety of support options, including phone and email support, as well as online documentation and community forums.
Does Fortra InterMapper provide real-time network monitoring?
Yes, Fortra InterMapper provides real-time network monitoring, allowing administrators to quickly identify and troubleshoot issues as they occur.
Can Fortra InterMapper monitor multiple network types?
Yes, Fortra InterMapper can monitor multiple network types, including LANs, WANs, and VPNs.
How does Fortra InterMapper help with network capacity planning?
Fortra InterMapper provides detailed information about network performance and bandwidth usage, which can be used to plan for future network capacity needs.
