Sensu is an open-source solution for monitoring infrastructure and applications. It monitors the health of servers, services, and applications and can integrate with third-party tools to deliver alerts and notifications. Sensu is a messaging system that is written in Ruby and can process messages using either RabbitMQ or Redis. Data is stored in Redis using this system.
Sensu is an option worth considering if you want to monitor the infrastructure of your cloud in a way that is both straightforward and effective. It is possible to combine it with a number of the modern DevOps stacks that your company may already be utilizing, such as Slack, HipChat, or IRC, and it can even deliver mobile and pager notifications with PagerDuty.
It takes as little as fifteen minutes to get Sensu up and running. It can take you less than a minute to complete the initial steps! Don’t believe us? Please give the following quick start guide a try.
What Does Sensu Do?
Sensu is a network monitoring service that is hosted in the cloud and offers assistance to companies of varying sizes with the collecting of performance data and diagnostics. Server performance monitoring, bandwidth monitoring, uptime monitoring, network resource management, and event logging are some of its most important functions. The program comes with a module that, when activated, gives network teams the ability to monitor ephemeral container infrastructures such as Kubernetes, RedHat OpenShift, Docker, Mesos, and Cloud Foundry as well as gather events, metrics, and labels.
Key Features
- Keep an eye on everything, from bare metal to mainframes, containers, cloud computing instances, and everything in between.
- Control the monitoring of both the availability and performance of the applications from a single, centralized platform.
- Users can interface with their already established tools, such as ElasticDB, Grafana, and InfluxDB, which helps to optimize the user process.
- Users can create incidents and find solutions to problems as soon as they occur thanks to automated alerts delivered via email, PagerDuty, and Slack.
- Utilizing ElasticSearch, Splunk, and InfluxDB, you can collect and store container and application metrics at any time, from any location.
This system can be used by teams to collect StatsD and Prometheus metrics, and teams can then store the collected data using technologies such as InfluxDB, ElasticSearch, or Splunk. This solution allows network administrators to monitor large-scale environments by traversing difficult network topologies such as NATs, VPNs, and firewalls. They can use this solution. Sensu offers notifications on the aggregate health of a service across several nodes, and it is interoperable with monitoring systems such as Nagios and Zabbix. You can obtain it by subscribing every month, and support is offered over the phone, via email, and through an online help desk.
Sensu gives consumers access to a unified and centralized management platform from which they can monitor the availability and performance of their applications. Sensu provides a free and open-source framework known as Sensu Core, in addition to a commercially sponsored version known as Sensu Enterprise. The Sensu Enterprise solution comes with a variety of capabilities, such as service checks and metrics.
Pros:
- The latest version, known as Sensu Go, is simple to set up.
- When compared to Nagios, which was the previous monitoring system that we were using, it is a lot simpler to manage and scale.
Cons:
- The graphical user interface is in desperate need of improvement; in comparison to Nagios XI, it is rather basic.
It offers compatibility with Prometheus and Nagios, alarms, and incident management, as well as Active Directory and enterprise-grade connectors (ServiceNow, Jira, Splunk). Users can keep total visibility over their entire infrastructure for both public and private cloud environments with the assistance of Sensu. Users can collect analytics regarding containers and applications and store them anywhere they choose (ElasticSearch, Splunk, etc.).
Featured Integrations
Integrations with Sensu consist of plugins, libraries, and runtimes that allow you to extend Sensu’s functionality and automate your monitoring and observability workflows. These integrations can be found on the Sensu Marketplace. You can rely on Sensu’s integrations to get work done with Sensu as a part of your existing workflows, which is another option available to you.
Integrations are service-specific, meaning they have their own unique needs for setting them up and configuring them. Each integration comes with its self-contained documentation, which details in great detail how to install and make use of the integration. A good number of the offered integrations come with carefully crafted quick-start templates that only require minor adjustments on your part to be used.
Although this category focuses on our most popular featured integrations, you can find more supported, Enterprise, and community-tier integrations at Bonsai, the asset hub for Sensu. Bonsai is located here. Gather information from any source. Send it to the tools you’re already utilizing in your workflow.
Sensu is capable of collecting data from all of your mission-critical systems, including cloud platforms such as Kubernetes and AWS, data and web platforms such as Splunk or Apache, and third-party monitoring tools such as Prometheus and Nagios.
Sensu is compatible with the tools that you are already utilizing. You may transmit data to the database of your choice, automate alerts using the incident management platform of your choice, and automate monitoring and remediation using the configuration management tools you already have.
The plugins and dynamic runtime assets made accessible by Sensu, which are located in a database that can be searched with relative ease, make it simple for you to locate and share your preferred monitoring solutions in a just-in-time manner.
Cloud Platforms
AWS, Google Cloud Platform, Microsoft Azure, Kubernetes, Red Hat OpenShift, Docker, and OpenStack are just some of the cloud platforms on which Sensu is currently operational. Sensu enables you to keep an eye on whatever cloud platform you like.
Storage Platforms
Send monitoring and observability data to a variety of databases and services, including Elasticsearch, Splunk, InfluxDB, Postgres, MySQL, Redis, MongoDB, Cassandra, and Kafka. Data on monitoring and observability should be correlated with and analyzed alongside data on other business variables to improve business intelligence.
Web Platforms
Sensu may be utilized to monitor the many web platforms that you are already utilizing, such as NGINX, Apache, Microsoft IIS, Memcache, HA Proxy, Tomcat, and many others.
Platforms for Automated Processes
Automate your monitoring by using Sensu to keep an eye on your configuration management tools like Puppet, Chef, Ansible, Terraform, Helm, and Pulumi, as well as many others.
Incident Management
Sensu can automatically create occurrences in Pagerduty, ServiceNow, VictorOps, OpsGenie, JIRA, and more. It can also update existing incidents and resolve them.
Third-Party Monitoring instruments
Sensu integrates seamlessly with the monitoring technologies you already employ, such as Prometheus, Nagios, StatsD, SNMP, and others, to provide you with complete visibility into your infrastructure.
How Does Sensu Work?
Architecture
Transport is the primary mode of communication utilized by Sensu. For components of Sensu to communicate with one another, each component must first connect to the Transport. Transport can use either RabbitMQ or Redis; however, Redis is suggested for production use.
Sensu Server analyzes the event data and performs the necessary tasks. It also processes check results and monitoring events by using filters, mutators, and handlers to manage the client registration process. The server is responsible for publishing check definitions to the clients, and the Sensu API is responsible for offering a RESTful API that gives users access to monitoring data as well as basic functionality.
The checks that are carried out by Sensu Client are either those that have been scheduled by Sensu Server or those that have been defined locally. All of the permanent data is stored in Sensu’s data store, which is called Redis. Uchiwa, which stands for “finally,” is a web interface that allows users to communicate with the Sensu API.
Configure Your Very First Monitor
The deployment of instrumentation, such as plugins or scripts, as well as the configuration of new monitors, is made simple with Sensu. This example demonstrates how to monitor the clock drift on an NTP system.
Congratulations on finishing this short guide to getting started. The purpose of this little tutorial is to demonstrate how simple it can be to get started using Sensu and get everything up and running. If anything, you’ve seen up to this point has piqued your interest, the resources that are listed below can assist you to proceed with your adventure.
Raise Your Sensu Expertise to the Next Level
Now that you have a basic Sensu development environment up and running on your computer, it is a good opportunity for you to look through our documentation and instructions. The Sensu Go Guides provide detailed instructions on how to configure Sensu to carry out various observability tasks and workflows, such as monitoring server resources, routing alerts and reducing alert fatigue, exporting metrics, and planning maintenance windows, amongst other things. These instructions include examples and step-by-step walkthroughs.
Get Ready for the Rollout of the Production
Are you prepared to put Sensu to work in environments other than your local installation? You can use the monitoring as code templates that you’ve created and edited in this quick start tutorial and any guides that you’ve followed to realize Sensu’s value at any scale. This is true regardless of whether you’re deploying Sensu in a lab with 10 machines, a production environment with hundreds or thousands of servers, compute instances, and containers, or anywhere else beyond that.
Install the Sensu Backend into Your System
Ubuntu/Debian, RHEL/CentOS, and Docker are all supported operating systems by the Sensu backend. Examine the many platforms that are supported for further information.
RHEL/CentOS
# Integrate the Sensu repository curl -s https://packagecloud.io/install/repositories/sensu/stable/script.rpm.sh | sudo bash
# Install the sensu-go backend on your system. packagesudo yum install sensu-go-backend
Set up, and get going with it.
Either a sensu-backend start flags file or a /etc/sensu/backend.yml file can be used to customize the Sensu backend. (The former is recommended.) The state-dir flag is the bare minimum requirement for the Sensu backend; however, a variety of other helpful configurations and templates are available.
The backend reference features an exhaustive catalog of configuration choices as well as information regarding backend initialization.
WARNING: If you intend to run a Sensu cluster, before continuing the installation procedure, make sure that each of your backend nodes has been configured, is running, and is a member of the cluster. This is required if you want to run a Sensu cluster.
Initialize
If you are working with Docker, initialization has already been finished in the second step.
- Configure, and then begin.
- Move on to the number 4.
- Launch the web-based user interface to get on with the backend installation.
- Install sensuctl and move on to step 3 if you did not use environment variables to override the default admin credentials in step 2.
- Moving on to step 3 will allow you to quickly change your default admin password.
When the backend is up and running, you may set up your Sensu administrator username and password by using the sensu-backend init command. You simply need to set environment variables with a username and password string at this point in the initialization process; there is no requirement for role-based access restriction at this time (RBAC).
If you want to use a different username and password, replace “username” and “password” with those, respectively:
Ubuntu/DebianRHEL/CentOS
export SENSU BACKEND CLUSTER ADMIN USERNAME = “username” / “username”
export SENSU BACKEND CLUSTER ADMIN PASSWORD=password> in the cluster administration file.
sensu-backend init
Read the backend reference for further information regarding the initialization of the Sensu backend.
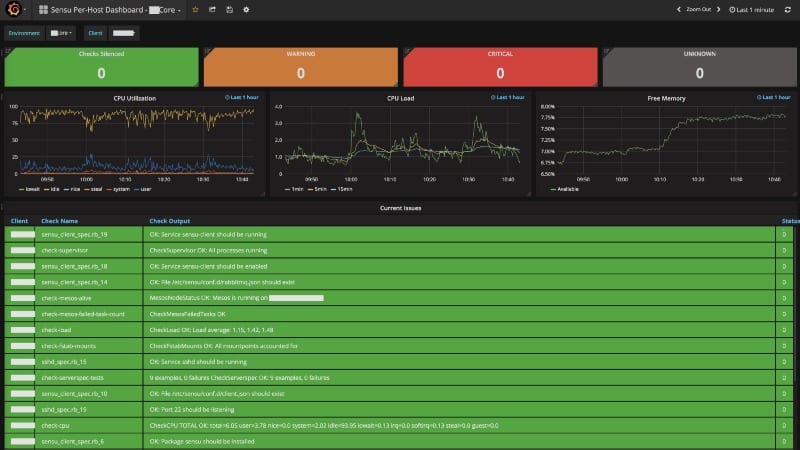
Launch the Web Interface
The web user interface gives you a consolidated view of all the observability events, as well as tools that are simple to use and designed to cut down on alert fatigue. After the Sensu backend has been started, the web user interface can be accessed by going to http://localhost:3000. You may need to change localhost to the hostname or IP address of the computer on which the Sensu backend is being run.
Simply entering your Sensu user credentials will allow you to log in to the web user interface. Your user credentials are the username and password that you specified when you set the environment variables SENSU BACKEND CLUSTER ADMIN USERNAME and SENSU BACKEND CLUSTER ADMIN PASSWORD.
Install the Sensuctl Driver
Sensuctl is a tool for managing resources within Sensu that is used using the command line. For it to function properly, it makes calls to Sensu’s HTTP API to create, read, update, and delete resources, events, and entities. There are versions of Sensuctl available for macOS, Linux, and Windows.
RHEL/CentOS
# Incorporate the Sensu repository cURL: https://packagecloud.io/install/repositories/sensu/stable/script.rpm.sh | sudo bash
# Install the sensu-go-cli packages by entering the following command: sudo yum install sensu-go-cli
Run the sensuctl configure command and log in with your user credentials, namespace, and the URL of the Sensu backend. After that, you may begin using sensuctl. To configure sensuctl with default values:
command: sensuctl configure -n —username “YOUR USERNAME” —password “YOUR PASSWORD” —namespace “default” —url “http://127.0.0.1:8080”
In this case, the non-interactive mode is activated when the -n flag is passed. To examine your user profile, run the sensuctl config view command.
Change Default Admin Password
If you are using Docker and you did not use environment variables to override the default admin credentials in step 2 of the backend installation process, then we recommend that you change the default admin password as soon as you have installed sensuctl. You can do this by going to the Sensuctl Settings page and clicking the Change Default Password button. Run:
‘sensuctl user change-password —interactive’ is the command to use
Conclusion
Sensu’s presentation is significantly dissimilar to that of other systems that I’ve used in the past, such as Opsview, GroundWork, and checkMK, and I believe that there are many opportunities available when using it as code.
I am aware that one of the primary advantages is the capacity to incorporate this with a build using Jenkins or Rundeck and to have the device monitoring controlled by code; this is going to be the next step for me. It’s a much lighter solution, and the majority of the fundamentals are pretty easy to get set up. In addition to the things that have been mentioned above, such as checking that services are running and checking that websites have a response code of 200, and other similar things. However, I’m hopeful that as I get more knowledge about this topic, it will become more transparent to me.
Sensu FAQs
What are the key features of Sensu?
The key features of Sensu include scalable and flexible monitoring, multi-cloud and multi-platform support, integrations with popular tools and services, and automation capabilities.
How does Sensu work?
Sensu works by using agents installed on servers, containers, or applications to collect and send data to a central monitoring server. The monitoring server then processes the data and generates alerts or takes automated actions based on pre-configured rules.
What types of data can Sensu monitor?
Sensu can monitor a wide range of data, including system metrics, logs, events, and application performance data.
How does Sensu handle alerts?
Sensu handles alerts by sending notifications to the appropriate channels, such as email, Slack, or PagerDuty, based on pre-configured rules and thresholds.
What type of support is available for Sensu?
Sensu offers various levels of support, including community support through forums and documentation, as well as paid support options with faster response times and dedicated technical support.
Can Sensu be deployed on-premises or in the cloud?
Yes, Sensu can be deployed on-premises or in the cloud, depending on an organization's specific needs and preferences.