The monitoring tool known as Riemann collects events from hosts and applications and can then input those events into a stream processing language so that they can be altered, summarized, or acted upon. The goal of the Riemann platform is to automate the process of monitoring and measuring events as much as possible.
What actually does Riemann do?
Riemann is also capable of monitoring the current status of incoming events and makes it possible for us to construct tests that make use of sequences or combinations of occurrences. Notifications, the ability to send events to other services and into storage, and several other connectors are all provided by it. Riemann, as a whole, possesses functionality that is capable of addressing all of our goals. It is quite quick.
Riemann, as a whole, possesses functionality that is capable of addressing all of our goals. It is quick and may be configured in a wide variety of ways. The amount of throughput that can be achieved with standard Riemann running on commodity x86 hardware is dependent on the actions that are taken with each event; nonetheless, it is possible to achieve latencies of less than one millisecond.
The Riemann software is distributed as open source and is subject to the Eclipse Public License. The majority of the writing for it was done by Kyle Kingsbury, also known as Aphyr. Clojure is the language used to create Riemann, and it is built on the JVM.
The Index, Events, and Streams
Riemann is a piece of software that processes events. If we are going to make use of Riemann, there are three different ideas that we need to be familiar with. These ideas are events, streams, and the index.
Let’s begin by taking a look at the events.
Events
The event serves as Riemann’s fundamental building block. Riemann is a system that receives events, which may then be processed, tallied, collected, altered, or exported to other systems. Riemann treats a struct as an immutable map, and this structure is what Riemann refers to as an event. The majority of the time, while referring to an event field within our Riemann configuration, we will use keywords. Keep in mind that keywords are frequently utilized to identify the important component of a key-value pair that is contained within a map, and that our event is an immutable map. We identify keywords by the prefix that comes before them.
Therefore, the host field should be referred to using the: host notation. An additional component, known as an optional custom field, may also be added to a Riemann event. You have the option of configuring extra data at the time that the event is created, or you can add new fields to the event as it is being processed. For instance, you could add a field to an event that contains a summary or derived metrics.
The layer that immediately follows events is called streams.
Streams
Each new event that arrives is appended to one of several streams. The Riemann setup contains a section labeled “streams,” which is where you define the streams. Streams are functions that can be used to aggregate, modify, or escalate events based on the parameters that are passed to them. Streams can also have child streams, which allow them to send events down to subordinate streams. This enables the event stream to be filtered or partitioned in various ways, for example by selecting only the events that originate from particular hosts or services.
The best way to understand streams is to compare them to plumbing in the real world. The events flow into the plumbing system, collecting in tanks and dams before being filtered by grates and drains.
You are not limited in the number of streams that you can create, and Riemann offers a strong stream processing language that enables you to choose the events that are pertinent to a particular stream. For instance, you might choose events from a particular host or service that fulfills additional requirements if you so desire.
However, much like your home’s plumbing, streams are built in such a way that they allow events to pass through them while retaining little to no state at all. However, there are several reasons why we need to keep some of our states. Riemann possesses the index to handle this state.
Riemann’s Index of Entropy
The index is a table that contains information about the current status of all of the services that are being monitored by Riemann. You provide Riemann with instructions on the events that you want it to index. By mapping each event’s host and service fields, Riemann generates a new service for each one of the indexed events. After that, the index will remember the most recent event associated with that service. You might consider the index to be Riemann’s worldview as well as the truth-giving source for the state. You can do queries against the index using streams or even third-party services.
In the preceding section, we discovered that the definition of an event can include a TTL, also known as a Time-To-Live field. This variable determines how long an event is considered to be active after it has occurred.
When an event has been in the index for longer than its TTL, it is considered expired and removed. At the time of each expiration, a new event is generated for the indexed service with the expired value assigned to the state field of its object. After that, the newly created event is reintroduced into the stream.
Let’s take a more in-depth look at this, shall we? Take for instance the following event:
It originates from a host known as www and is intended for use with a service known as Apache connections. The TTL for this item is twenty seconds. If we index this event, Riemann will establish a service for us by mapping www connections to Apache ones. If Riemann continues to receive events, the index will update itself to reflect the most recent information received from this service. If the flow of events is interrupted, the event will be marked as “expired” in the index sometime after 20 seconds have elapsed.
In the following format, a new event will be generated for this service with the state parameter set to expired.
After then, the event in question will be reintroduced into the streams so that we can make use of it. Since we utilize Riemann to monitor our many applications and services, we anticipate that this behavior will prove to be quite helpful to us. We are going to monitor for services whose events have expired rather than polling for failed services or checking for failed services.
Using Riemann to Construct a Monitoring System: Step-by-Step Instructions
It could seem like a daunting task to build your monitoring system from scratch using tools like Riemann, Graphite, and Collectd. But you can do it! In this three-part article series, we will provide an overview of the many tools and technologies that are available to you, as well as demonstrate how they can connect.
The following will serve as our primary points of focus:
- Riemann
- Graphite
- Collected
Ubuntu 14.04.5 Long-Term Support is the version that we are working with for this particular activity. On the other hand, you are free to make use of any alternative Linux distribution. The procedures required to install Ubuntu will be walked through in this article. There are a great number of tutorials available online for you to use if you are working with various Linux variants.
Let’s begin using Riemann, which is a free and open-source program.
Riemann Installation
- Visit http://riemann.io/ to download the version of the Riemann installation that best suits your needs (.deb,.rpm, or.tar).
- Install. In this particular instance, we shall operate on the .deb file.
- Once the Riemann installation is complete, we will want to download a few Riemann-related utilities as well as a dashboard.
- Ruby will be required for that purpose.
- To download the dashboard and the utility, run the commands that are listed below.
- sudo apt install ruby
- sudo gem install Riemann-client Riemann-tools Riemann-dash
Starting Riemann Dashboard
Let’s start Riemann and Riemann-dash.
- service Riemann start OR Riemann OR Riemann /etc/Riemann/riemann.config
- You can get Riemann going with any of the commands that were listed above. On port 5555, the Riemann server has begun to listen for connections. This is the configuration of the port that is used by default. You always have the option to change that parameter by modifying the Riemann.config file.
- Execute the following command: Riemann-dash
- Open in Browser
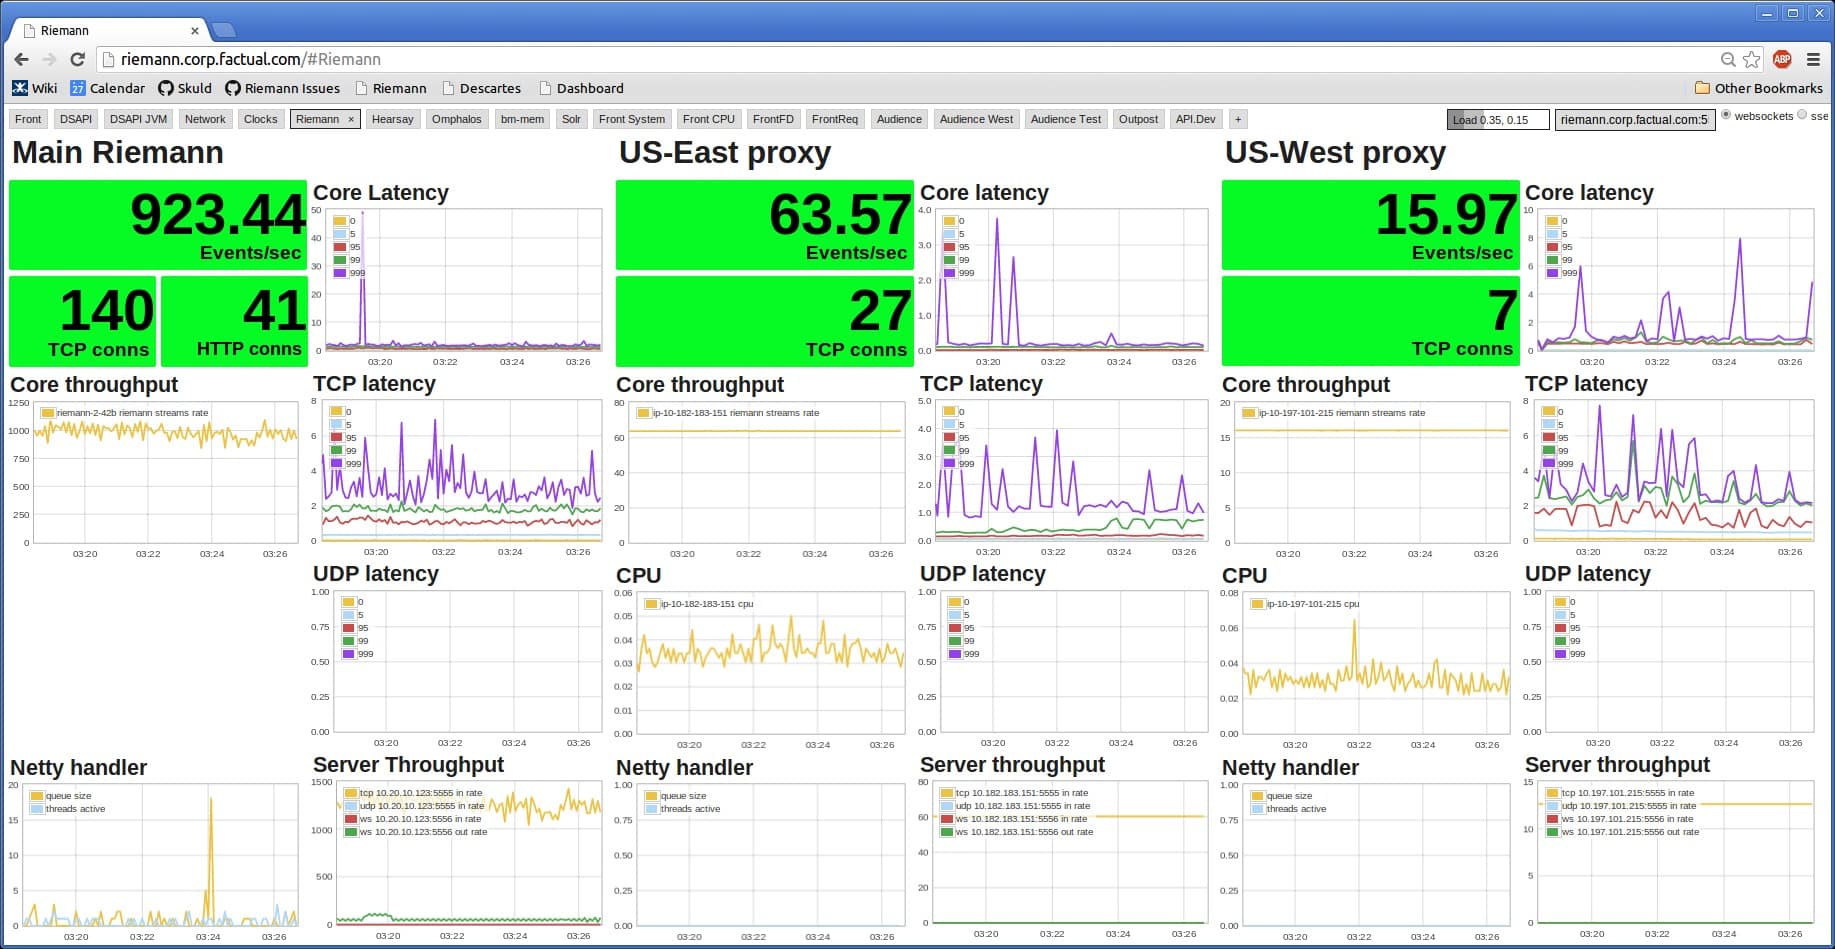
The Riemann dashboard has begun to run on port 4567, and we are now able to open it in the browser that is displayed below.
The following thing you need to do is hold down the “Ctrl” key and click on the region that’s been circled in red in the image that’s been provided for you here.
After you have clicked on it, you can bring up a pop-up window by using the “e” key on your keyboard. Fill in the appropriate data in that popup. See an illustration of this below.
In the question section, the image displays the word “true.” This indicates that Riemann is receiving all of the data streams from the display.
After you have selected “Apply,” you will be able to observe the transmission of various system events.
Riemann-Clients
The Riemann server has been brought online and is functioning normally. The next thing we need to do is contact Riemann and tell him about the user-defined events for our application so he can begin processing them.
You can see that the Riemann client already has a client library for many different programming languages on the page for the Riemann client. Some of these languages are C, C++, C#, Clojure, Elixir, Erlang, Go, Java, Lua, Node.js, OCaml, Perl, and Python, to mention a few. The open-source tool Riemann is compatible with a wide variety of additional applications, programs, and plugins, all of which can be readily connected with it.
For the sake of this demonstration, the Riemann-java-client library is being utilized, and the Riemann java client program is being used to submit our very own user-defined events from within this Java application.
Clients Send Events to Riemann
Protocol Buffers are the languages that Riemann clients communicate via TCP and UDP. They can query the index and send Riemann event submissions.
Write a client in your favorite language. Do you require assistance with the procedure? Check out the client implementers’ guide, or get in touch with me directly.
- Clients: Client libraries to let you instrument your code.
- C: Daniel Hilst developed a client in C that was capable of supporting events as well as queries. Another client, written in C by Gergely Nagy, supports events and queries but utilizes a different API and has a distinct set of objectives.
- C++: Bigdatadev developed a client in C++ that supported events and queries, RAII, exceptions, move semantics, and STL containers. The client was written by bigdatadev.
- C#: Blue Mountain Capital has developed a client in the C# programming language.
- Clojure: A lightweight wrapper for the Java client is provided by the Riemann-clojure-client.
- Elixir: Elixir-riemann is an Elixir TCP client. Riemann is an Elixir client that allows index querying and has support for UDP, TCP, and TLS protocols.
- Erlang: An Erlang client called Zeta was recently released by Reify Health.
- Guile: A Guile client library that was written by Gergely Nagy and built on top of his riemann-c-client library was called riemann-disguile.
- OCaml: Dave Parfitt is hard at work on the riemann-ocaml-client project right now.
- Python: EagleEye provides a UDP transport that supports both long and float metrics for users who are utilizing the Twisted framework. Additionally, there is borntyping’s riemann-client, which is capable of queuing events for delivery, in addition to supporting UDP, TCP, and TLS protocols. The Python client for Banjiewen is known as Bernhard. You can install it by typing pip install Bernhard into the command line.
- Scala: Rached Ben Mustapha is in the process of developing a Scala client that will provide dynamic typing, an asynchronous API (which will be powered by Akka in the background), and a DSL.
- Toolbox: Instruments, programs, and add-ons that monitor already-installed systems.
- Riemann-Tools: Riemann-tools is a Ruby gem that includes a collection of small daemons designed to monitor important systems such as host health, Riak, and others. It only takes a few lines of code on your part to build your pollers if you require it as a library first.
Plugin: Write Riemann
Riemann is a stream processing and monitoring system, and the Write Riemann plugin saves values in that system. Riemann is a stream processing system that may be used for querying, modifying, and visualizing value streams. These capabilities are all possible with Riemann. Because of this, Riemann is a powerful and helpful companion for collectd because it enables more nuanced alerting than is feasible with collectd’s built-in thresholds.
When sending data to Riemann, the Write Riemann plugin will either make use of UDP packets or a TCP connection. See the section below labeled “Example data” for a breakdown of the binary encoding that has been applied to the data.
It is possible to configure numerous Node blocks so that data is sent to multiple instances of the Riemann program. Filters allow you to convey data selectively, and you may do so by utilizing the name that is supplied in the block. As an illustration, if you configure the connection to an instance of Riemann with
Limitations
Save the binary to your computer. After running the build script, during the execution of the configure script, include the “—enable-write riemann” flag; this should successfully install the component. On CentOS, I was missing a significant number of dependencies, which caused a great deal of error. After those plugins were put in place, the write Riemann plugin was compiled and put in place.
When installing the dependencies, you can run into another problem, which is that you are unable to locate the appropriate packages for protobuf-c. Yum was the package installer that I was using. Change the enabled value from 0 to 1 by using the command sudo vi /etc/yum.repos.d/epel.repo. When the configure script was executed after this, the protobuf-c processor was successfully identified. This resolved the difficulty I was having. I hope it works for you as well!
Conclusion
Since Riemann is a low-latency event stream processing system, discrete events and event streams constitute its primary area. This technique is better suited to a dynamic, highly distributed environment than certain standard monitoring systems because servers and static infrastructure are emerging issues rather than basic ones.
In the end, we prefer Riemann because it keeps out of the way and frees us up to concentrate on selecting the data to track rather than the methodology. Finding the metrics, thresholds, and intervals that reflect stable and nominal operational values becomes the main difficulty at that point to guarantee the purity and, consequently, serviceability of signals that emerge from threshold violations.
Riemann FAQs
What is Riemann?
Riemann is an open-source event processing and monitoring tool that allows users to collect, analyze, and act on real-time data from a variety of sources.
What types of data can be monitored with Riemann?
Riemann can monitor a wide range of data sources, including logs, metrics, and system events.
Is Riemann scalable?
Yes, Riemann is designed to be highly scalable and can handle large amounts of real-time data from a variety of sources.
How does Riemann compare to other event processing and monitoring tools?
Riemann is known for its simplicity, flexibility, and scalability, making it a popular choice among DevOps and IT teams. It is particularly well-suited for real-time monitoring and analysis of large amounts of data.
What programming languages are supported by Riemann?
Riemann supports a variety of programming languages, including Java, Clojure, Ruby, Python, and Perl.
What types of visualization tools are available for Riemann?
Riemann includes a web-based dashboard that allows users to view real-time metrics and alerts. It can also be integrated with other visualization tools, such as Grafana and Kibana.
Is Riemann suitable for real-time monitoring of distributed systems?
Yes, Riemann is well-suited for real-time monitoring of distributed systems, and it includes features such as load balancing and fault tolerance to ensure that monitoring is continuous and reliable.
Can Riemann be used for network traffic analysis?
Yes, Riemann can be used for network traffic analysis by collecting and analyzing network event data in real-time.
What are some limitations of Riemann?
One limitation of Riemann is that it may require some technical expertise to set up and configure, particularly for complex use cases. Additionally, it may not be suitable for organizations with limited resources or IT expertise.
What are some common use cases for Riemann?
Common use cases for Riemann include monitoring network performance, tracking application metrics, detecting security threats, and analyzing system logs.