Nagios Core is the primary event scheduler, event processor, and alert manager for monitored elements. It is a daemon developed in C for performance and designed to run natively on systems, with several APIs that allow it to execute extra functions.
What Exactly is Nagios?
Nagios is available free of charge and can be used to perform continuous monitoring of infrastructures, systems, and networks. It executes plugins that have been saved on a server that is connected with a host or another server on your local network or the Internet. If there is a problem, Nagios will send an alert about the problem to the technical team so that they may begin the recovery process right away.
In a culture of DevOps, Nagios is utilized to perform continuous monitoring of systems, applications, services, and business processes. It gives IT workers the ability to get notifications by email, custom scripts, or text messages whenever crucial components fail and then recover after the failure.
It offers a wide variety of functionalities, including user administration, mail server monitoring, FTP monitoring, infrastructure management, data visualization, analytics, and more. Nagios Core has an application programming interface (API), which enables organizations to link the system with a variety of third-party platforms. This gives businesses the ability to push and pull data between different systems.
Why is the Nagios Tool Necessary?
The following is a list of the most essential advantages of utilizing the Nagios monitoring tool:
- Identifies any problems related to networks or servers
- Assists you in locating the primary source of the issue, which paves the way for you to get a long-term solution to the matter
- Constant, real-time surveillance of your whole IT infrastructure as well as your operational procedures
- Gives you the ability to monitor and diagnose problems with the server’s performance
- Assists you in the planning of infrastructure upgrades so that you may avoid breakdowns caused by aging systems
- You can ensure that the service is both secure and accessible at all times.
- Quickly and effectively resolve issues, even amid a crisis
16 Characteristics of Nagios
The following is a list of the key characteristics of the Nagios monitoring tool:
- Capable of being Scaled, Managed, and Secured with Relative Ease.
- An effective database and log system
- Web user interfaces that are both informative and aesthetically pleasing
- Notify users immediately and automatically if the condition changes.
- If everything is functioning normally with the services, there is no need to verify if the host is still alive.
- Assists you in identifying problems with your network or crashing servers
- You can undertake troubleshooting on the server’s performance concerns.
- During the process of monitoring, any problems that are found can have their solutions applied immediately as soon as they are discovered.
- You only need to make one pass to monitor the entirety of your company’s IT infrastructure and business processes.
- The architecture of the product makes it simple to create new plugins in the programming language of your choice.
- Nagios gives you the ability to read its configuration from a whole directory, which assists you in determining how to specify each file.
- Utilizes topology to determine dependencies
- Keep an eye on various network services, such as HTTP, SMTP, HTTP, SNMP, FTP, SSH, and POP, amongst others.
- Assists in the establishment of the network host hierarchy by use of parent hosts
- The capacity to define event handlers, which may then be executed during service or host events for proactive issue resolution
- Assistance in the configuration of redundant monitoring hosts
Capabilities Of Nagios Core
Architecture
The architecture of Nagios Core has been built with the goals of flexibility and scalability in mind. This architecture is focused and extendable. It has several application programming interfaces (APIs), which make it possible for its feature set to be readily expanded through the use of extra add-ons. This architecture is successful, and it has resulted in the production of thousands of addon projects that enhance the basic feature set that it provides.
General Scope
The responsibilities of check scheduling, check execution, check processing, event management, and alerting are the primary areas on which the scope of Nagios Core focuses its attention. More Nagios projects are responsible for duties such as performing checks, issuing notifications, analyzing performance statistics, and many other tasks that are typically considered to be outside of the purview of Nagios Core.
Frontends
Since its inception, Nagios Core has always shipped with a CGI interface, and this practice continues today. CGIs offer users of Nagios the fundamental functionality that is necessary to view and manage items that are monitored by Nagios Core. The CGIs have become the standard interface for the Nagios Core and are frequently utilized as an application programming interface (API) by numerous Nagios extensions. The style, feel, and functionality of the Nagios user interface can be customized by many users through the deployment of additional frontends. A new frontend called Nagios V-Shell is currently in the process of being created as the official PHP frontend to Nagios Core.
Extended Functionality
There is a vast selection of add-ons that offer additional functionality that is beyond the purview of Nagios Core itself. These add-ons come in the form of configurable frontends, performance graphing, auto-discovery, and distributed monitoring, amongst many other options. These functionalities are implemented in a variety of distinct Nagios projects, all of which are independently developed and may be located on the Nagios Exchange.
Architecture Created by Nagios
The Nagios architecture is a client-server setup. In a typical setup for a network, a Nagios server will be operating on one of the hosts, and plugins will be operating on each of the remote hosts that need to be monitored.
- A component of the server portion of Nagios is known as the scheduler. It triggers the execution of the plugins on the remote host by sending a signal.
- The plugin polls the remote host to determine its current state.
- The data is transmitted to the process scheduler by the plugin.
- The GUI is refreshed by the process scheduler, and administrators receive notice of the change.
The activities of the Nagios tool are dependent on a server-agent architecture, and Nagios itself runs on a host server (often as a daemon). At the component of the network that needs to be monitored, an agent is installed, and that agent is configured to connect with the Nagios server. The agent is used by the tool to retrieve metrics, and the tool then bases decisions on the events that occur and sets thresholds.
Native protocols, such as SNMP and WMI, are another method that Nagios can utilize in order to interface with systems. Both agent-based monitoring and protocol-based monitoring, depending on the configuration, can either be:
Active: The server makes contact with other components, including switches or other servers, and inquiries about the condition of those components.
Passive: This monitoring is when the system being watched only provides information to the server when anything goes wrong or regularly.
The architecture of Nagios has three primary components:
- Plugins are programmable add-ons that can interface with local and remote hosts that need to be monitored. They are installed on the Nagios server and executed there.
- The process scheduler performs checks on plugins at predetermined intervals and acts according to the results of those checks (such as alerting the staff or initiating an automatic script to remedy the problem).
- The graphical user interface, sometimes known as GUI, is the user interface of the Nagios system that allows users to view monitoring data and interact with the program.
Plugins
Nagios plugins offer low-level intelligence that may be used with Nagios Core to monitor anything and everything imaginable. Plugins have the functionality of a stand-alone application, but their primary purpose is to be run by the Nagios Core application. It establishes a connection to Apache, which is run by CGI, to display the result. In addition, a database is linked to Nagios and used to retain a log file. Plugins are self-contained add-ons and extensions that give users the ability to do the following:
- Define targets and parameters for the systems that are being monitored.
- Determine the current condition of a host or service.
Plugins can either be compiled binaries (written in C, C++, or another language) or executable scripts (written in Shell, Perl, PHP, or another language) that users run from a command line. Users are given the ability to monitor remote as well as local hosts using agents or local protocols through the use of plugins, which are executed on the Nagios server. The following are some of the things that
Nagios considers the results given by plugins:
- The current condition of the host
- The occurrence must generate an instant alert or can be logged using a simple interface.
- Whether or not to execute a fully automated troubleshooting script.
There are three distinct kinds of Nagios plugins:
Official plugins:
There are approximately fifty official add-ons that Nagios creates and maintains.
Community plugins:
There are over 3,000 third-party plugins that were built by members of the community and are accessible for use.
Tailor-made add-ons:
Because this program is open-source, it enables you to develop bespoke plugins for it, provided that your team possesses the appropriate expertise.
How do Plugins Work?
- Checknt is a plugin for monitoring Windows machines that is most commonly seen in monitoring servers. This plugin is available in most cases.
- NSClinet++ needs to be put in place on every Windows computer that you want to be able to monitor.
There is a secure socket layer (SSL) connection between the server and the host, which allows for continuous information flow between the two parties. Similarly, the NRPE (Nagios Remote plug-in Executor) and NSCA plugins are utilized to monitor Linux and Mac OS X, respectively.
Installing and Configuring a NAGIOS Server from the Ground Up: A Guide for Beginners
Nagios server (AKA Nagios core) is a very useful, open-source monitoring tool. With the help of the Nagios server, we can monitor stats like ram usage, cpu usage, hdd usage along with other parameters of several machines/servers on a single screen. If something goes wrong, it sends us a warning by using sound or sending a mailto configured to users or we can even configure Nagios to send an SMS to a phone number.
Pre-requisites
Before we can install Nagios, we need some packages like httpd, php, gcc, glibc, glibc-command, and GD on our system.
To install all these packages, run the following
$ yum install –y httpd php gcc glibc glibc-command gd gd-devel make net-snmp
After all the packages are installed, we will now download the Nagios and its plugin source file. As of the writing of this tutorial, Nagios 4.2.4 and Plugins 2.1.4 are the latest. You can directly download the files using the link below or you can use wget also to get these files. Now we will start with the installation of Nagios.
Installation
Step 1 – Creating a user and group for Nagios
We will add a user nagios and a group nagcmd.
$ useradd nagios
$ passwd nagios             (enter a password)
$ groupadd nagcmd
Now, we will add nagios and apache to the nagcmd group.
$ usermod –G nagcmd nagios
$ usermod –G nagcmd apache
Step 2 – Extracting Nagios files
We will now extract the Nagios and plugins files on our system.
$ tar -xvf nagios-4.2.4.tar.gz
$ tar -xvf nagios-plugins-2.1.4.tar.gz
Step 3 – Configuring Nagios server
Now that we have extracted the Nagios file, we will now go to the extracted folder and compile those files to install the Nagios server.
$ cd nagios-4.2.4
$ ./configure --with-command-group=nagcmd
After it’s completed, we will now run make and make install to complete our installation.
$ make
$ make install
once these steps are done, we need to install init –scripts, and commandmode and also need to install some sample Nagios files.
$ make install-init
$ make install-comandmode
$ make install-config
Step 4 – Configuring the Web Interface
Once all the above installations are complete, we can now configure web-interface where we will do all the monitoring. To install the web interface, run the following command.
$ make install-webconf
Our web interface is now installed and a default user “nagiosadmin” has been created. We will now assign a password to user “nagiosadmin”.
$ htpasswd -s -c /usr/local/nagios/etc/htpasswd.users nagiosadmin
Step 5 – Setting an email for sending alerts
To set an email to receive alerts, open:
$ vi /usr/local/Nagios/etc/objects/contacts.cfg
and enter an email address.
Step 6 – Installing the Nagios plugins
Now, it’s time to install Nagios plugins.
$ cd nagios-plugins-2.1.4/
$ ./configure - -with-nagios-user=nagios --with-nagios-group=nagios
$ make
$ make install
Step 7 – Verifying Nagios files
In the last step of the Nagios server installation, we will verify the Nagios configuration file against a sample configuration file to make sure all the settings are okay.
$ /usr/local/nagios/bin/nagios -v /usr/local/nagios/etc/nagios.cfg
If all the settings made are correct you should not receive any errors.
Now restart the Nagios server and httpd server.
$ service nagios restart
$ chkconfig nagios on
$service httpd restart
$ chkconfig httpd on
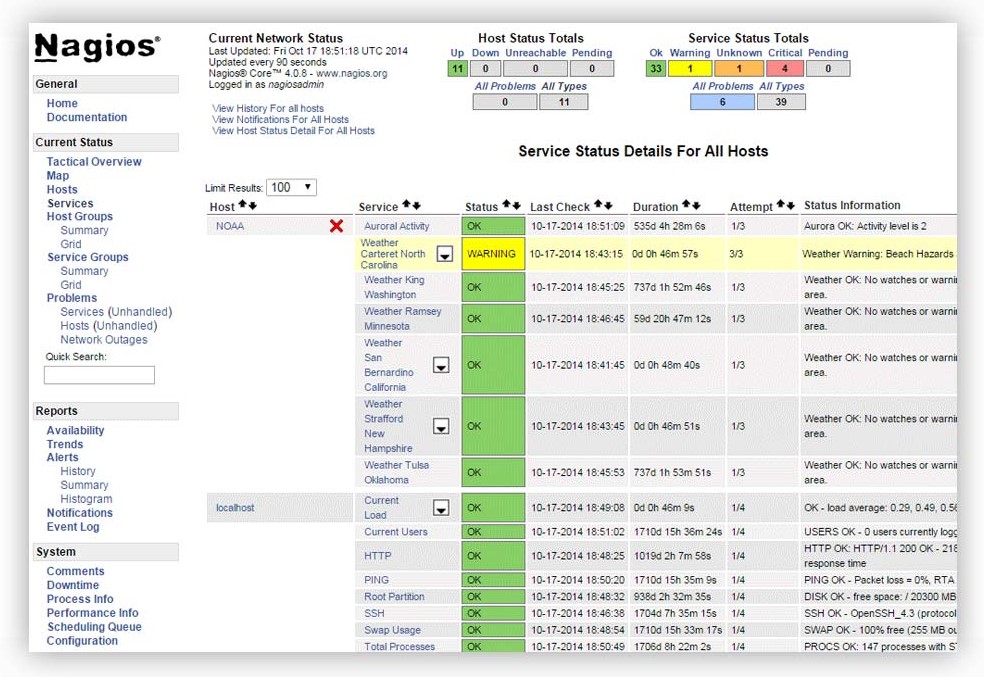
Step 8 – Logging into the web interface
Open your browser and enter http://localhost/Nagios or http://IP-address/Nagios in your address bar and you will be asked to enter the username and password. Upon entering the credentials, you can now see your Nagios Web interface.
Conclusion
Any company that needs its system to be monitored reliably should seriously consider Nagios as an option. If your group has never used the program before, you may want to investigate installing Nagios Core for free and putting it through its paces to see what it is capable of. After a few weeks of playing Core, you will have a better idea of whether or not the team needs XI. In either case, the way you monitor your IT will see significant improvements.
Nagios Core FAQs
What types of devices can be monitored using Nagios Core?
Nagios Core can be used to monitor a wide range of devices, including servers, switches, routers, and printers.
What types of information can be monitored using Nagios Core?
Information that can be monitored using Nagios Core includes network traffic, device uptime, CPU and memory usage, and application availability.
How does Nagios Core work?
Nagios Core works by using plugins to collect information about devices and applications and then using that information to generate alerts and reports.
What are Nagios plugins?
Nagios plugins are scripts that collect information about devices and applications, such as CPU usage or disk space, and return that information to Nagios Core.
What are Nagios configurations?
Nagios configurations are files used to define devices, services, and other monitoring settings in Nagios Core.
What types of alerts can be generated by Nagios Core?
Alerts generated by Nagios Core can include email notifications, SMS notifications, and audible alerts.
What are some common Nagios Core plugins?
Common Nagios Core plugins include check_ping, check_cpu, and check_disk.
What are some common Nagios Core configurations?
Common Nagios Core configurations include defining hosts and services to be monitored, setting alert thresholds, and configuring notifications.
What are some benefits of using Nagios Core?
Benefits of using Nagios Core include improved network visibility and reliability, faster problem resolution, and improved resource utilization.
What are some common alternatives to Nagios Core?
Common alternatives to Nagios Core include Zabbix, PRTG Network Monitor, and SolarWinds Network Performance Monitor.