ManageEngine Applications Manager (APM) is designed to keep essential applications running at peak efficiency in all situations. Datadog is a monitoring service for cloud apps, servers, databases, tools, and services that is located on-premises and in the cloud and uses agents to monitor the infrastructure.
In this article, we will discuss ManageEngine and Datadog along with the comparison between these two to make a decision on which software you should go for.
ManageEngine APM
Enterprise-ready, comprehensive application and server performance monitoring solution provides in-depth visibility into the performance of applications and infrastructure components, including the ability to detect, diagnose, and fix problems with network performance. It has been honored as a 2020 Gartner Peer Insights Customers’ Choice for simultaneously monitoring IT infrastructure and application performance.
ManageEngine APM is an agentless tool that can run on operating systems based on either Windows or Linux. To discover and draw up application topology, it makes use of auto-discovery mechanisms.
Key Features
- The monitoring of web applications Byte-code instrumentation allows for the monitoring, optimization, and troubleshooting of application performance.
- The REST APIs that come packaged with ManageEngine Applications Manager can be called upon to retrieve data for use in internal portals and other monitoring tools.
- Application Analytics includes, among other types of reports, performance reports, trend analysis reports, capacity planning reports, and forecasts that are enabled by machine learning. Additionally enables the production of individualized reports.
- Monitoring of artificially created transactions. Track the experience of the end user from several different geographic regions.
- Multi-cloud monitoring obtains visibility into the resources located in your private cloud, public cloud, and hybrid cloud.
- Keeping an eye on the server Monitor the health of servers and investigate performance problems in both virtual and physical environments, as well as in the cloud.
- ERP monitoring enhances the overall performance of your ERP systems while maintaining their availability (SAP, Oracle EBS, Microsoft Dynamics, etc.)
- Application Discovery and Dependency Mapping: Quickly acquire a full understanding of your intricate information technology architecture by discovering your applications with the click of a mouse and effortlessly mapping the links between them.
There are three different editions of ManageEngine APM available to choose from: the free edition, the professional edition, and the enterprise edition. The Free edition offers the majority of the features found in the Professional edition, albeit with a few limitations, and can support as many as five displays at once.
The Professional edition is geared toward small and medium-sized businesses that want to monitor up to 500 apps based on load. It contains monitoring, alerting, and reporting functions. Last but not least, the Enterprise edition targets large businesses that need to monitor 500 or more applications. In addition to the features found in the Professional edition, this edition also provides distributed monitoring and failover capabilities.
You can download a free trial that lasts for a full month. You have the option of installing either the Professional or the Enterprise version throughout the installation process. When the trial period is over, it will immediately switch to the free version, regardless of whether or not you have a valid license.
Datadog
According to the 2021 Gartner Magic Quadrant for Application Performance Monitoring, it is positioned as a Leader. Through a unified user interface, it gives IT operations teams and developers real-time visibility into the whole technology infrastructure.
Datadog makes use of its auto-discovery service to investigate and recognize the many devices that are present in your network. The results of the auto-discovery service are subsequently utilized in the production of a device inventory, which serves as an index for the overall monitoring service.
After every device and link in the network has been mapped out, you will be able to get an overall view of all network activity from the Datadog dashboard. A network topology map is also generated by the service, which may be consulted to obtain concise information regarding each node. Any changes that are made to the network can be detected automatically.
This allows for the network inventory and topology map to be adjusted without any intervention from a human being. The Datadog tool has tools for analyzing traffic flow that allows you to investigate each device and link to determine their entire capacity and level of consumption. You will be able to determine which applications or endpoints contribute the most traffic to your network by using the analytic features.
Key Features
- Keeping an eye on the network Provides businesses with the ability to view the flow of traffic in cloud-native systems and assess performance using tags that are meaningful and easy to grasp.
- Provides deep visibility into application performance and code efficiency so that you can monitor and improve your stack at any scale and give your users the best possible digital experience. Datadog APM gives you this deep visibility into application performance and code efficiency.
- The APM and distributed tracing features of Datadog are fully linked with the rest of the platform, providing you with a comprehensive context from which to diagnose and resolve problems in real-time.
- The Service Map will automatically break down your application into all of its services and dependencies to provide you with real-time visualization of its architecture.
- Management of the performance of applications performs monitoring and troubleshooting tasks, as well as optimization of application performance.
- Users are given the ability to search, quickly filter, and analyze logs for troubleshooting and data analysis.
- Synthetics tests make use of an easy-to-use web recorder to proactively monitor the end-to-end user experience.
- Alerts businesses can develop bespoke warnings for every metric or performance issue. Notifications are offered by email, PagerDuty, Slack, etc.
- The program can collect data and events by integrating with a variety of different products and development stacks.
- Datadog is used by organizations of all sizes and in a wide variety of industries to enable digital transformation and cloud migration; to drive collaboration among development, operations, security, and business teams; to accelerate time to market for applications; to reduce time to problem resolution; to secure applications and infrastructure; to understand user behavior, and to track key business metrics.
- Dashboards Companies can monitor and visualize real-time metrics and events with the assistance of high-resolution interactive dashboards.
- Collaboration Tools that offer visibility across teams by enabling users to mark changes, record problems, and communication, and have concerns discussed in the context of production data.
- Programming interface for application systems (API) API access enables businesses to more effectively monitor their apps and infrastructure by enabling the collection of events and metrics through the use of client libraries.
You can download a free trial version that gives you access to all of the features for 14 days. After that, the software is typically sold through recurring monthly payment plans that are based on the number of hosts, events, or logs.
ManageEngine APM Vs. Datadog: Comparison
| Attribute | ManageEngine APM | Datadog |
|---|---|---|
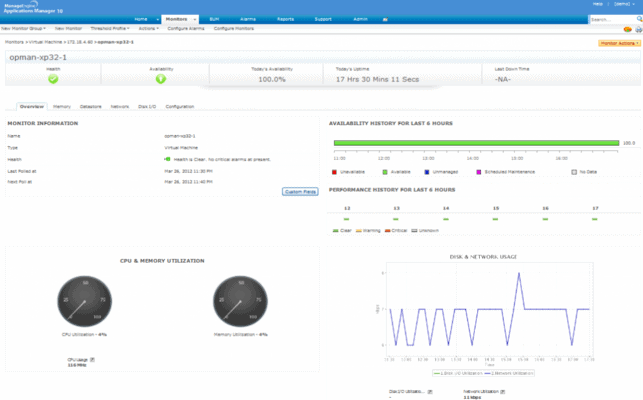
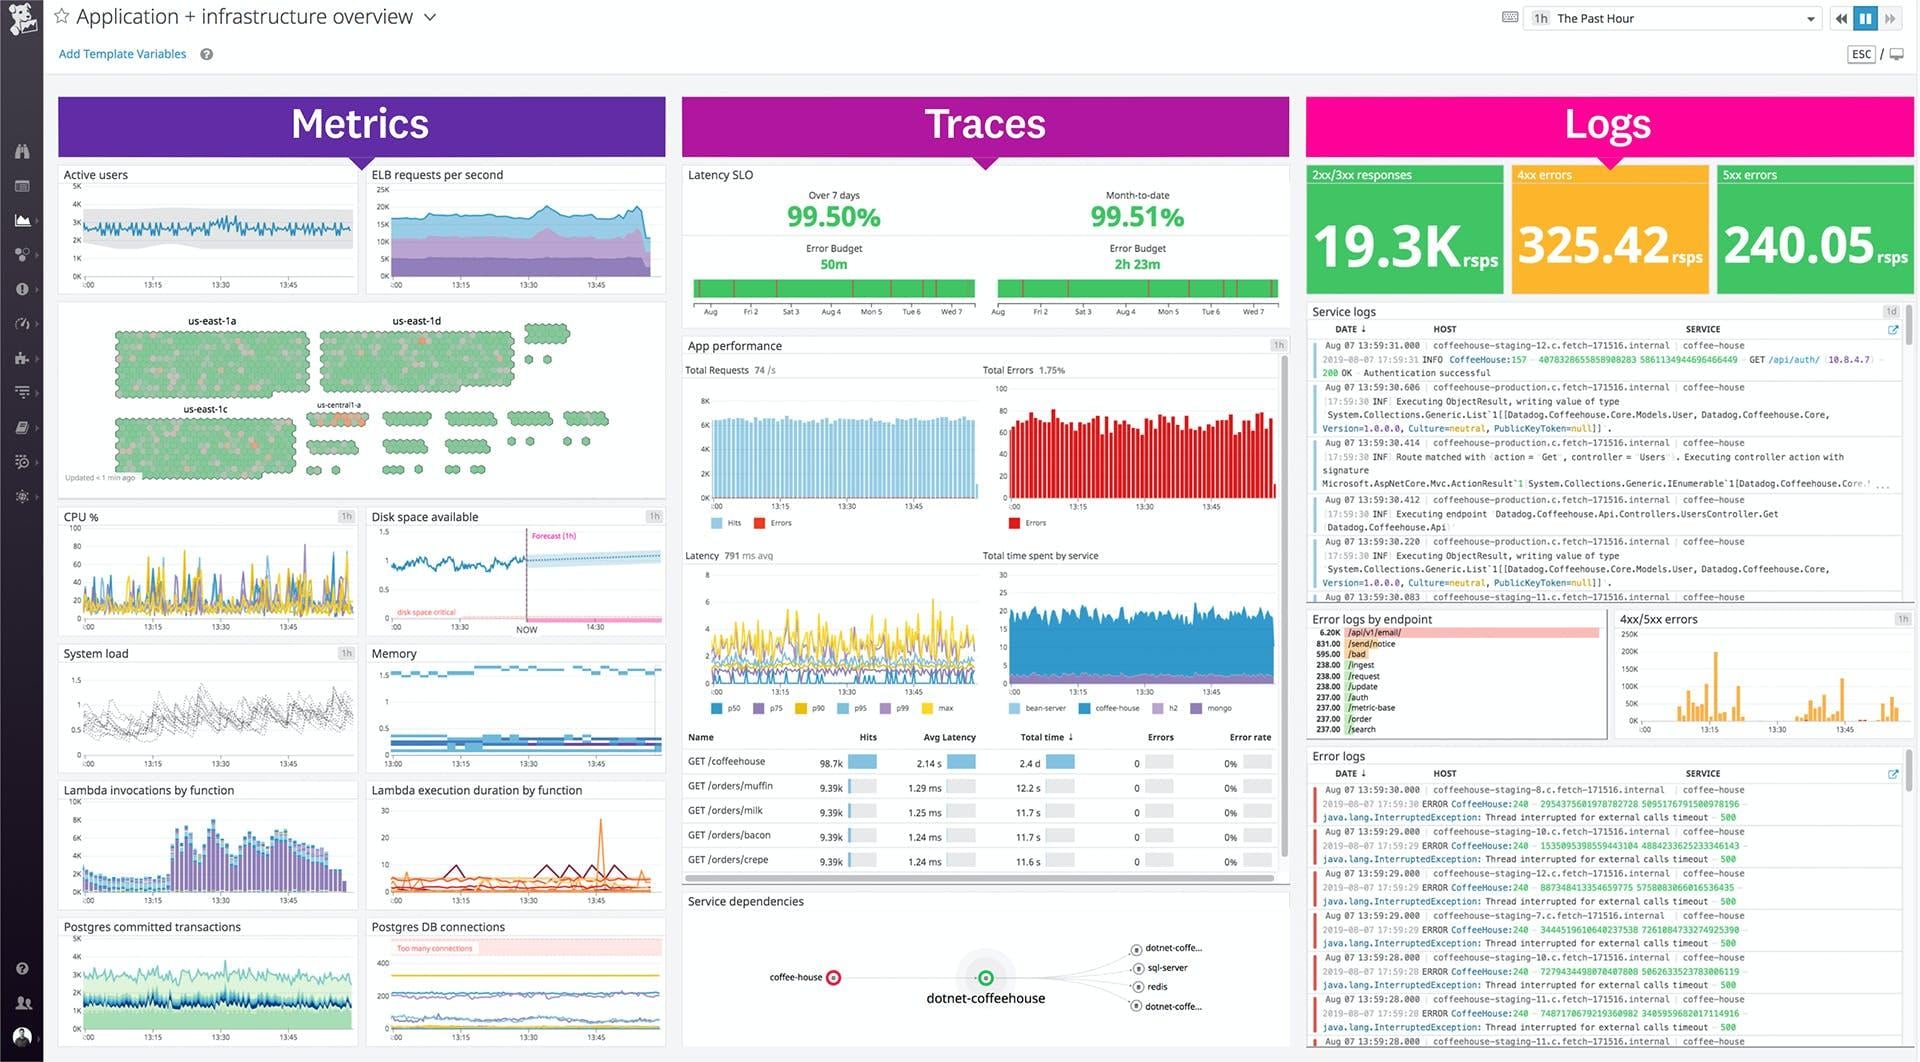
| DASHBOARD | ManageEngine APM gives you the ability to view your entire IT infrastructure within a single dashboard that is highly configurable and packed with a variety of features and graphical representations of data. It includes the Default Dashboard, Business View, Availability, and QoS Worldwide Dashboards in its standard configuration. It utilizes a browser-based interface that is contemporary, albeit appearing fairly cluttered at times. Consequently, navigating the site may first provide some challenges due to the large number of choices that must be taken into consideration. Despite this, ManageEngine APM is still deemed visually appealing from an aesthetic point of view. It is also quite simple to use the drag-and-drop tools that are provided to construct your bespoke maps. | The dashboard design of Datadog is straightforward and contemporary, making it visually pleasant from a visual point of view as well. In addition, Datadog gives you the ability to personalize your dashboards by providing a huge library of visualization tools and widgets that can be dragged and dropped into place. However, to get everything functioning properly, a significant amount of preparatory work is required. |
| APIs & REPORTS | The ManageEngine APM reporting module gives you the ability to generate and export reports directly from the application. The reports that are generated provide an overview of the availability, health, reaction time, and application alerts that occurred over a given period. Because the reports are generated dynamically, you will only be able to view reports for those monitors that you have personally created in the APM. You can either pre-schedule the running of reports at certain times or run them ad hoc using the date and time constraints that are relevant to your needs. ManageEngine APM offers REST APIs, which make it easier to integrate the product with a variety of internal portals and other monitoring solutions. The reporting feature of ManageEngine APM will be empowering for those in charge of managing a network. | The approach that Datadog takes to reporting does not generate the typical out-of-the-box reports that the vast majority of network administrators anticipate. Instead, it strives to make metrics easily searchable, which it accomplishes quite well. Even though some network administrators favor the wonderful old well-prepared fixed PDF report, others do not need it at all. As a result, Datadog also comes pre-packaged with an easy-to-use API that has the potential to considerably broaden the scope of the metrics that Datadog can measure. |
| NOTIFICATIONS | ManageEngine APM makes use of AIOps technology, which combines machine learning and big data, to produce intelligent alarms. As a result, you will be able to prevent alert storms and get to the bottom of problems more quickly. | Similarly, the method that Datadog employs for generating warnings and notifications is known as Watchdog and is based on machine learning (ML). Watchdog can find faults in your infrastructure, apps, and services by making use of machine learning techniques, and it can also report anomalies. In Datadog, these notifications are referred to as Monitors. |
| PRICING | The pricing options for the APM are determined by the number of users and the number of monitors that will access the various reports and dashboards contained in the APM. It is necessary to have a monitor for each application, server, and service that is being monitored. In addition, you have the choice between purchasing subscriptions for a permanent license or an annual license. The payments for support and maintenance are already included in the annual subscription price. The licensing and pricing plan of ManageEngine APM makes it an excellent choice for businesses that prioritize getting good value for the money they spend. | Datadog's cost is calculated on a per-server, per-month basis, and the service is free for up to 5 hosts (with 1-day data retention). However, some clients have voiced concerns that it becomes more expensive with more usage. As a direct consequence of this, Datadog is offered at a variety of various price points. |
Conclusion
ManageEngine APM is a feature-rich solution that can meet the needs of small to large businesses. It’s cost and flexibility make it valuable. The program’s ability to scale from simple to complex configurations is a powerful feature. Some customers have expressed dissatisfaction with the product upgrading procedure, saying it was difficult to complete or caused system complications. Rapid response from product support usually fixes issues. Other than one issue, this bundle is solid. ManageEngine Application Performance Manager is a great tool for managing applications and business services.
Datadog’s SaaS model is ideal for firms that don’t want to adopt a resource-intensive on-premise monitoring solution. This tool’s comprehensive range of capabilities makes it excellent for service-oriented organizations, SMBs, and smaller networks without expert IT staff. Datadog’s agent-based technique may be inconvenient for larger networks with remote locations since each agent must be installed manually. After agent installation and configuration, Datadog is an excellent network monitoring and infrastructure management tool.