In the networking world, you may have heard the terms ‘jitter’ and ‘latency’ used interchangeably, and wondered what they exactly meant. Both terms are actually quite different, and in this article, we’ll demystify the differences between jitter vs latency.
What exactly is jitter?
Jitter is a term used to describe the difference in latency between packet flow from one client to another. Like latency, jitter is measured in milliseconds and is most impactful to stream audio and video services.
VoIP calls that lose quality for a period of time, or cut in and out could be experiencing jitter. If you’ve ever had your favorite video streaming service sit and buffer or freeze up from time to time, this could also be caused by network jitter.
What is latency?
Latency is the term used to measure the amount of time it takes for data to travel from one endpoint to another. This is measured in milliseconds and many administrators calculate latency numbers by the amount of time the packet takes to reach its round trip destination.
Latency is often referred to as ‘high ping times’ when testing for latency using ping or a similar ICMP tool. Latency can cause delays similar to jitter and is again more noticeable with streaming video, live audio, and online video games.
What are the main differences between jitter vs latency?
Jitter is used to describe the amount of inconsistency in latency across the network, while latency measures the time it takes for data to reach its destination and ultimately make a round trip.
As you can imagine, high latency is a serious problem, but also having inconsistent latency, or jitter, can be just as frustrating. Services such as VoIP and live streaming need to be extra vigilant in combating jitter in order to maintain consistent quality.
How do you monitor network jitter?
Now what we’ve defined what network jitter is, let’s look into how administrators can monitor for jitter, and ultimately fix it. Identifying jitter starts with knowing your network; with that said you’ll need a network monitoring tool to do just that.
Using a network monitor can help you understand the scope and severity of network jitter, and give you deep insight into your network performance. Two standout options are Site24x7 and Paessler PRTG Network Monitor — each offering specialized sensors, customizable alerts, and comprehensive dashboards.
Site24x7 Network Jitter & Latency Monitoring – FREE TRIAL
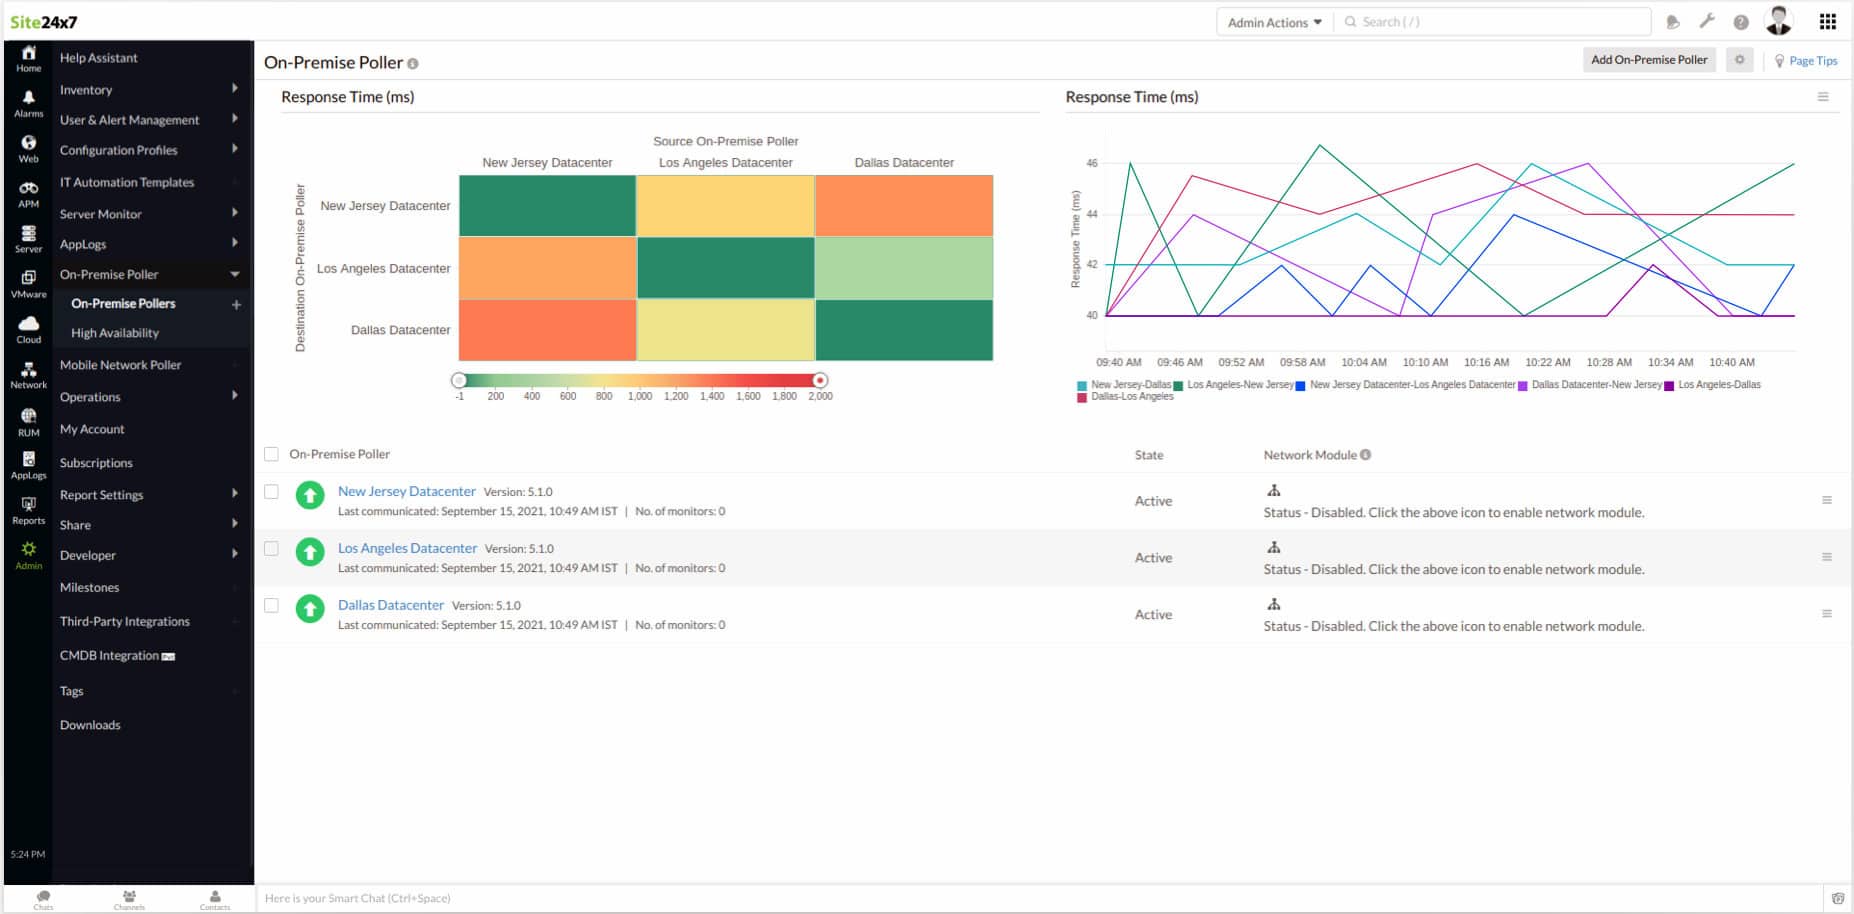
Site24x7 gives you a powerful cloud-native solution for monitoring jitter and latency across hybrid network environments. It’s built on the proven technology of ManageEngine OpManager. It delivers end-to-end visibility through real-time metrics, SNMP-based monitoring, customizable alerting, and traffic flow analysis—all from a unified dashboard.
Key Features:
- Latency Tracking: Monitors round-trip time (RTT) and packet loss across both LAN and WAN. This helps uncover delay sources before they become service issues.
- Jitter Monitoring: Uses Cisco IPSLA to track VoIP jitter and WAN performance. This is especially useful for real-time apps like video calls and conferencing.
- Flow Analysis: Supports NetFlow, sFlow, and IPFIX. These flow protocols give visibility into traffic patterns and potential intrusions.
- Smart Alerts: Customize thresholds and receive alerts via Slack, Teams, or email. It’s flexible enough to reduce noise without missing real issues.
- SLA Reporting: Automatically builds compliance and performance reports on a weekly or monthly schedule. Great for audits and long-term trend reviews.
Why do we Recommend it?
We recommend Site24x7 for various reasons, but when it comes to networking, we believe it is especially useful when you’re monitoring jitter-sensitive services like VoIP or video across hybrid networks. Users love how quickly it integrates into existing environments using SNMP and NetFlow. And that is not all, the alerting options are broad enough to support both small teams and large NOC operations. While actively testing it, the jitter alerts triggered exactly as expected, and SLA reports gave a clear view into what was happening over time.
Who is it recommended for?
Site24x7 Network Monitoring is perfect for various business sizes, users, and industries. To begin with, we strongly believe it is an ideal choice for IT teams in midsize to large enterprises and any organization operating in hybrid infrastructures (cloud + on-premises). Also, it especially valuable in uptime-critical and compliance-driven industries like healthcare, finance, and manufacturing.
Pros:
- Accurate Performance Metrics: Real-time jitter and latency tracking
- End-to-End Visibility: Unified visibility across devices and traffic flows
- Quick Device Setup: Fast setup with SNMP autodiscovery
- Compliance-Ready Reports: Built-in SLA and compliance reporting
Cons:
- Steep Learning Curve: The Interface has a learning curve for new users
- Alert Overload Risk: Too many alerts if thresholds aren’t configured properly
Deployment and Trial Info
Site24x7 supports Windows, Linux, and networking gear from major vendors (Cisco, Juniper, HP, etc.). It uses an agentless, SNMP-based setup with optional flow sensors for deeper insight. A 30-day free trial is available to test and dive deeper.
ManageEngine NetFlow Analyzer Flow-Based Bandwidth & Security Monitoring – FREE TRIAL
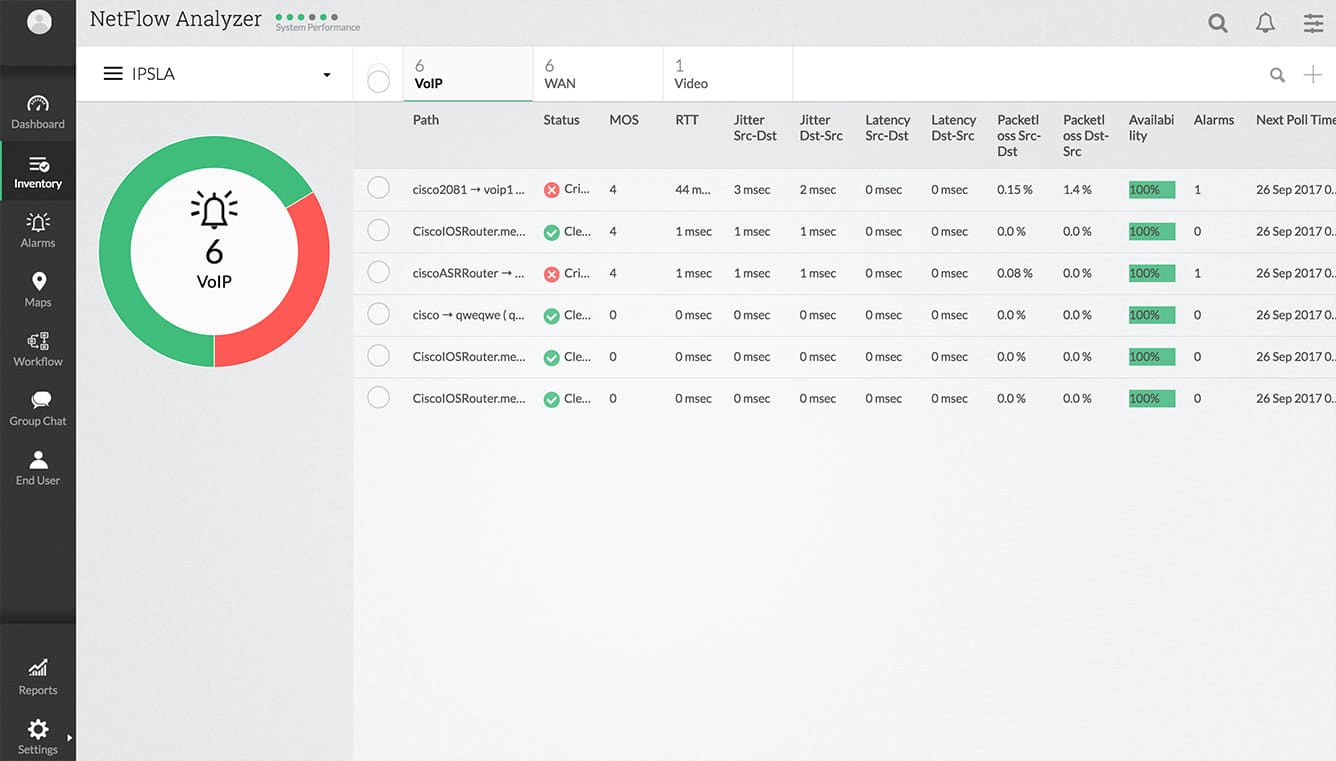
ManageEngine NetFlow Analyzer is Zoho’s flagship network traffic monitoring and bandwidth management solution. It goes beyond simple traffic stats to deliver jitter and latency insights. It also delivers application-level visibility and AI-driven security analytics. Available in different pricing plans, including Standard, Professional, and Enterprise editions. So it adapts to SMBs, mid-size enterprises, and large distributed networks.
Key Features
- Bandwidth Monitoring & Traffic Analysis: Real-time visibility into interfaces, SSIDs, IP groups, and WAN links with drill-down dashboards.
- Application Visibility & QoS: Cisco NBAR integration for Layer 7 monitoring. It also provides CBQoS for performance optimization.
- Network Security & Forensics: ASAM engine for anomaly detection, DDoS identification, insider threat alerts, and Deep Packet Inspection (DPI).
- Capacity Planning & Forecasting: ML-driven growth models and long-term capacity reports.
- Unified Monitoring: Multi-vendor compatibility (Cisco, Juniper, Fortinet, Huawei) with mobile apps and SOC/SIEM integrations.
Why do we Recommend it?
Unlike basic bandwidth monitors, ManageEngine NetFlow Analyzer brings performance optimization and threat detection into a single platform. We recommend this tool when you want to tackle jitter-sensitive issues and improve QoS. It is a fantastic tool if you want to strengthen security without having to manage multiple tools.
It’s also proven in the field. When we actively tested it, we noticed it surfaced root causes of network slowdowns in minutes compared to hours with other alternative tools. We also found the dashboard made bottlenecks obvious without needing packet captures—alerts and thresholds kicked in fast. This felt practical in a real troubleshooting workflow.
Who is it recommended for?
We recommend this solution to enterprises running hybrid or distributed environments. If your organization needs a single-pane view of traffic and anomalies, then NetFlow Analyzer might be worth checking out. It’s also ideal for compliance-heavy industries like finance and healthcare, where both uptime and security matter.
Pros:
- Broad Protocol Support: Supports all major flow technologies
- Smart Analytics: AI/ML-powered forecasting and anomaly detection
- Detailed Forensics: Real-time analysis with traffic drill-down
- Flexible Editions: Modular options to match business size
Cons:
- Outdated UI: Functional but not modernized
Deployment and Trial Info
NetFlow Analyzer is agentless. It supports Windows, Linux, and most networking hardware. The setup is straightforward for SMBs. But enterprises, that is a different story. You may need additional tuning for full distributed visibility. A full 30-day free trial is available for testing.
Monitoring Jitter With PRTG
PRTG has customized sensors you can deploy on your network that will help you identify network jitters. These sensors are:
- Ping Jitter Sensor – Reports jitter based on ping responses across your network.
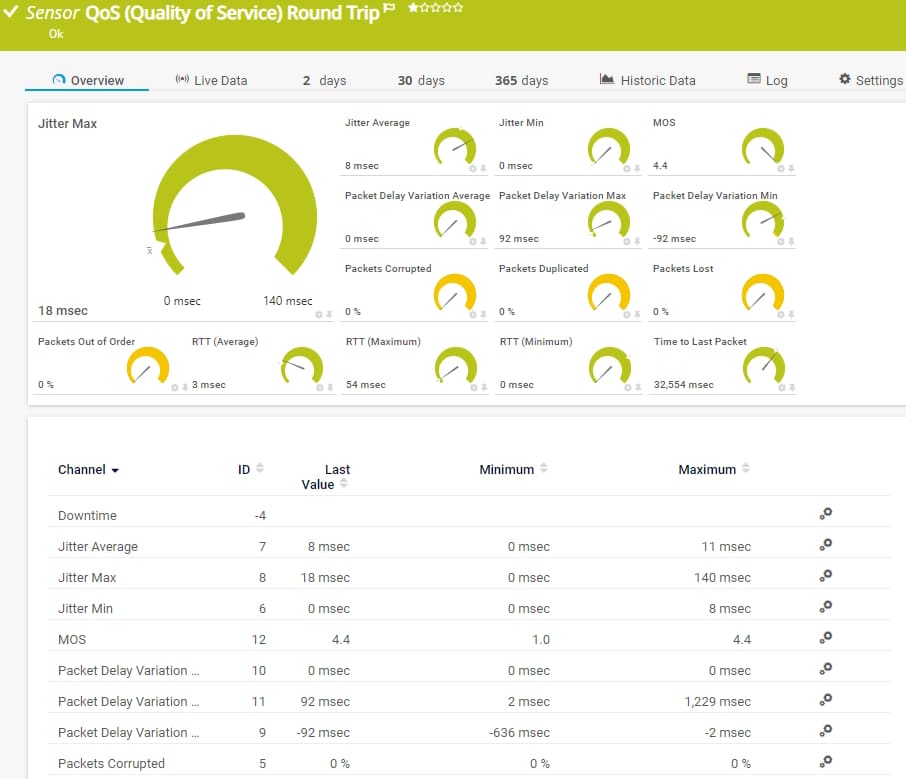
- QoS One Way Sensor – Measures the connection quality between two test probes on the network.
- QoS Round Trip Sensor – Displays an overview of latency, jitter, total packet loss, and a health score based on the overall connection quality across your network.
Each sensor reports the data back to a centralized dashboard that can be viewed by either you or a helpdesk team. These sensors will also give you context and help you know where to start looking for network connectivity issues related to jitter.
A great feature in PRTG is the ability to configure automation based on network conditions. For example, you can set thresholds for amounts of jitter you’ll tolerate on your network or for specific services. If those thresholds are breached, an alert or automation can kick off to either notify the correct staff or attempt to rectify the situation.
The jitter sensors also give you confidence that you’re working in the right direction for a solution. Since latency and jitter have many of the same symptoms it’s common for technical support teams to waste time looking in the wrong places, or trying to fix the symptoms of jitter incorrectly.
You can test out the PRTG network jitter sensor completely free through a 30-day trial.
How do you monitor latency?
Monitoring latency is a bit easier, and there are a number of different tools you can use to monitor latency actively, as well as proactively. Let’s start off with the simplest tool first.
Using Ping
A rudimentary way of monitoring for latency is to simply use the Ping command found in Windows environments in the command prompt tool. This option is a great free way to test for latency and can be set up to monitor certain destinations continuously. For home users or small workgroups, ping can be an adequate way to at least detect the presence of latency.
Businesses and larger networks will want to take a more proactive approach using another tool which we’ll use later. Let’s go over a quick example of how you can measure latency via command prompt.
Press Windows Key +R and type ‘cmd’ in the Run box. Then press Enter.
In the black box, type ping www.google.com -t. This command will test the latency between your machine and Google in the form of milliseconds, abbreviated as ‘ms’. Press Ctrl+C to stop the test.
You can run ping on any IP address or hostname inside or outside your network. For a full guide on how to use command prompt for network testing, check out our article on testing for packet loss in Windows.
Let’s take a look at some more proactive tools for larger networks and business environments.
Monitoring Latency with Paessler PRTG Network Monitor
This next set of tools provide more in-depth and continuous testing across a network for latency. This is beneficial for businesses and ‘always on’ environments that are sensitive to outages and connection quality degradation.
While you can run a continuous ping check across your network, it’s impractical to have a dozen windows up constantly monitoring different services, especially if your customer base or revenue is dependent on the health of your network.
Paessler PRTG Network Monitor is great for both monitoring jitter as well as latency. PRTG is known for having a massive amount of specialized sensors that can monitor dozens of different types of network conditions. With PRTG you’ll use three of these custom sensors to monitor latency:
- Ping Sensor – Pings specific devices and reports their uptime, latency, TTL, and packet loss.
- QoS Round Trip Sensor – Measures the QoS of the entire trip of the packet across the network.
- Cisco IP SLA Sensor – Gathers QoS metrics from Cisco devices. This data can be used and compared to your own SLAs or internal standards in the PRTG dashboard.
Just like jitter sensors, the power behind PRTG comes from its ability to proactively monitor and then alert to breaches or issues with latency in the network. Unlike using the ping command to monitor for latency, you won’t need to physically be present to monitor or record the latency conditions on the network.
PRTG can send alerts when thresholds are exceeded, SLAs are breached, or anomalies are detected. All of this data can then be historically saved and reviewed to help you get a holistic view of the health of your network in terms of both jitter and latency.
Its record is great for reporting, but can also be a vital tool in identifying abnormalities in network conditions. For example, by comparing the historical timeline of latency changes across your network you can match the time change that happened to a helpdesk ticket or hardware swap to track down the culprit that may be causing latency issues.
What causes latency and jitter?
When you’ve identified that you are indeed experiencing network latency or jitter, you might find yourself hitting a brick wall trying to track it down, especially if you’re not using a network monitoring tool. Let’s review some of the most common causes of each issue.
In many cases, jitter and latency are caused by excessive bandwidth usage over the network. Simply put this means too many devices are trying to pull data across the network and it cannot keep up with the amount of data. When bandwidth limits are pushed packets can get queued causing delays, or dropped entirely increasing the amount of jitter you experience.
This is a sign that you may need to upgrade the amount of bandwidth your network has available, or you might need to audit which devices are using the most bandwidth, and what those services are. There are ways to rectify this which we’ll touch on shortly.
Another cause of latency and jitter is the network infrastructure itself. Your weakest point on a network will always be the ultimate determining factor in how a device on the other end receives that data.
For instance, a network could have fiber lines providing internet, but if a PC is receiving that signal through a damaged CAT3 cable, it won’t matter how great your internet service provider is, that machine will still suffer from network issues.
The same principle applies to outdated switches, wireless access points, and any other networking equipment that is distributed across the network. If a single access point has outdated firmware or is experiencing a hardware failure, jitter and latency may occur only for those connected to that specific device.
Taking all of this into account can be challenging, and admittedly only gets more complicated as the network you support grows in size. Once again this is where using a network monitoring tool can save you countless hours of head-scratching trying to identify a bottleneck.
How To Fix Latency
So you’ve identified that your network is experiencing latency; there are a few things you can do to fix this problem depending on where the issue exists.
Upgrade Your Bandwidth
This could be in the form of an internet connection upgrade or upgrading a limiting bottleneck such as an old switch, or physical cable runs that stretch across the network. Sensors in PRTG can help you be certain that the issue is indeed bandwidth-related.
Alternatively, you can use network speed tests to test your bandwidth for services outside of the network to ensure you’re receiving the speed you’re paying for. PRTG can monitor both ends of the network making it a more reliable and less time-consuming method of testing.
Many times bandwidth related issues occur more intensely during certain times of the day. This is due to overutilization during peak hours. Without a monitoring tool, you’ll have to do some investigating work and survey the users on the network.
You may find more users complaining about problems during the afternoon, but notice that the night shift doesn’t report issues. Reading between the lines can help provide context into the issue, and is valuable if you don’t already use a network monitor.
Auditing Device Hardware
While we touched on upgrading outdated hardware sometimes there’s a bit more to troubleshooting than replacement. You’ll want to review any firmware updates that network equipment might have, and apply those updates if issues persist.
Sometimes misconfigurations can delay packets, and cause latency on the network. Ensuring you have Quality of Service or QoS enabled on your router can help the network prioritize which types of packets should have priority. This is especially important for low bandwidth networks and can make a huge difference for VoIP quality and video connections.
Anti Virus
For larger networks that have more in-depth security settings, check to see what types of traffic you’re filtering and if it is related to the latency you’re experiencing.
Features such as Deep Packet Inspection and trap packets can create a queue before they are released. A misconfiguration or faulty update to the security service can easily cause latency especially when the slowness is only experienced across specific services or platforms.
Use A CDN
A Content Delivery Network helps distribute your content across the globe, allowing people to access locally stored versions of that content rather than retrieving it from a single server.
For example, if I hosted a website in the United States, US users would be able to access it more reliably than say someone from New Zealand.
With a CDN I can put a copy of my content on a server in New Zealand to drastically reduce the amount of latency that visitors experience in that region. This copy is known as a cache, and that cache is dynamically updated as changes are made. Some popular CDNs are Cloudflare, Fastly, and CloudFront.
This can help if you have end users that are attempting to access your service over the internet but are experiencing latency issues from different parts of the world.
Fixing Jitter
The fixes for Jitter and latency sometimes tend to overlap, and in some cases stopping jitter issues might be out of your control. You may find that jitter is due to an external source that is not part of your network. At that point, your best bet is to find a different route for your traffic if possible or attempt to reach out to the IT department that manages that node.
Using A Jitter Buffer
A jitter buffer is a component that sits between two endpoints that stops network jitter by holding on to packets and then releasing them for a set amount of time. This guarantees that those packets are released in order and make it to their destination. The trade-off is that the longer you hold those packets, the more latency you’ll experience.
Jitter buffers are common in streaming video and VoIP services. Again you’ll have to weigh your options and figure out what’s more important, a lack of delay in communication, or consistency in the stream of data? These buffers are often deployed when the source of jitter is out of the network owner’s control. The best solution is to identify the actual source of jitter and then fix that problem.
Upgrade Hardware
Just like latency, you may find that old hardware is having issues transmitting data. This can cause inconsistent traffic that impacts both ends of the communication. Old ethernet cables, outdated phones, and slow switches have all been known to be the source of network jitter. Of course, every network is different, and each device between the route will need to be inspected and looked at on its own.
Conclusion
No one likes jitter or latency, but taking the time to understand the differences between both will help you stop them from impacting your network’s performance. There are a handful of tools that can be used to monitor network jitter and latency, but we’ve found that Paessler PRTG provide the best results.
While latency and jitter can be annoying at home, it can cause a drop in productivity and even a loss of revenue in a business setting, so staying on top of it is key.
Have you experienced jitter or latency issues across your network? If so, what was causing the problem? Share your experiences with us in the comments below.
Jitter vs Latency FAQs
How can jitter and latency be measured?
Jitter and latency can be measured using network monitoring tools that analyze packet loss, round-trip time, and other metrics.
What is an acceptable level of jitter and latency?
An acceptable level of jitter and latency depends on the type of network and application being used. For real-time communications such as voice and video, a jitter of less than 30 ms and latency of less than 150 ms is generally acceptable.
How can jitter and latency be reduced?
Jitter and latency can be reduced by optimizing network performance, upgrading network equipment, and using traffic management tools such as Quality of Service (QoS) and traffic shaping.
What is the difference between jitter and latency?
Jitter is the variation in delay between packets of data transmitted over a network, while latency is the time it takes for a packet of data to travel from one point in a network to another. Jitter is measured in milliseconds (ms), while latency is also measured in milliseconds (ms).
What are some common causes of latency in networks?
Common causes of latency in networks include network congestion, high packet loss, and long distances between network devices.
How can jitter and latency impact video conferencing?
High jitter and latency can cause problems during video conferencing, such as choppy video, delays in communication, and poor user experience.
What are some tools for monitoring jitter and latency?
Tools for monitoring jitter and latency include network monitoring software, network packet analyzers, and Quality of Service (QoS) monitoring tools such as PRTG.