The sFlow protocol is utilized for the Host sFlow agent to export both physical and virtual server performance metrics. The agent offers scalable, multi-vendor, multi-operating system performance monitoring while having a minimal impact on the systems that are being monitored.
The Host sFlow project provides an open-source implementation of the sFlow standard, reporting on server performance. Computer vendors are encouraged to simplify the deployment of sFlow by integrating the agent in their products. The combination of host performance data from servers and network performance data from switches provides a complete picture of performance in converged environments.
Now let’s begin this Host sFlow beginner’s guide to see what it provides to the user and how it works in the given section. Alongside, the tools here:
sFlow
The approaches that are currently being used to monitor the performance of servers are extremely diverse. Every operating system, server vendor, and application developer make their agents and software for performance monitoring, and none of these systems are designed to work together.
The problem of scalable, multi-vendor network performance monitoring has been solved. Standards and interoperability are of the utmost significance in the field of networking. The majority of network equipment manufacturers support the sFlow standard and incorporate performance monitoring into their products; this gives network administrators the ability to select from a wide variety of open source and commercial network management applications.
Convergence of networks, virtualization, and cloud computing all serve to blur the lines between system management and network management. For instance, a software virtual switch is utilized to establish a connection between virtual machines and the network. Monitoring the virtual switch requires a sFlow agent running on the server. To understand performance in this environment you need to monitor both network and server resources and the sFlow standard includes physical and virtual server performance metrics.
sFlow provides a common standard for network and system management, reducing the number of tools needed to provide the unified, end-to-end view of performance required to manage converged, virtualized, and cloud data centers. The sFlow protocol is utilized for the Host sFlow agent to export both physical and virtual server performance information. The agent provides scalable, multi-vendor, multi-OS performance monitoring with minimal impact on the systems being monitored.
In addition, the Host sFlow project forms the core of an ecosystem of related projects that extend visibility into the application layer; for example, reporting web server response times, URLs, status codes, etc.
Configuring Host sFlow for Windows
This configuration guide applies to the host sFlow agent installed using the installer hsflowd-win-<version>-x64.msi or hsflowd-win-<version>-x86.msi. The installer will then proceed to configure the service after prompting the user for the necessary configuration parameters. However, it is possible to alter the configuration and set any optional configuration parameters after installation by modifying the registry settings and then restarting the host sFlow service.
This will allow you to change the configuration. The following registry settings are retrieved at startup from the HKLMSYSTEMCurrentControlSetServiceshsflowdParameters key in the registry:
o collector (required unless DNS-SD configuration is enabled; IPv4 or IPv6 address, as well as the hostname, of the computer or device to which sFlow data is to be transmitted. It is possible to define multiple collectors by employing a list of IP addresses or hostnames that are punctuated with commas.
If sFlow is to be sent to a non-standard UDP port, then append “:port” to the end of the IP address or hostname (0 port = 65535); IPv6 addresses need to be enclosed in brackets in this instance. Set the registry entry to 10.0.0.1,10.0.0.2:6344, and [fe80::cabc:c8ff:fe97:ab14]:6344, for instance, in order to transmit sFlow to port 6343 on 10.0.0.1 and port 6344 on 10.0.0.2, as well as port 6344 on fe80::cabc:c8ff:fe97:ab14.
- Sampling Rate: (Windows Server 2012 with Hyper-V Role installed) N where a randomly selected packet from every Nth one that is forwarded by the virtual switch is sampled and exported. Default 400. To deactivate packet sampling, set the value to 0.
- Polling Interval: [optional] The amount of time, in seconds, that passes between the export of counter samples. Default 30. To disable the counter export, set the value to 0.
- Agent Address: (this field is optional) Preferred IPv4 or IPv6 address that the sFlow agent will use to identify itself uniquely. hsflowd will choose an IPv4 address at random from the list of addresses that are associated with the adapters. Utilize this parameter to specify the intended address if doing so results in an unwanted address or the event that an IPv6 address is necessary.
- The “off” or “on” string value for DNSSD is optional. If “on,” hsflowd will ignore the collector settings that are stored in the registry and instead make DNS calls to discover the configuration. See DNS-SD.
- DNSSD Domain (this field is optional) Instruct hsflowd to inquire about the settings for a particular zone (e.g. .noc.mycompany.com). hsflowd will, by default, make an effort to use the local system domain if one is specified. Make use of this parameter only if the system name does not contain a domain or is a domain that is distinct from the required DNS-SD zone.
Distributed Agent for sFlow on Hosts
The sFlow standard employs a distributed push model, in which each host, acting on its initiative, transmits a constant stream of performance data to a sFlow collector located in the center of the system. The push paradigm is very scalable and works extremely well in cloud-based applications.
The sFlow agents that are contained within a host are also part of the distributed architecture. The following figure illustrates how sFlow agent coordination occurs on each host to provide an all-encompassing and uniform view of performance.
In a typical data center, all of the hosts will utilize the same configuration settings for their systems. A centralized point of configuration is offered by the Host sFlow daemon, also known as hsflowd. DNS Service Discover (DNS-SD), which is the method that is utilized by hsflowd by default, is used to understand the configuration values. Alternately, the configuration settings can be distributed using orchestration tools such as Puppet or Chef to change the hsflowd configuration file located at /etc/hsflowd.conf on each host and then restart the daemon.
The hsflowd daemon will save any configuration information to the /etc/hsflowd.auto file after receiving it via DNS-SD or through its configuration file, whichever comes first. When modifications are made to the /etc/hsflowd.auto file, other sFlow agents that are running on the host can automatically detect the changes and apply the configuration settings.
Each agent can function on its own accord thanks to the sFlow protocol, which also enables them to submit an independent stream of metrics to the sFlow collector. The elimination of dependencies and synchronization issues that would otherwise raise the complexity of the agents is made possible by the distribution of monitoring among the agents.
It is the responsibility of each of the sFlow agents to output a unique set of metrics, which are as follows:
- hsflowd When it is being run on a Xen, XenServer, or KVM hypervisor, the Host sFlow daemon will provide performance measurements for the CPU, memory, disk, and network IO. Additionally, it will be able to export information specific to each virtual machine. In addition, monitoring traffic with iptables/LOG is a feature that is supported on Linux platforms.
- Open vSwitch The Open vSwitch is referred to as “the switch that is used by default in XenServer 6.0, the Xen Cloud Platform, and it supports not only Xen but also KVM, Proxmox VE, and VirtualBox. In addition to that, it has been incorporated into a wide variety of virtual management systems, such as OpenStack, openQRM, and OpenNebula.” Enabling the built-in sFlow monitoring on the virtual switch offers the same visibility as sFlow on physical switches and provides a unified end-to-end view of network performance across the physical and virtual infrastructure.
- This is accomplished by providing the same visibility as sFlow on physical switches. The ovs-vsctl command is used to configure sFlow monitoring on the Open vSwitch. This is done with the help of the sflowovsd daemon, which is included with Host sFlow. A similarly integrated sFlow support has also been demonstrated for the Microsoft extensible virtual switch, which will be included in the forthcoming edition of Hyper-V for Windows 8 when it is released.
- Java Performance information regarding Java threads, heap and non-heap memory, garbage collection, compilation, and class loading are exported by the Java sFlow agent.
- httpd An sFlow agent that is incorporated in the web server exports essential performance measures in addition to detailed transaction data. These metrics and data can be used to monitor top URLs, top Referers, top Clients, response times, and so on. There is an implementation of sFlow available at this time for the web servers Apache, NGINX, Tomcat, and node.js; for more information, visit http://host-sflow.sourceforge.net/relatedlinks.php.
- Memcached To monitor hotkeys, missed keys, top clients, and so on, a sFlow agent that is integrated within the Memcache server exports performance metrics together with detailed data on Memcache activities. This data can be utilized to monitor the Memcache server. There is an implementation of sFlow for Memcached that may be found at this time; for further information, visit http://host-sflow.sourceforge.net/relatedlinks.php.
An integrated monitoring system is formed by the agents that are running on each host, as well as the sFlow agents that are embedded within the network infrastructure. This system offers a unified view of the performance of the network, system, storage, and applications, and it can scale up to hundreds of thousands of servers.
Implementation of sFlow Visualization Tools Including Configuration and Use
This section will provide an overview of monitoring and will guide you step-by-step through the configuration of numerous sFlow visualization tools. To install the collectors listed below, you will need a host that runs Linux. The user handbook for your Cumulus Linux switch provides further information that can be read to learn more about configuring sFlow.
Acquiring Knowledge of Monitoring
Monitoring can provide you with significant new insights about your network. There are a variety of tools available, some of which are open source while others are commercial, that can assist you in monitoring the performance of your network’s switches and routers, as well as the traffic that is flowing through your network. The Host sFlow protocol is supported by Cumulus Linux beginning with version 2.1 and continuing forward. To provide a complete picture of your network, Host sFlow can collect data not only on the traffic that is moving through it but also on the metrics and counters that are present on the switches. sFlow is supported by a wide variety of network hardware as well as system operating systems.
To successfully set up sFlow, the two most important components are as follows:
- Putting the hosts in a position
- Putting in place the collection mechanisms
Because switches that run Cumulus Linux are specialized and do not have the storage or processing power necessary to perform admirably in the role of a collector, NVIDIA suggests utilizing a separate server for your sFlow collector rather than relying on the switches themselves. In the user guide, you will find instructions on how to configure your Cumulus Linux switch so that it acts as a collector. While the documentation provided by your server vendor walks you through the process of configuring your server to be a sFlow collector, this article walks you through some common configurations.
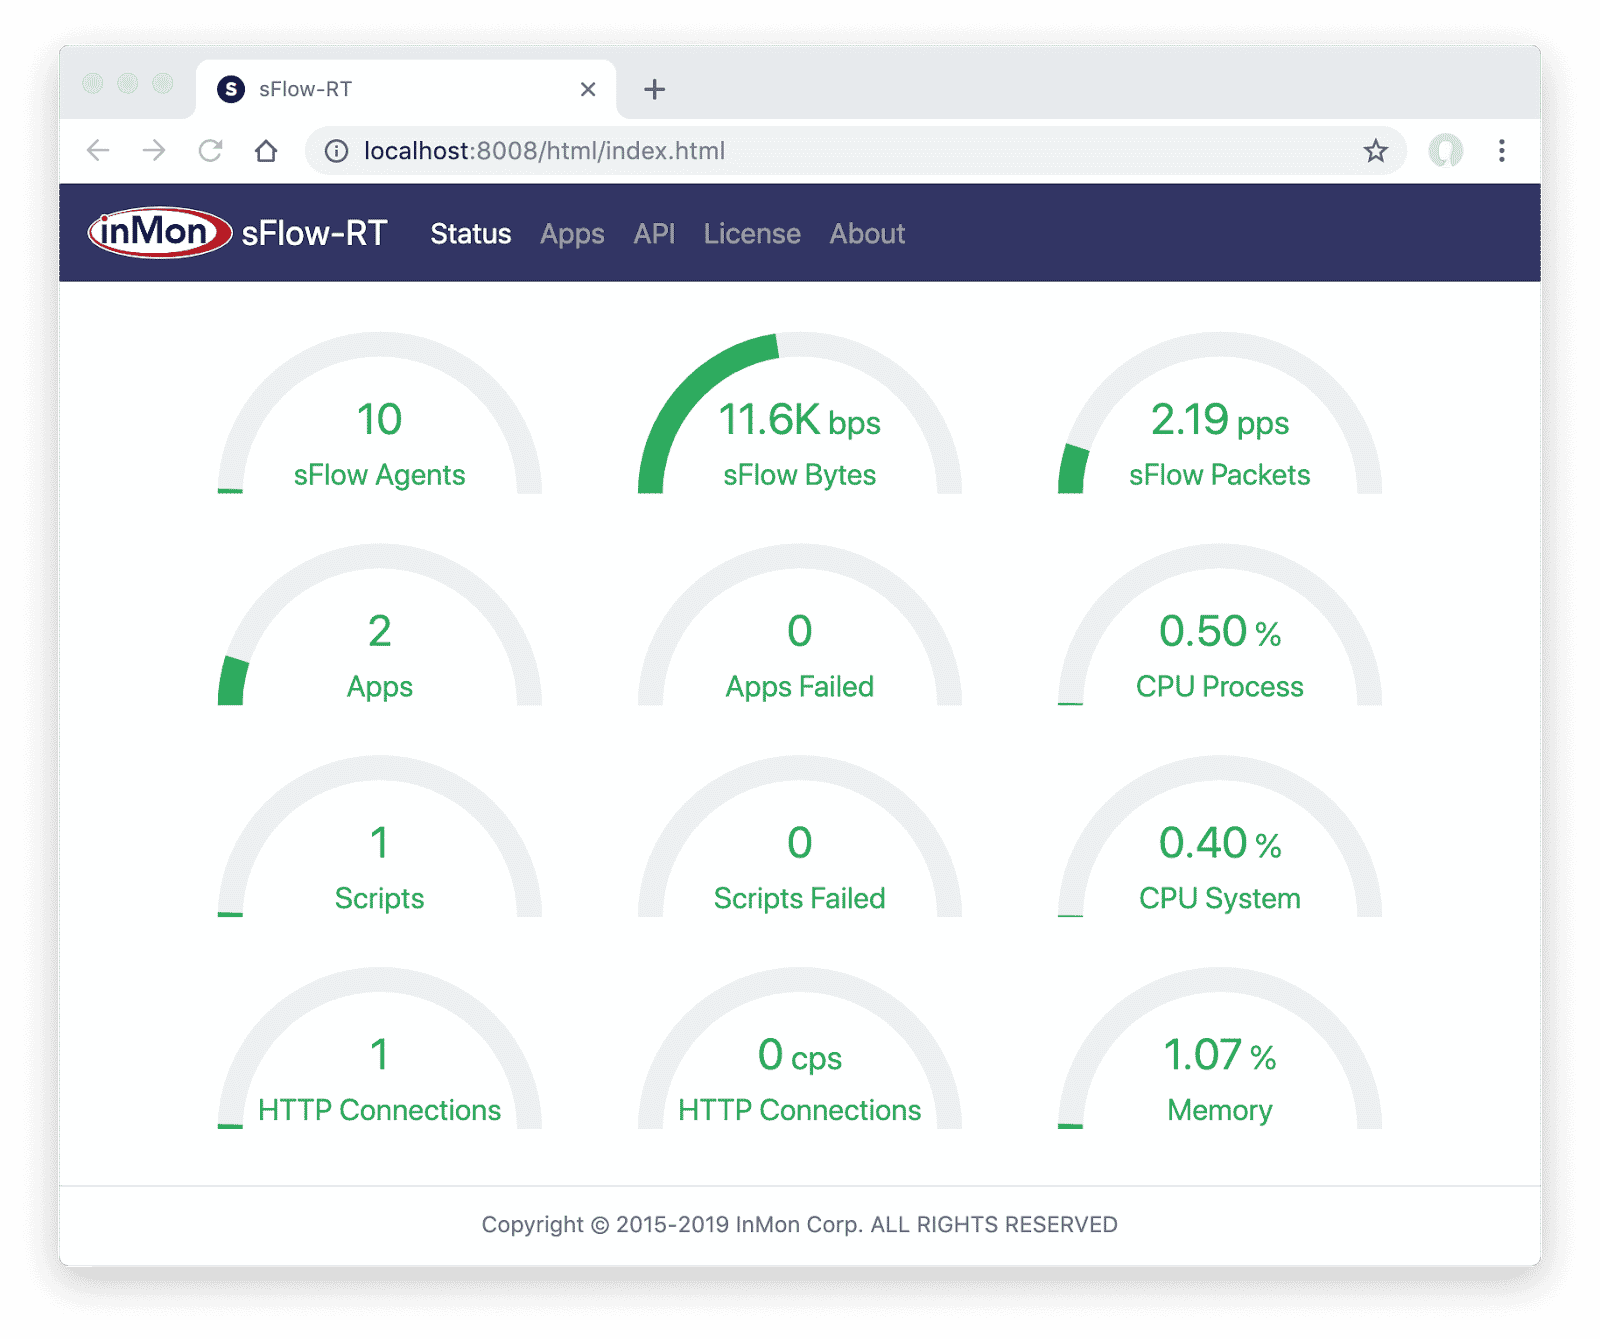
Once your hsflowd daemon begins sending monitoring traffic to your collection’s server, you will have the ability to discover some useful data, such as the top talkers, the interface status, and the top flows.
Leading sFlow Tools
There are a lot of widely used tools for sFlow data. A comprehensive list is available for your perusal right here. With so many tools in the wild, choosing one might depend on your organization’s existing infrastructure and your goals. Because sFlow can send to multiple collectors, you do not need to limit yourself to one tool. Two free, very simple open-source collectors are Wireshark and sflowtool. They are useful for debugging a low bandwidth single flow or for ensuring that your hosts are properly configured and sending sFlow data, but they are not very human-readable.
Due to the huge volume of communication traveling through most switches, a more human-readable format is generally preferred. In addition to this, graphs offer very good visibility. There are a lot of companies that already have monitoring solutions in place for their servers. Ganglia is one of these applications, and it can natively ingest sFlow counter samples and display switch metrics.
Graphite, which is another well-known tool for visualizing system data, has the capability of displaying sFlow data thanks to a script called sflow2graphite. SolarWinds is widely regarded as one of the most effective and well-liked sFlow collectors currently on the market. This application gives you the ability to simply visualize and analyze your network traffic by allowing you to sort, graph, and display data in a variety of different ways. This information can be used to determine which users, applications, and protocols are utilizing the most bandwidth over a specific period. It can also be used to find traffic patterns, which can be utilized to optimize network conditions during times of high use.
Host sFlow FAQs
What is Host sFlow?
Host sFlow is a type of network monitoring technology that allows for the collection and analysis of data from individual servers or hosts within a network.
How does Host sFlow work?
Host sFlow works by installing a software agent on each server or host that collects data on network traffic and other system metrics. This data is then sent to a central monitoring system for analysis.
What types of data can be collected with Host sFlow?
Host sFlow can collect a wide range of data, including network traffic statistics, CPU usage, memory usage, disk I/O, and other system metrics.
What are the benefits of using Host sFlow?
The benefits of using Host sFlow include improved network visibility, better troubleshooting capabilities, and more accurate capacity planning. Host sFlow can also help identify security threats and potential performance issues on individual servers or hosts.
What are some examples of Host sFlow software agents?
There are many different software agents available for Host sFlow, including open-source agents such as Host sFlow Agent for Linux and FreeBSD, and commercial agents such as nProbe and cPacket Networks.
How do I set up Host sFlow on my network?
To set up Host sFlow on your network, you will need to install a software agent on each server or host that you want to monitor, and configure the agent to send data to a central monitoring system. You will also need to configure your network devices to support sFlow traffic, and configure the sFlow collector to receive and analyze the data.
What types of network devices are compatible with Host sFlow?
Host sFlow is compatible with a wide range of network devices, including switches, routers, and firewalls. However, not all network devices support sFlow, so it is important to check device compatibility before implementing Host sFlow on your network.
What is the difference between Host sFlow and traditional sFlow?
Traditional sFlow is a network monitoring technology that collects data on network traffic at the device level, while Host sFlow collects data on individual servers or hosts within the network. Host sFlow provides more granular visibility into system metrics and can help identify performance issues or security threats that may be specific to individual hosts.
Are there any limitations to Host sFlow?
One limitation of Host sFlow is that it can be resource-intensive, particularly on servers with high traffic or complex workloads. Additionally, Host sFlow may not be suitable for all network environments, particularly those with limited bandwidth or limited resources.
What are some best practices for implementing Host sFlow?
Some best practices for implementing Host sFlow include starting with a small pilot project to test the technology, configuring agents and collectors to minimize network overhead, regularly monitoring and analyzing data to identify potential issues, and using the data to inform capacity planning and optimization efforts.