Which one, Graphite or Datadog, is a better choice? Comparing the available Business Intelligence Software products is an effective method for determining which one will serve your company’s needs best when it comes to BI software. The selection of monitoring software is a decision that must be carefully considered because of the significant bearing it will have on the safety and effectiveness of your business. Because of this, it is essential to conduct research on each tool before determining which one is the most suitable for your requirements.
To make this procedure more manageable, we have devised a comparison series, in which we will discuss how two well-known monitoring platforms do when compared to one another. In this piece, we will examine the similarities and differences between Graphite and Datadog.
Graphite
Orbitz Worldwide, Inc., an aggregator that focuses on the travel industry, came up with the idea for Graphite in 2006. Complex Event Processing (CEP) is the name given to the system that comes with the package. This sort of system receives its input from a stream of data and then extracts categories of information, primarily searching for shifts in value. This is an appropriate approach for monitoring indicators like temperature reports or processing activities like throughput rates or utilization levels, for example.
Key Features:
- Team Access
- Advanced data views
- Annotations and Events
- Bug tracking service that DevOps teams can use
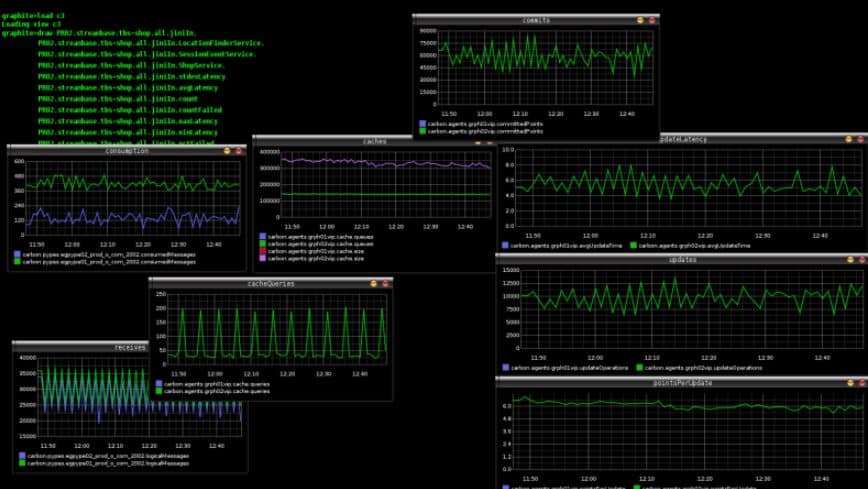
Graphite is a tool for monitoring time-series data that may also be used for recording and charting. This solution gives the IT admin and operations teams the visibility they require to fully comprehend the state of the organization’s apps and devices in terms of their health, behavior, and overall performance. It provides the granular control that these teams require to detect and correct problems before they have an impact on the business as a whole. This enterprise-ready tool works well on both cloud and on-prem infrastructure, which is why Graphite is used by many companies to optimize the performance of their resources like websites and servers.
Datadog
The code for a monitoring system was purchased from Server Density by the founders of Datadog, Inc., and was used by the new company when it began operations in 2010. These founders continue to lead the company; Olivier Pomel serves as CEO, while Alexis Lê-Quôc is the Chief Technology Officer. In 2019, Datadog became a publicly-traded company after listing on NASDAQ. Fifth Avenue serves as the location for the company’s headquarters, which are located in New York City. In addition to these locations, Datadog has a research facility in Paris, France, as well as offices in Boston and Baltimore.
Key Features:
- 80+ turn-key integrations for data aggregation
- Full API access
- Slice and dice graphs and alerts by tags, roles, and more
- Easy-to-use search for hosts, metrics, and tags
Datadog is a service that analyses both your infrastructure and your applications continually. It also monitors your infrastructure. It does this by collecting data on various variables and then evaluating that data in comparison to previously determined benchmarks. If there are deviations, it notifies the relevant user using the channels that they have set. You have the option of expanding this service to just one server or the whole cluster.
Now that you have a general understanding of the two different platforms, it is time to examine how they stack up against one another.
Detailed Comparison
In terms of their capabilities, Graphite and Datadog couldn’t be more different from one another, and the benefits they provide to businesses are also very distinct. Graphite, on the other hand, is more suited for showing time-series data than Datadog, which is a system monitor that completely monitors your organization’s assets. Datadog is an example of this. Frequently, businesses will combine the usage of the two instruments to achieve a greater variety of desirable outcomes. Having stated that, let’s see how drastically different each of these instruments is.
| Data types | Graphite is distinguished by the fact that it may show any kind of data, but the data itself must be organized in the form of a time series. For instance, you might display the performance of the hard drive or the utilization of the CPU in the form of a graph, which would show the data second by second. A graph like this can assist you in locating the spikes and variations, which will make it much simpler for you to determine their underlying causes. On the other hand, Datadog is a great deal more thorough because it presents real-time information on a variety of apps, modules, and devices that are connected to your network. You have the option of seeing all of these indicators in the form of graphs or charts, depending on your style. In addition, the data do not need to be represented in a time-series format and can be done so in any fashion that is desired. |
| Flexibility | This is one of the most significant distinctions between the two tools. You can get Graphite's source code from GitHub, which is another benefit of its open-source nature. This code operates correctly in a wide variety of contexts, including those hosted in the cloud as well as those located on-premises. It is even possible to install it on docker containers, in addition to Mac OS, Linux, and Unix. The developers of Graphite also provide a hosted version of their product, which can be operated on the cloud. When using Datadog, you do not have access to quite so many different versions. Instead, it is only offered as a subscription-based SaaS solution. However, it is a smart decision on its own because there is a significant amount of storage space and the flexibility to put it wherever. In addition, the implementation of the monitoring service will not provide any difficulties for you. |
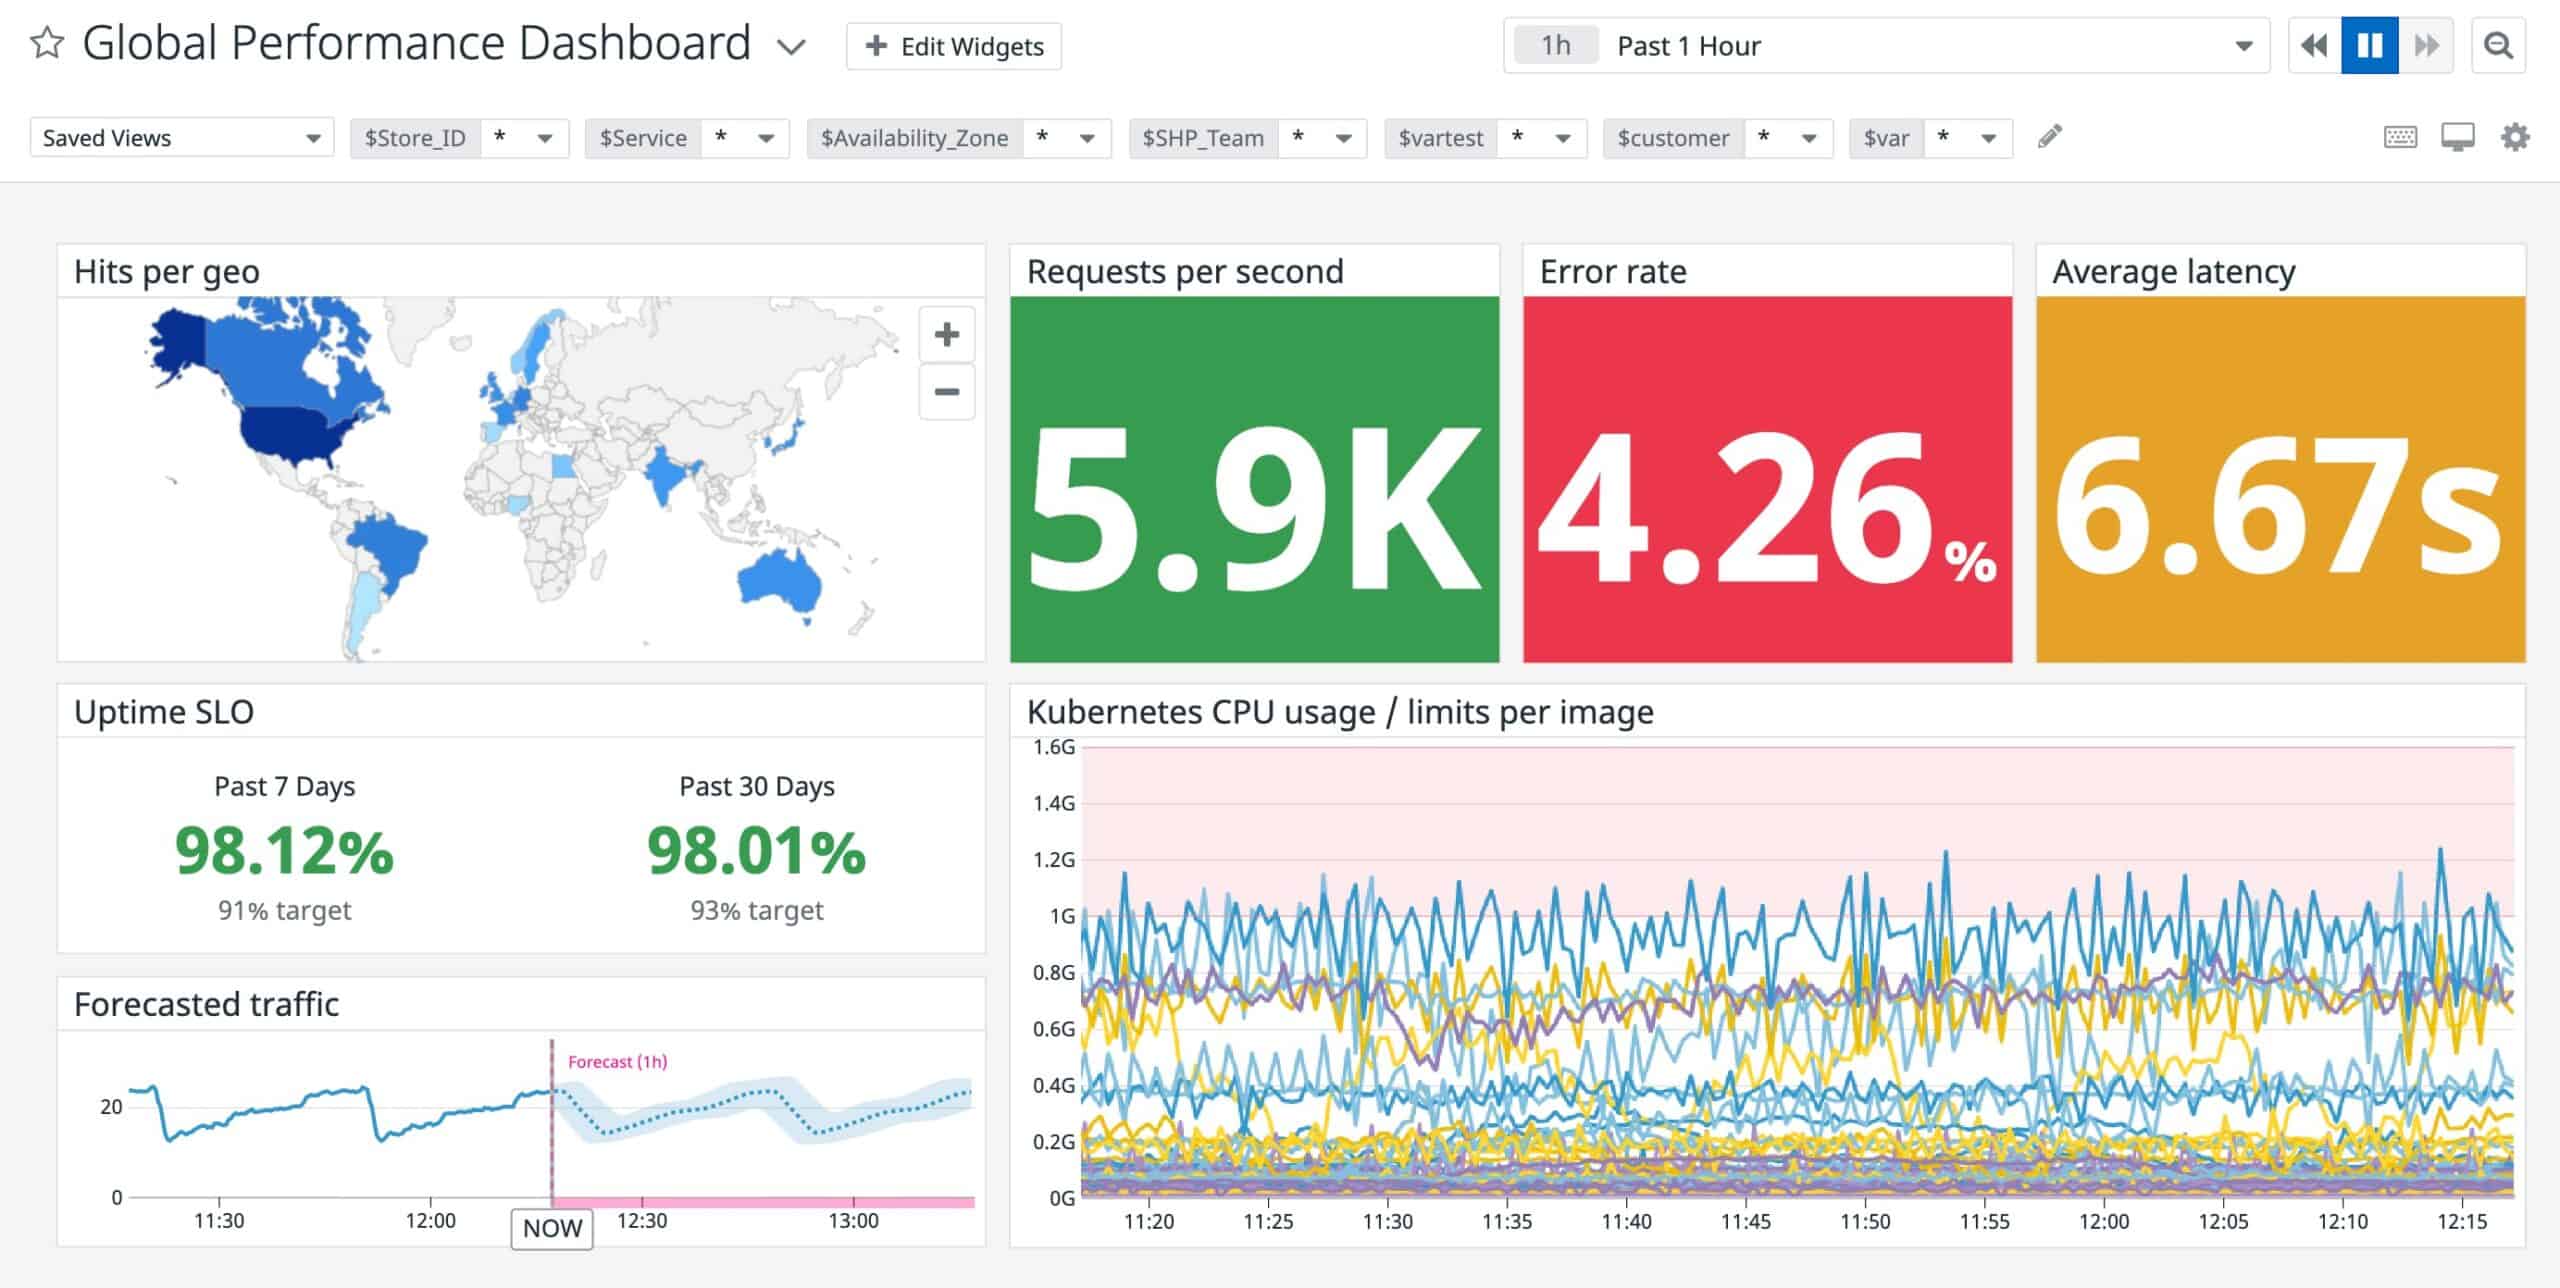
| Interfaces | Graphite Web is the name of the application's user interface. This offers a user interface as well as application programming interfaces that make it possible for other user interfaces to use Graphite as a backend. A composer is made available to users of the Graphite Web system, and it is through this that they may construct display templates. Because of this, you will have the ability to select a variety of data sources and display them using the Graphite Web system. These graphs may be saved in a variety of forms, including pictures, CSV files, XML, and JSON respectively. If you want to view the most recent entry in your time-series data stream, you will need to continually refresh that image and reload a more recent version of it. This is because the system requires you to do so after you have already designed a graph and gotten it to run on a Web page. The Graphite Web service is difficult to utilize in its entirety. It needs you to program your Web pages. MetricFire's Hosted Graphite service makes use of the Grafana system as its front end rather than bothering with the user interface of Graphite Web. Instead, it relies on Graphite's application programming interfaces (APIs). Even if you have the option of using Grafana, you will still need to develop the templates for your website. Because Grafana and Graphite only display graphs, this interface will not provide you with static information such as asset inventory records. Datadog provides a dashboard that instantly provides a set format, displaying graphs and data blended on one screen, and enabling drill-down pathways from overview screens to screens displaying information about particular devices or apps. Datadog also gives a defined format. In addition, the Datadog interface allows for the creation of individualized displays that combine the data sources of the pre-defined screens. Because Datadog also provides application programming interfaces (APIs), if you wish to build your interface from the ground up, you have the option of utilizing Kibana, Grafana, or any other package to represent the monitoring data from Datadog. |
| Functionality | Graphite is only a data receiver that obtains information from other systems and presents it in a time-series manner. This is another significant distinction between the two. Take into consideration that it does not collect data from each system. However, Datadog is a platform that collects data from a variety of endpoints, analyses that data in comparison to a predetermined baseline, and notifies users when there are deviations from the baseline. |
| Automation | Both systems have a certain degree of automation as part of their design, but the objectives of this automation are very different depending on which platform you choose. When it comes to automation, Datadog offers a full solution. It collects data, evaluates that data in comparison to thresholds, and generates alerts if there is a divergence. Datadog will automatically communicate the context along with the alerts that it delivers. This will assist the person who is responsible for addressing the issue. Graphite, on the other hand, is capable of automating the process of data receiving and showing by transforming the data that has been examined into a graphical format. This allows users to better comprehend the patterns that have developed over time. |
Conclusion
To conclude, Graphite and Datadog are often used to monitor devices to understand how they perform over a period. That said, both tools work differently. While Datadog is more comprehensive and monitors different aspects of a device, Graphite receives the data and displays them in a time-series format for easy assimilation. It’s common for organizations to have Datadog for monitoring and analytics and Graphite for viewing this information in a time-series format. Such a combination provides a ton of benefits, as it’s easy to view the performance of a device over a specific period and take the necessary action to address the problems if any.