Graphite is a comprehensive monitoring tool that may be used in either straightforward or intricate settings. It is possible to utilize it for the monitoring of a wide variety of networked systems, such as websites, applications, services, and servers in both on-premises and cloud-based settings. This variety of options is useful for businesses that fall into a variety of categories and sizes.
The purpose of this article is to show how graphite monitoring can assist you in gaining greater visibility into both your application and infrastructure.
What exactly is meant by “Graphite Monitoring”?
In a nutshell, Graphite is a real-time data storage and visualization tool that also collects and displays data in the form of time series. It gives operations teams access to instrumentation, which enables visibility on varying degrees of granularity concerning the mannerisms and behaviors of the system. This ultimately leads to the discovery of errors, their resolution, and ongoing progress. The following elements make up graphite in its natural state.
- Carbon: reads measurements from disk using a storage backend and reads them from the network to generate new metrics.
- Whisper is a database that stores time series using files.
- App for the web written in Django that displays dashboards and graphs.
What properties does Graphite possess?
Graphite is used for two straightforward purposes:
- It saves all of your numeric time-series data in the database that is located in its backend.
- It gives you the ability to query the data, turn them into graphs, or use the data directly using available visualization tools
Utilizing the unencrypted protocol is all that is required to store data in Graphite. Users can quickly execute the command below to store a sample of CPU data:
$ echo “mydata.dummy.cpu 20 ‘date +%s'” | nc “your-host-name” $ echo “mydata.dummy.cpu 20 ‘date +%s'” 2003
The following is the format for the data storage:
<metric-path> <value> <timestamp>
Additionally, alternative means of data transmission, such as the pickle protocol and the AMQP protocol, are supported by Graphite. Read this post for further details if you are interested. One of Graphite’s flaws is that the user interface it offers for metric visualization is quite fundamental. MetricFire and Grafana are two examples of advanced visualization tools that connect well with Graphite backends. MetricFire’s Hosted Graphite provides a solution to the issue of the basic Graphite Web UI by incorporating Grafana into our platform in an automatic fashion.
Graphite by itself may contain several flaws, but these are remedied by applying this remedy. They come with ready-made plugins that may be used to develop cutting-edge control panels and dashboards. If you sign up for our MetricFire free trial, you’ll have immediate access to all of these capabilities, and you can begin exploring them right away.
You are also free to request a demonstration and discuss your monitoring requirements with a member of our staff at any time. If you’re interested in Grafana, you should check out this post on how to make incredible dashboards using it. You will receive access to specialized dashboards when you save all of your data with our hosted solution. Now is the time to sign up for your free trial.
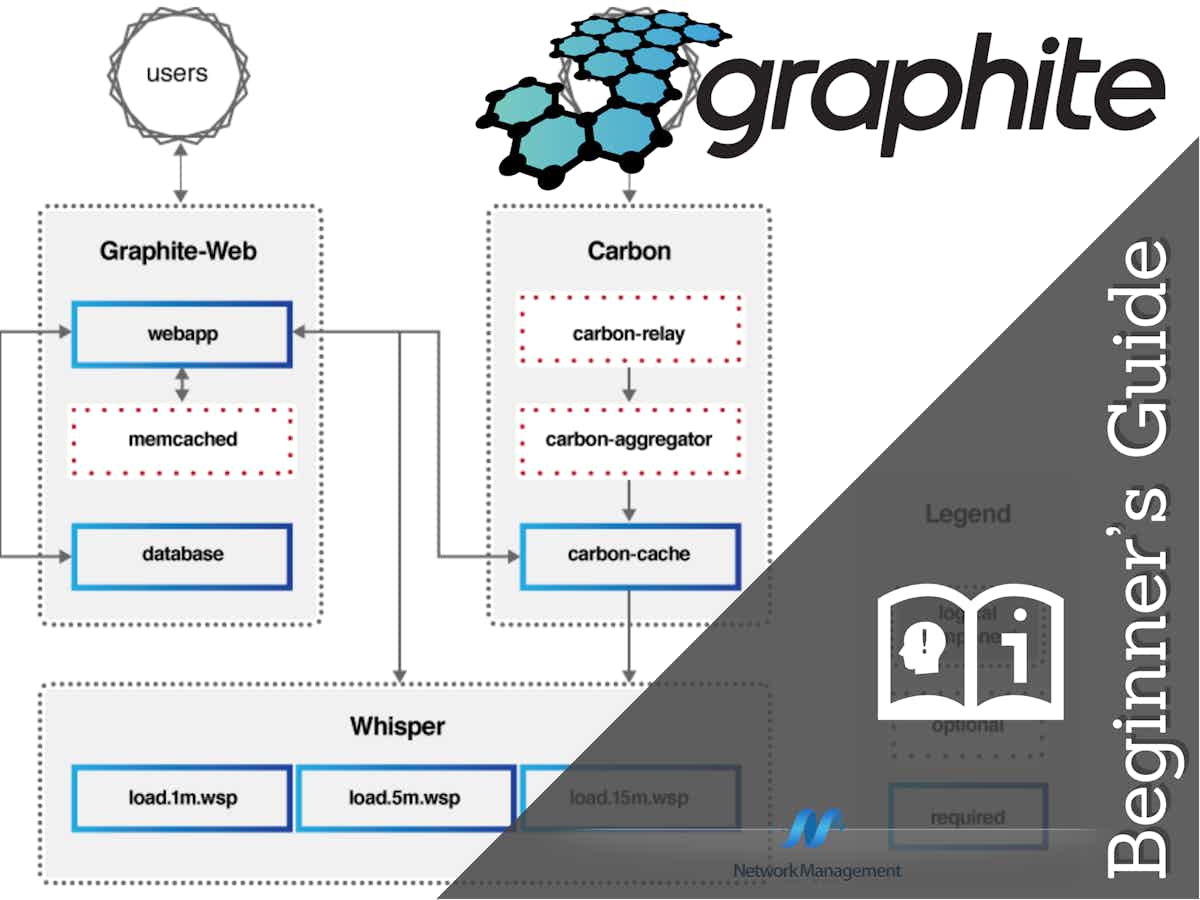
What is Graphite (the components in brief)
Graphite is largely formed of 3 components:
- Carbon is the service that acts as a Listener, cache, aggregator, and relay.
- The whisper database is located on the backend.
- Graphite Webapp – the frontend UI for rendering graphs.
Graphite’s primary constituent is carbon, which gives the material its name. It acts as the primary backend daemon for Graphite and is responsible for listening for any time-series data that is transmitted to Graphite using the permitted protocols. This data is delivered to Carbon, where it is processed according to a predefined set of criteria, and then it is sent on to whisper for storage. Carbon can be broken down into four distinct forms, depending on how it is put to use:
Carbon-cache:
This component reads metric data, stores it in the Whisper database, and stores metric value caches in random access memory (RAM). In addition to this, it offers assistance to the Graphite web app by delivering the results of recently searched data points, which boosts the application’s overall performance.
Carbon-relay:
It is predominantly employed for data replication and shading.
Carbon-aggregator:
Using a variety of aggregation functions, the aggregator is responsible for controlling the granularity of the data. Examples include regular expression patterns for metric names as well as time intervals. Before saving their data in whisper, users have the option to apply various functions on those files first.
Carbon-aggregator-cache:
It reduces the overhead associated with operating two distinct daemons for carbon-cache and carbon-aggregator. Specifically, it caches carbon-aggregator data.
Whisper is a time-series database for Graphite that is quick, relies on files, and offers dependable performance. It generates a single whisper file for each metric that has been saved. Each whisper file has a predefined size, which is established by the number of data points that have been specified by the user in the configuration.
The Graphical User Interface for the backend storage system is referred to as Graphite Webapp. It presents the hierarchy of your metrics as a tree, and users have the option to choose which metrics should be rendered as graphs for visualization. The storage of data and the development of more efficient retrieval methods have always been Graphite’s primary goals from the beginning of the project. To render strong graphs, Graphite is integrated with several different visualization tools such as MetricFire.
What are some possible applications for graphite monitoring?
Data can be collected, forwarded, visualized, and monitored using the extensive variety of integrating tools that Graphite provides. One of the most widely used and well-known of these is Grafana, which belongs to the category of open-source visualization tools. These tools are among the most extensively researched computer systems.
Monitoring time-series data of any form is possible with the help of Graphite, but its most typical applications are for monitoring servers, networks, and applications. Since Graphite may be used to monitor any information that is produced as a time series, some people use it to monitor the activity on their websites, while others use it to monitor the amount of electricity they use. The following lessons can be found on the MetricFire blog if you would like to take a look at some extremely intriguing use-cases:
- Using Graphite to Keep an Eye on Your Raspberry PI
- Utilizing Graphite to Perform Monitoring on a Heroku App
- Utilizing Graphite for Continuous Monitoring of CircleCI
- Putting Graphite in place and configuring it
- How to Setup and Configure Graphite on Ubuntu
What are the drawbacks of using Graphite’s open-source version?
Users continue to notice that Graphite has many of the same problems over and over again. The consumers of the open-source project are unanimous in their assessment that, while being a superb product, there are a few issues with it.
- The Graphite Web UI is not a particularly effective tool for dashboarding. It is not suggested for use as a tool for long-term metrics monitoring even though it is an excellent graphing tool. Your dashboard should be built with Grafana or Hosted Grafana by MetricFire if you want to get the most out of it.
- Problems with sharing among team members and creating team accounts Because the Graphite Web UI does not include a login capability, it is extremely challenging to collaborate with other members of your team. This is yet another bug fix that is provided by Grafana.
- Storage solutions that are native to clusters Whisper is not a storage solution that is native to clusters. Because Whisper stores its data in files, growing it can be challenging. This issue can be remedied by utilizing MetricFire’s Hosted Graphite, which is a storage solution that is native to clusters.
- Data collectors: Using data collectors like StatsD and collectd can be a pain, especially if you require several different collectors for different clients. This is especially true if you need to collect data from a wide variety of sources
- Data aggregation Because Graphite lacks a data labeling or tagging mechanism, it is challenging to extract subgroups from within your measurements and aggregate them separately. Users are given the ability to see more within their data thanks to a new feature offered by MetricFire’s Hosted Graphite. This feature is known as Data Views.
- Scaling: It is well known that graphite manufacturing is notoriously difficult to expand to a greater scale. When monitoring a big production environment using an in-house installation of Graphite, it may be necessary for entire teams of engineers to concentrate their efforts. This is something that can be expensive to do, in addition to being difficult in general.
Hosted Graphite provided by MetricFire
The issues that are plaguing Graphite at the moment can be remedied by utilizing MetricFire’s Hosted Graphite. Because MetricFire’s Hosted Graphite comes with Grafana pre-installed, the product already offers excellent dashboarding capabilities straight out of the box.
- Hosted Graphite provides easy file sharing in addition to team accounts because the web program is entirely account-driven. The number of team members, as well as their ability to share, can be easily increased or decreased.
- MetricFire has developed its own time-series database. This database is native to clusters and was developed specifically for data aggregation. Using a unique feature called Data Views, users are given the ability to view sub-groups that are contained within their metrics.
- MetricFire’s hosted Graphite comes with its unique collector, which is known as the Hosted Graphite Agent. This collector takes the place of all of the other common collectors that Graphite users make use of
- MetricFire’s Hosted Graphite is not the same thing as Graphite, but it does have all of the finest features of open-source Graphite. In addition, it offers a fully serviced hosted platform and improves on the original.
The Process behind Graphite Monitoring
Let’s have a look at how graphite operates now that we’ve gone over what graphite is and the different applications it has.
In this section, I will share my experience installing and setting Graphite on both Ubuntu and CentOS. This will allow me to cover both sides of the Linux ecosystem (the Ubuntu/Debian and CentOS/Red Hat sides, respectively).
Graphite installation on Ubuntu through the use of Synthesize
On a server running Ubuntu that is hosted in the cloud, I installed Graphite. Everything worked out perfectly, although there were a few particular adjustments that needed to be made on my end:
After successfully logging into the cloud environment and installing Ubuntu 14.04 to test the Synthesize script, it was essential for the cloud platform to open a port on the firewall for the data to be transmitted to the dashboard (which should be done in any infrastructure, be it cloud or local). I had to exercise extreme caution so that I would just release the application port and not the entire range.
After that, I utilized Grafana, which was a data collection dashboard that was recommended to me by Graphite. Graphite data can also be sent straight into Sumo Logic if that’s your preference.
The Graphite Operating System Manual Installation on CentOS
Now that Synthesize has been removed from the equation, let’s experiment with manually installing Graphite. When installing by hand, we need to pay close attention to the dependencies that the operating system needs to function normally. To demonstrate how a job might be made more difficult, I chose to work with CentOS and followed the steps that are outlined below.
Updating your operating system (if you haven’t done it already) is the first thing that needs to be done to ensure that it will not result in dependency issues in the future.
The Graphite Operating System Manual Installation on CentOS
Now that Synthesize has been removed from the equation, let’s experiment with manually installing Graphite. When installing by hand, we need to pay close attention to the dependencies that the operating system needs in order to function normally. To demonstrate how a job might be made more difficult, I chose to work with CentOS and followed the steps that are outlined below.
The first requirement for every operating system is to upgrade (if you haven’t already) so that it does not cause dependency problems later.
Clone the source of Graphite Web:
sudo git clone https://github.com/graphite-project/graphite-web.git
Access the Graphite Web folder:
cd /usr/local/src/graphite-web/
Install Graphite Web:
sudo pip install -r /usr/local/src/graphite-web/requirements.txt
sudo python setup.py install
Copy the Carbon configuration file:
sudo cp /opt/graphite/conf/carbon.conf.example /opt/graphite/conf/carbon.conf
Copy the storage schemas configuration file:
sudo cp /opt/graphite/conf/storage-schemas.conf.example /opt/graphite/conf/storage-schemas.conf
Copy the storage aggregation configuration file:
sudo cp /opt/graphite/conf/storage-aggregation.conf.example /opt/graphite/conf/storage-aggregation.conf
Copy the relay rules configuration file:
sudo cp /opt/graphite/conf/relay-rules.conf.example /opt/graphite/conf/relay-rules.conf
Copy the local settings file:
sudo cp /opt/graphite/webapp/graphite/local_settings.py.example /opt/graphite/webapp/graphite/local_settings.py
Copy the Graphite WSGI file:
sudo cp /opt/graphite/conf/graphite.wsgi.example /opt/graphite/conf/graphite.wsgi
Copy the virtual hosts file:
sudo cp /opt/graphite/examples/example-graphite-vhost.conf /etc/httpd/conf.d/graphite.conf
Copy the initi files to /etc/init.d:
sudo cp /usr/local/src/carbon/distro/redhat/init.d/carbon-* /etc/init.d/
Permit to execute the init files:
sudo chmod +x /etc/init.d/carbon-*
Start the Carbon cache:
sudo systemctl start carbon-cache
Enable httpd:
sudo systemctl enable httpd
Start http:
sudo systemctl start httpd
Graphite and Sumo Logic
Since you now have Graphite up and running, you can transmit metrics in a Graphite-formatted stream directly into Sumo Logic. All that is required of you is to configure a collector that is already installed and to link it to a source of metrics. During this webinar, we will guide you through the following steps:
Sources are the environments to which Sumo Logic Collectors connect to get information from your website. It is dependent on the type of Collector that you are utilizing as to how each Source is configured to gather files in a particular manner.
The Sumo Logic Setup Wizard guides you step by step through the configuration procedure. Here you will find directions for installing a new Graphite collector in Linux, as well as instructions for Mac OS and Windows.
A portion of this procedure will establish how your data will be labeled for the _sourceCategory, as well as the protocol and port that you will use to stream data. After that, all that is required to do is configure a Graphite source that the collector can connect to. The procedures necessary to configure your Graphite source can be found here.
Frequently Asked Questions
When it comes to selecting a monitoring tool, an administrator will typically ask numerous questions, the most common of which is how long it takes to deploy the tool. Does this tool address the problems that we are experiencing? Will my staff be able to utilize the product effectively while also grasping its core principles? What kinds of reports are there to choose from? These are the sorts of questions that an administrator has to ask to make the most informed decision about which tool to use. The responses to these questions on graphite can be found below.
How long does it take for Graphite to become fully reconstituted?
Because of an installation script known as Synthesize, configuring and installing Graphite is a straightforward process. In addition, there is a wealth of technical material available on Graphite, which makes it easy to acquire information regarding the tool in a hurry. Synthesize is a script that, in its most basic form, enables the automated installation and configuration of a variety of Graphite components to automate the configuration of Graphite.
Does this tool operate in the environment that I am using it?
Graphite may be configured to work in virtually any environment that could be required to execute it. It can function in the cloud. It utilizes a hybrid infrastructure to function. It is compatible with servers that are hosted locally. In addition, it can function well regardless of the scale of your setting.
Will my staff be able to utilize the product effectively while also grasping its core principles?
If the members of your team can read and interpret, then they will comprehend the fundamentals of the instrument. As was noted before, Graphite comes with in-depth documentation that includes instructions broken down into steps, as well as scripts that may be customized to fit your requirements.
What kinds of reports are there to choose from?
Reports generated by Graphite are comprehensive, well-crafted, and simple to alter. This is helpful because reports are frequently utilized by individuals who are not a part of the technical team, and these individuals need to be able to comprehend the information in a short amount of time. The reports will most frequently be used to validate requests for the purchase of new equipment, as well as for performance measurement and hardware updates.
Conclusion
Graphite can provide support for businesses that have specialized infrastructures, as well as companies that have dedicated teams and complex environments. It is also possible for it to operate well for smaller organizations that have fewer employees and fewer pieces of equipment.
The graphing and monitoring tool known as Graphite is particularly useful for time-series analysis. It has a high degree of configurability and can be set up to monitor any data points over some time.