When reading about system monitoring tools, Grafana is frequently mentioned. You will encounter applications like Prometheus, Graphite, Icinga, and Sensu recommending Grafana as a user interface. Therefore, this is a versatile tool that can interface with many data sources.
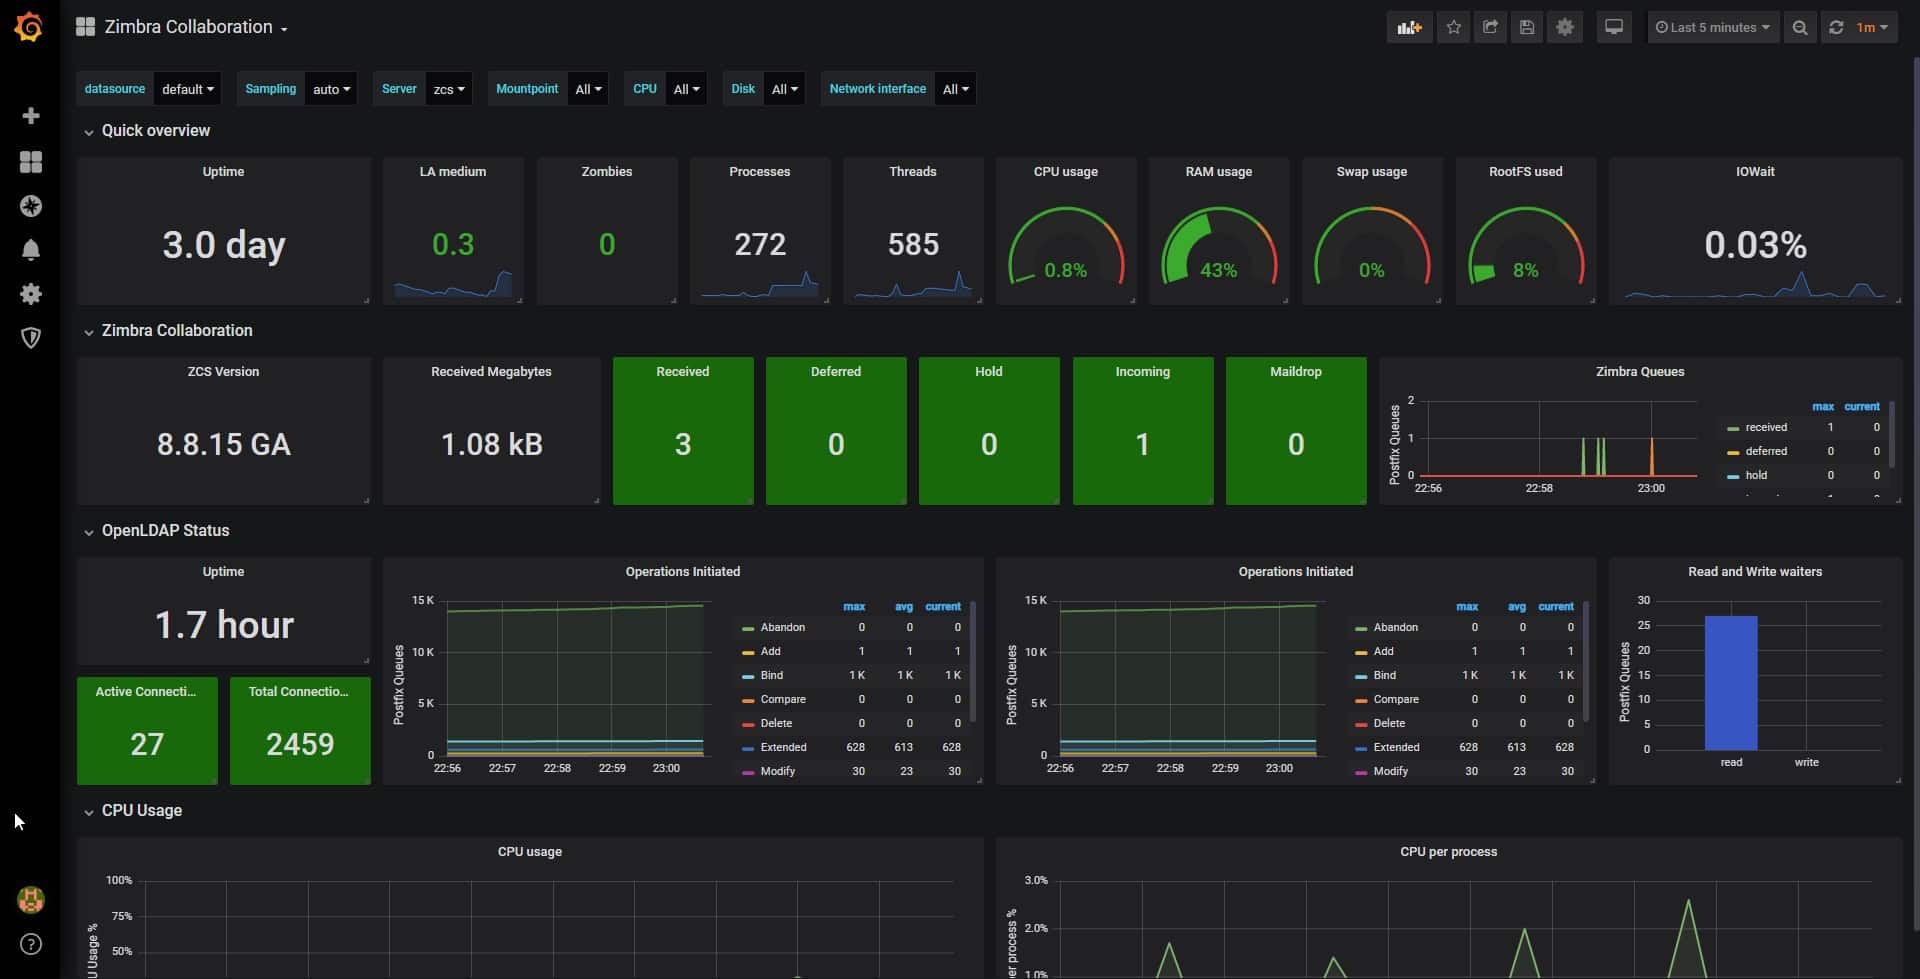
Grafana is more than simply an excellent interface for system monitoring tools. It may also provide a graphical user interface for statistics and market analysis programs. In addition, the package contains query language-facilitated ways for sorting through massive volumes of data.
Key Features:
- Dashboard design template This is a very useful Grafana feature. It allows customers to configure a dashboard to meet their requirements. And these templates do not have hardcoded variables, so if you have a test server and a production server, you may use the same dashboard on both.
- Provisioning Creating a single dashboard may be as simple as clicking, dragging, and dropping, but some users want even more simplicity in a scalable manner. Therefore, Grafana has provisioning so that setup may be automated using a script. Grafana scripts may be written for anything.
- Custom plugins You may expand the functionality of Grafana with plugins that provide additional tools, visualizations, and more. World map Panel (which superimposes data on a map), Zabbix (which interacts with Zabbix metrics), and Influx Admin Panel are popular examples (which enable database creation or lets you add users)
- Alerting and alert hooks Grafana alerts may be issued by several notifiers, such as email, PagerDuty, Slack, and SMS. If they do not function, it is simple to build alert hooks that generate other notifiers.
Grafana is highly similar to Kibana, which is not surprising given that Grafana was constructed using Kibana’s source code. The Kibana system provides a graphical user interface for the Elastic Stack, popularly known as ELK after its three primary components; the K in ELK represents Kibana.
Kibana is an open-source, free-to-use project. Orbitz, a travel industry aggregator, built its own data processing system, Graphite, in 2006. In 2014, the Graphite front-end was rewritten by copying the Kibana source code. This new GUI was separated from the Graphite project to produce a unique offering.
Torkel Odegaard created the initial code for Grafana, basing his work on Kibana version 3. The Grafana system has progressed to version 8.0.3. Orbitz established a separate entity to operate the tool, which is an open-source project. This implies that anyone may obtain the source and create their version, similar to what Orbitz did with the Kibana code.
Grafana Labs is the name of the current operator of Grafana. It continues to maintain and develop the free, open-source version of Grafana, but it now offers two commercial packages with additional functionality. Grafana offers three versions, which are the Community Edition, Grafana Enterprise Stack, and Grafana Cloud. Grafana Cloud is identical to Grafana Enterprise Stack, with the exception that it is hosted as a SaaS platform.
Here is our list of the best Grafana alternatives with in depth reviews below
- Kibana (FREE TOOL) This free graphical front end can be easily adapted to represent any time series data set in charts and graphs. This is the frontend component of the ELK Stack, which is also available in a SaaS package on the cloud for a fee. Runs on Linux and Windows Server. Download for free.
- OpenSearch Dashboards (FREE TOOL) This free tool is a fork of Kibana and it fronts OpenSeearch, which is a fork of Elasticsearch. Runs on Windows, Linux, FreeBSD, Docker, or AWS. Download the free tool.
- Prometheus This free tool can be used as a backend for Grafa but it also has its own dashboard templates. Available for Windows, Linux, and Unix.
- Looker Studio A free graph, presentation, and dashboard creator from Google that can be paired with the Looker BI system or any other data source. Cloud based.
- Geckoboard This dashboard creator lets you assemble a screen by selecting a data source and then a representation type. Hosted in the cloud.
The Best Grafana Alternatives
1. Kibana
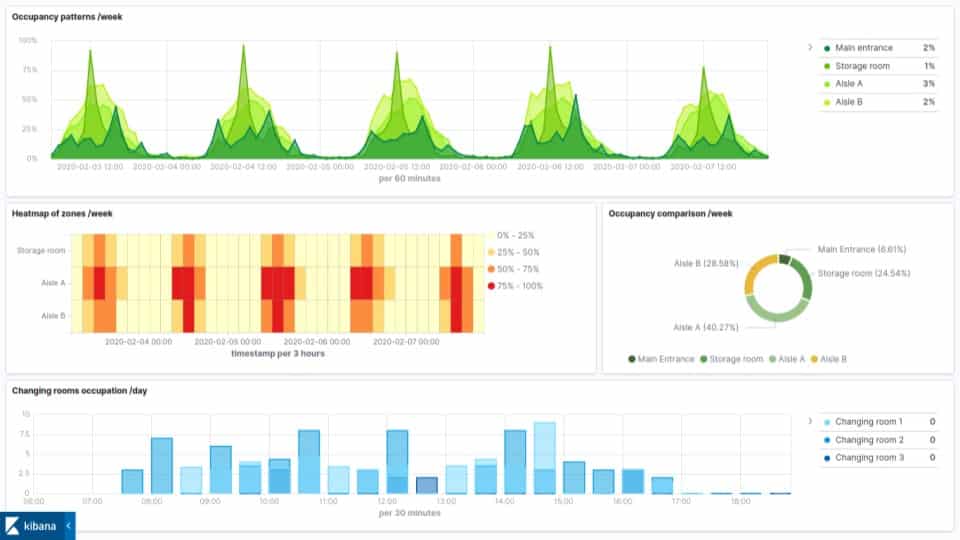
Kibana is an open-source tool for data exploration, navigation, and visualization. It enables you to manage and monitor your Elastic Stack so that you are constantly aware of the status of your company activities.
Key Features:
- Open source Kibana is an open-source platform, meaning that it is free to use and its source code may be seen on GitHub. Therefore, people with sufficient knowledge will have sufficient information to discern how the system operates.
- visualization capabilities Kibana provides users with basic visualization capabilities, such as line graphs, histograms, and pie charts, as well as the opportunity to create their own data graphics. Consequently, the graphical display of data is perfectly tailored to the needs and tastes of the consumers.
- Detection of Problems The system can detect specific difficulties, especially abnormalities concealed in the data, which aids in identifying the underlying cause of problems and locating their remedies.
- Secure data sharing Kibana visualizations and dashboards may be easily shared with coworkers and other individuals by embedding them in web pages or providing the URL to the targeted recipients.
Why do we recommend it?
Kibana is a well-established data visualization tool that lets you create dashboards on any data source. You can create multiple charts and graphs based on different sources and place them all in the same screen. Kibana forms part of the Elastic Stack (ELK) but you can feed any data into it from any third-party tool.
Kibana allows you to do more than produce graphs and similar data representations to visualize your company data. In reality, the solution connects with the Vega grammar so that you may design your fascinating method of displaying statistics.
Moreover, Kibana allows you to investigate the relationships inside your Elasticsearch data. With this information, you may better understand how one element impacts another and the overall health of your firm, allowing you to respond to challenges and problems with more preparedness. The primary advantages of Kibana are its open-source nature, the flexibility to customize visualizations, the graph exploration tools, the capacity to detect anomalies, and the secure exchange of data.
Who is it recommended for?
ELK was first produced as a free system and you can still download all of the components, such as Kibana for free and host it yourself. There is also a hosted Elastic Stack service available. There are many forks of Kibana available and companies such as Sematext and Logit.io also offer hosted ELK implementations.
Pros:
- Part of the Elastic Stack
- Can display data from any data source
- Is able to show live data as it arrives and updates charts
- Free for on-premises use
- Paid hosted ELK option
Cons:
- Doesn’t analyze data
Kibana runs on Windows Server or Linux. You can download it for free. If you want a hosted version, you can get a SaaS package on Elastic Cloud, which includes all of the other ELK tools and is available for a 14-day free trial. The full suite is also available on the marketplaces of AWS, Azure, and Google Cloud Platform – these are subscription services.
2. OpenSearch Dashboards (FREE TOOL)

OpenSearch Dashboards is a frontend creator for OpenSearch. These two tools are forks of Kibana and ElasticSearch respectively. The OpennSearch package is an open source project. You might wonder why you should opt for an imitator of Kibana when you could just get the real thing for free. Some worry that ELK will eventually move to only providing the tools for a fee – Elasticsearch BV put in a lot of work to create their popular tool and they are going to need to recover that cost sooner or later.
Key Features:
- A free, open-source project
- Interface for OpenSearch
- Option to host on AWS
- Can connect to Elasticsearch
Why do we recommend it?
OpenSearch Dashboards is a little-known alternative to Grafana and is particularly close in functionality to Kibana. This system has its own data querying, sorting, and filtering system, which is based on Elasticsearch. The similarity between OpenSearch and Elasticsearch means that you can connect OpenSearch Dashboards to Elasticsearch instead of OpenSearch.
The link to OpenSearch is vital because the Dashboards system isn’t able to receive data directly from applications – other than ElasticSearch. So, you need to use OpenSearch as at least a pass-through for data. The OpenSearch system has plug-ins that ease the transfer of data from applications such as SQL Server databases into the Dashboard.
OpenSearch Dashboard can create screens that show live data with constantly updating charts. This means that you can use the package to make your own monitoring tools. The developers of monitoring tools can choose the type of graph that each data series should be interpreted by and it is also possible to output tables of data. You can calculate alerts in OpenSearch and display them in OpenSearch Dashboards.
Who is it recommended for?
OpenSearch Dashboards can be used to create system performance monitoring packages, security monitoring systems, sales tracking services, and financial analysis displays. It can be time consuming to find activity and financial data dashboards and the ease of use of OpenSearch Dashboards means that it can often be quicker to just build your own tool.
Pros:
- Use to monitor custom applications that out-of-the-box monitoring tools won’t cover
- Create automated activity trackers with alerts
- Use for security monitoring
- Create limited insight screens for access by outside stakeholders
Cons:
- Needs a third-party tool for access rights management
OpenSearch and OpenSearch Dashboard downloads onto Windows, Linux, and FreeBSD. You can run the package on Docker. The system is also available as a service on AWS Marketplace. However, this implementation is only free to use for up to 750 hours per month. Download the software and use it for free.
3. Prometheus

Prometheus is a data processing and analysis tool that partners with Grafana as a front end system. However, there is a dashboard creator in the Prometheus package, so you don’t need to use Grafana. That system is called Prometheus console templates.
Key Features:
- Based on Golang
- Enables dashboards to be created programmatically
- Graphs and charts
Why do we recommend it?
Prometheus is frequently used with Grafana. Many businesses that are looking for an alternative to Grafana because they are unhappy with the service they are currently getting from the package are probably using Prometheus already. However, you probably use Grafana because it is easier to set up than Prometheus console templates
One important point to note, though, is that the Prometheus console templates are based on the Go templating language. So, you would need to be familiar with Golang in order to implement this strategy.
Grafana doesn’t have a data processing function, so it relies on Prometheus to search through data. However, Prometheus relies on connectors to get data. So, using Grafana as a front end requires extracting data from an application, passing it through a pipeline to a connector that reformats the data for Prometheus, which implements data analysis and passes its results to Grafana. This is a long chain and using Prometheus to display data removes one of those stages.
Who is it recommended for?
Prometheus is free to use and it downloads onto Windows, Linux, and Unix. Those facts give the tool a big audience. However, using console templates instead of Grafana is complicated and you would need a Go programmer on staff to do it. So, this solution is suitable for a large company with a skilled DevOps team or a system administrator who can pick up languages quickly.
Pros:
- Enables the creation of highly customized screens
- Attractive for companies that can’t get what they want from the cookie cutter Grafana widgets
- Free to use
Cons:
- Difficult to program
Prometheus is a free tool and you can download it for free to run on Windows, Linux, and a lot of obscure versions of Unix, such as Darwin and Dragonfly.
4. Looker Studio

Looker Studio from Google Cloud is accessible and free to use. The system can be accessed through your Google account. The dashboard creators is linked to a backend data analysis tool, called Looker. This is similar to the relationship between Grafana and Prometheus, Kibana and Elasticsearch, and OpenSearch Dashboards and OpenSearch.
Key Features:
- Online tool
- Layout templates
- Pre-built connectors
Why do we recommend it?
Looker Studio is available on Google Cloud in much the same way as Google Drive and the two services can be linked together. The system can work with any data source to display snapshot reports or live data in a dashboard. The package includes a library of connectors to ease data feeds.
Creating a report based on a file of data is really simple but linking to live time series data for a dashboard is a little more difficult and requires the use of a connector. The Looker Studio platform includes a library of more than 850 connectors. This list is particularly rich in links to social media ad systems, such as Google Ads, X Ads, and Facebook Ads.
If you can’t find a connector for the data that you want to represent in your dashboard, you need to go to Locker and create a data feed into that. It is easy to base a Looker Studio dashboard on Locker output because the two tools were created to work together. However, Looker is not free, so at this point, costs start to arise.
The Looker Studio system is geared toward providing social media marketers with data visualizations. There is a connector to Jira, which could be useful for software development lifecycle management. Zoho has provided a list of connectors to its online business systems, such as Zoho CRM and Zoho Books. If you want to process system logs, SNMP, or WMI data for live performance monitoring or security analysis, you will need to move them through Looker.
Who is it recommended for?
Looker Studio is very easy to learn if you just want to generate a report on data that you have ported from the output of an application. However, if you want to get the most out of this tool, you will need to learn how to use Looker. This current connector list makes the Looker Studio system particularly appealing to social media marketers.
Pros:
- Easy to create reports
- Strong on representing social media advertising data
- Links to Looker for data processing
Cons:
- Not good for system monitoring
Looker Studio is an online system and you can use it for free.
5. Geckoboard

Geckoboard is a paid tool but it is worth the money. You can do a lot with this package without needing to bounce through a data processing system, such as Prometheus or Elasticsearch. That makes this a very efficient single unit for creating a dashboard on your data.
Key Features:
- Dashboard templates
- Send to TV
- Processes live data
Why do we recommend it?
Geckoboard is a useful package for processing data into displays, such as reports, presentations, or dashboards. The templates offered in this package present a wide range of use cases that include marketing analysis and also system monitoring. The system specializes in processing live data.
This system makes creating dashboards very easy and puts creating screens on lie data at the same level of ease that the other tools on this list provide for displaying static data. The plans for the package provide two groups of data sources with Core data sources available in the lowest package and Pro data sources available only in the higher plans – they also provide the Core sources.
The Core data sources are similar to the connector list of Looker Studio because there are a lot of social media marketing sources in there. However, there are also system monitoring services in there, such as Pingdom and StatusCake. An interesting option in this list is Data.ai, which monitors mobile apps. Another is Zapier, which is an orchestration suite, which gives you the opportunity to process data from any source, through any application, and then into the dashboard.
The Pro sources include databases and a couple of SaaS packages, such as Salesforce and Snowflake. The Pro list is a lot shorter than the Core connector library. The secret weapon across both lists has to be Zapier because that will enable you to get data from anywhere and process it before forwarding it to Geckoboard.
Who is it recommended for?
Geckoboard is a strong rival to Grafana and Kibana, which are the current leaders in the market. The tool is very easy to use and it can send its dashboards to flat screens TVs, which will make your tech support office look like NASA mission control or a New York hedge fund HQ.
Pros:
- Support many different business functions
- Excels at pulling data from cloud packages
- Enables widgets to be rearranged and for custom layouts to be created
Cons:
- Doesn’t have as long a list of connectors as the other tools in this package
Geckoboard is fairly unique on this list because it doesn’t rely on a companion application to process data for display. This is a cloud-based system with three plan levels that match to small, mid-sized, and large businesses. You can get to know this tool with a 14-day free trial.
Graphanna & Alternatives FAQs
What is Grafana?
Grafana is an open-source platform for data visualization and monitoring that allows users to create and share interactive, real-time dashboards and charts.
What types of data sources can Grafana connect to?
Grafana can connect to a wide range of data sources, including databases, cloud services, messaging systems, and time series databases.
What types of dashboards can be created with Grafana?
Grafana can be used to create a wide range of dashboards, including performance monitoring dashboards, infrastructure monitoring dashboards, and business intelligence dashboards.
How does Grafana differ from other data visualization tools?
Grafana is known for its ease of use, flexibility, and scalability, and includes advanced features such as data filtering, alerting, and dashboard sharing.
What are some popular alternatives to Grafana?
Some popular alternatives to Grafana include Kibana, Tableau, Power BI, and Dashing.
What types of reports can be generated with Grafana?
Grafana can generate a wide range of reports, including performance reports, availability reports, inventory reports, and trend analysis reports.
Can Grafana be integrated with other monitoring and visualization tools?
Yes, Grafana can be integrated with other monitoring and visualization tools, such as network monitoring tools, server monitoring tools, and cloud monitoring tools.
What are some challenges of using Grafana?
Some challenges of using Grafana can include dealing with large amounts of data, ensuring accurate and consistent monitoring and visualization across multiple data sources, and customizing dashboards.
