According to GrafanaLabs, Grafana is an open-source visualization and analytics program. Your data can be queried, viewed, and explored irrespective of the location in which it is stored. Simply said, it gives you the tools you need to transform the data in your time-series database (TSDB) into attractive graphs and visualizations.
Why do Companies Utilize Grafana?
Grafana is used by businesses to monitor their infrastructure and do log analytics, primarily to increase their operational efficiency. Dashboards simplify the process of monitoring users and events by automating the gathering, management, and viewing of data. This makes tracking people and events much easier. This data is used as a compass by product leaders, security analysts, and engineers to influence their decision-making. Studies have shown that businesses that utilize database analytics and visualization tools such as Grafana enjoy significantly higher levels of profitability in comparison to their competitors.
Businesses that utilize database analytics and visualization solutions like Grafana are significantly more productive than their rivals. Businesses use Grafana to monitor their infrastructure, do log analytics, and boost their operational performance all at the same time. The monitoring of people and events is made easier with the help of Grafana dashboards, which automate the collection, management, and display of data. Product managers, security analysts, and developers can all benefit from using this knowledge to help drive their decision-making processes.
It demonstrates not just what their customers claim to do but also what their customers do, which is useful for both teams and enterprises. These actions are referred to as disclosed behaviors, and they are considered to be particularly instructive. Users aren’t very good at predicting their futures, but having analytics enables technology teams to delve further than is possible with human-error-prone surveying and tracking methods.
Why is it Necessary to Use Grafana?
Grafana reveals to corporations and teams what their users do, rather than only what those users claim they do. These kinds of behaviors are known as disclosed ones. Users are not very good at forecasting what will happen to them in the future. With analytics, IT teams can dive deeper than traditional monitoring and surveys, which are prone to human error.
By consolidating all of a user’s data sources into a single, hierarchical interface, Grafana becomes formerly useless data once again valuable.
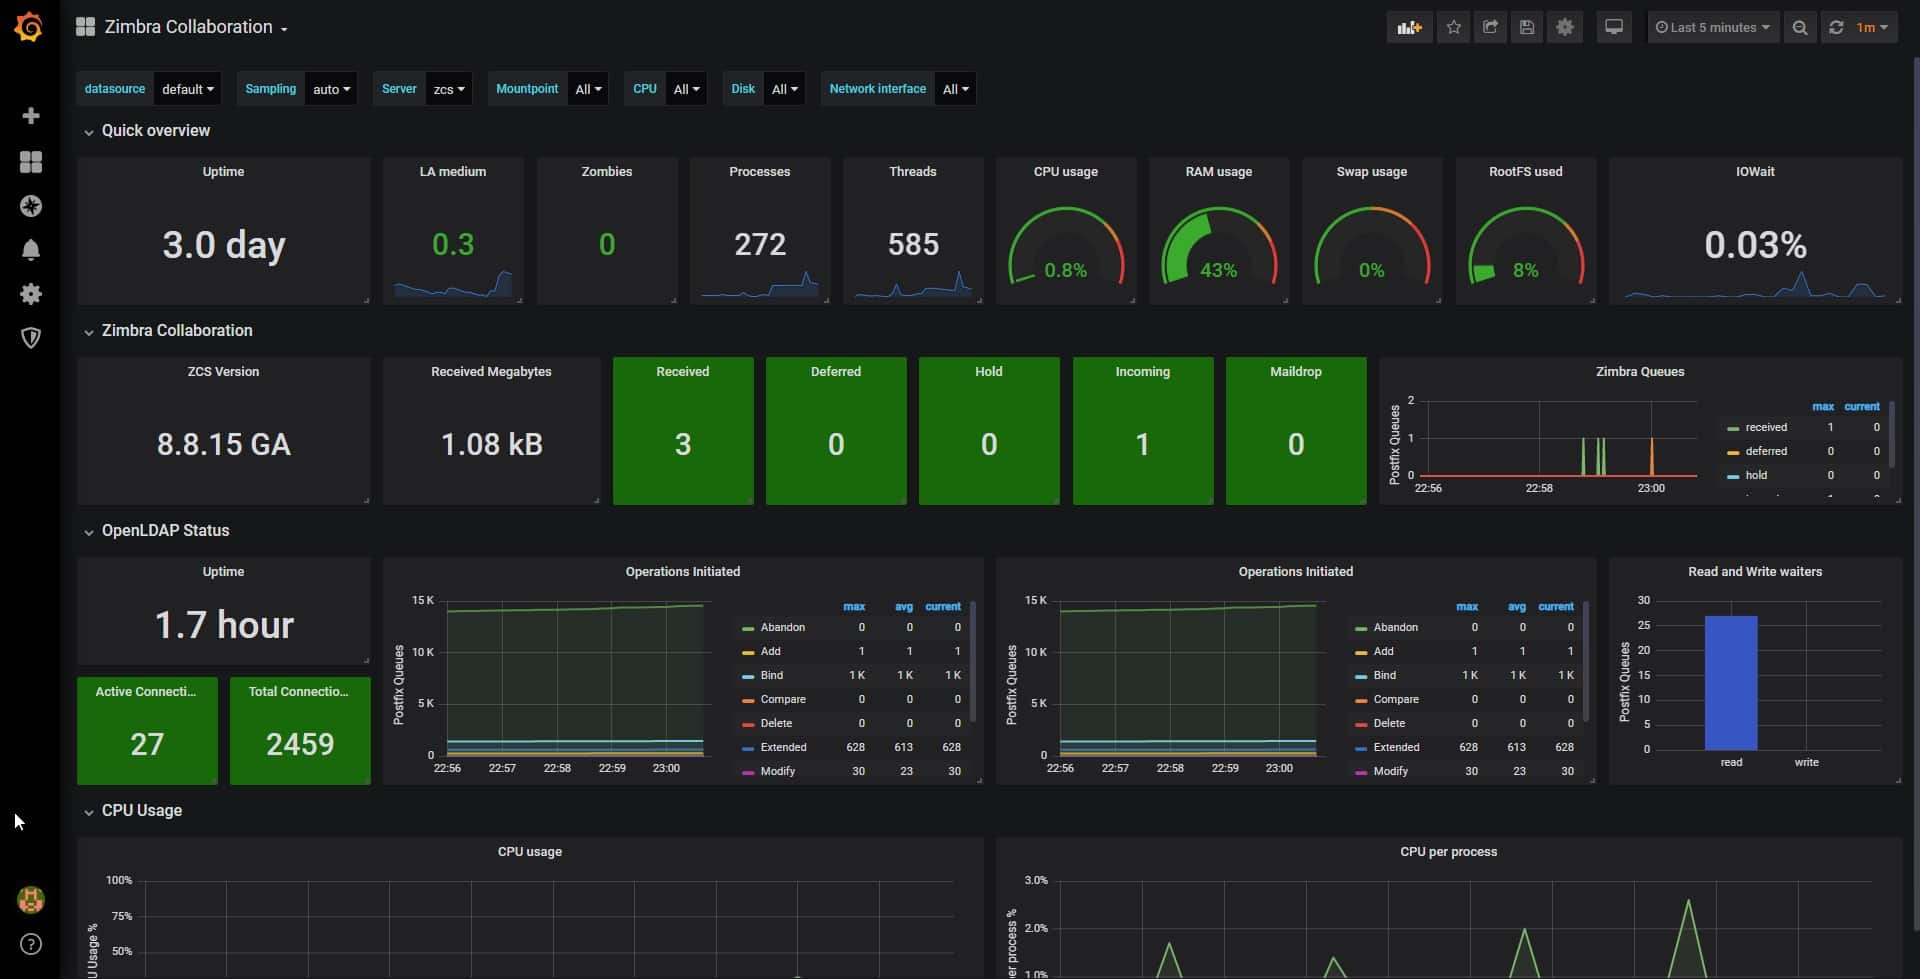
What Does it Mean to Have a Grafana Dashboard?
Multiple panels can be contained within a single grid within a Grafana dashboard. You can visualize the results at the same time from several different data sources. It is a robust open-source analytical and visualization tool that comprises numerous independent panels placed in a grid. Each panel displays a different part of the data being analyzed or visualized. The panels interact with configured data sources including (but not limited to) AWS CloudWatch, Microsoft SQL server, Prometheus, MySQL, InfluxDB, and many others.
Tools That Work with Grafana
Grafana is compatible with an extensive database of data sources, some of which include (but are not limited to) AWS CloudWatch, Microsoft SQL server, Prometheus, and InfluxDB, amongst many others.
Moreover, Grafana connects with every possible data source, commonly referred to as databases such as Graphite, Prometheus, Influx DB, ElasticSearch, MySQL, PostgreSQL, etc.
The Grafana Tool: An Overview of its Functions and Advantages
In the year 2021, even the smallest firms will generate enormous amounts of data, which will require workflows to incorporate instruments for monitoring and analyzing large amounts of data. Grafana is an excellent solution because it is simple to use, offers attractive graphs, and can be combined with a variety of databases. These databases include MySQL, Graphite, Influx DB, Logz.io, ElasticSearch, and PostgreSQL. Grafana also gives beautiful graphs. Because it is open source, developers can design unique plugins that are tailored to match the requirements of their particular projects.
Grafana is a good tool for viewing data. The installation and configuration processes have been reduced to ensure that all users have accessibility and observability. Because of the intuitive design and extensive personalization options available, monitoring application performance will feel like a pleasurable endeavor for all users.
The dashboard is continually being enhanced, so users can expect it to be able to make sense of increasingly complex data types such as graphs, heat maps, histograms, and geo maps shortly. The tool offers several data visualization methods that may be tailored to meet the requirements of a particular project in terms of the business operations involved. The following is a list of the most important aspects of Grafana that you need to be aware of:
- Templates for the Dashboard Dashboard templating, which is one of the most significant capabilities that Grafana offers, enables you to construct dashboards that can be reused for a variety of purposes and shared with the teams that make up your organization.
- Provisioning Users that need a large number of dashboards will want to utilize a script to automate the process of creating the dashboards because it is simple to design a single dashboard by clicking, dragging, and dropping elements. You can script anything with Grafana, and you can also take control of a big number of dashboards.
- Annotations This functionality in Grafana manifests itself as a graph marker, and it helps connect data if something goes wrong. You have the option of manually creating annotations by control-clicking on a graph and typing in some text, or you may retrieve data from any data source.
- Playlists and a Mode Similar to a Kiosk If you want to display your Grafana dashboards on a TV monitor, you can use the playlist function to select which dashboards you need to look through and then make them cycle through on the screen. If you want to do this, you can choose which dashboards you need to look through before you start the playlist. In the kiosk mode’s view-only mode, all of the user interface elements that aren’t necessary to utilize are hidden.
- Plugins Made to Order You can extend the functionality of Grafana and integrate it with additional software, visualizations, and other things by using plugins. Using only a few lines of code, Grafana can visualize virtually any data source so long as it generates a timestamp and a value.
- Notifying and Notification Hooks Tripwires in the form of alerts are triggered if a predetermined situation comes to pass. This information can be sent to the monitoring team via Slack or some other form of the communication channel.
- The Various Teams and Permissions When a corporation has one instance of Grafana but multiple teams, it is common for those teams to desire to maintain their independence while yet sharing dashboards. If you are making use of Grafana Enterprise, you will have the ability to construct a team of users and then provide rights to folders, dashboards, and even the level where data sources are stored.
- SQL Data Sources The native SQL support of Grafana enables you to transform any data stored in a SQL database into metric data that can then be graphed. Power users may do a variety of exciting things with SQL data sources, such as developing business dashboards. One of these things is building business dashboards.
- Authentication Grafana allows you to map people to organizations and supports a range of authentication methods, including Open Authentication Protocol (OAuth) and LDAP. In Grafana Enterprise, you also have the option to map users to teams: If your company uses its authentication system, Grafana can help you link the teams that are found in your internal systems to the teams that are found in Grafana. As a consequence of this, you will have the ability to immediately offer access to the dashboards to the employees who are members of specific teams.
- Customizable Dashboards These are loaded with features and can be set to display data from a broad variety of databases using visualization tools such as heatmaps, histograms, and charts. Customizable dashboards also can display data in a variety of different formats. The system is very adaptable and intuitive to operate.
- Built-in Support for a Diverse Selection of Database Types Grafana is open-source software that allows users to build their plugins according to the specifications of a particular project. Since cloud platforms like AWS already have data collection infrastructure built in, the optimal solution for dashboard construction and visualization is Grafana. You have the option of hosting it on your premises, as well as on any cloud platform of your choosing.
An open-source software as a service (SaaS) metrics platform, Grafana Cloud is native to the cloud, blazing fast, and easily accessible. It is very helpful for people who don’t want to stress about maintaining the full deployment infrastructure and don’t want to take on a load of hosting the solution on-premises. Those individuals will find this option to be quite beneficial. It uses clusters of Kubernetes to operate. Prometheus and Graphite can be used with the back end of the system. Because of this, you have the option of utilizing either a Grafana cloud instance or both of them.
Grafana also offers a product called Grafana Enterprise, which is tailored to meet the requirements of major businesses that require extensive data visualization.
Getting Started with Grafana
Every data visualization platform is designed with two primary roles at its center, which are centered on assisting businesses in answering questions about their customers and events:
- Keeping tabs on information through recording visits, activities, and monitoring activity through logs
- Visualizing data through dashboards and reports as part of the data analysis process
Companies are free to examine the following things with data that has been tracked, recorded, and organized:
- What operations are users performing on the device, network, and other related components
- The average path that users take while navigating our network or app in their activity.
- Possibilities for cutting down on SLA turnover
They are armed with statistically valid information upon which to base their decisions regarding both operational and security matters as a result of the replies they receive. Monitoring synthetic metrics using Grafana is another typical usage of this tool.
What Exactly are Some of the Synthetic Metrics?
A collection of multi-stage procedures required to successfully finish an API call or transaction is referred to as synthetic metrics.
A set of metrics about an API call would include the following:
- The time has come to connect to the API (connect latency)
- The time frame for the request (response latency)
- The size of the payload for the answer
- Result Code of request (200, 204, 400, 500, etc)
- The request’s success or failure and its status
After then, teams usually move on to testing their theories and proving or disproving them. For instance, a user or provider of a patch management solution might have the following questions answered: “When is the optimal time to patch all of the systems? Which of the network’s systems are missing their most recent patches? What are the devices in a network that are the most susceptible to attack, etc? Positive feedback loops can be created once a team has accumulated enough data-backed evidence to construct a repository for it. This takes some time. That is to say, the more data teams receive from Grafana, the more iterations of their procedures they can perform.
It’s simple to get up and running with Grafana — Install Grafana on Your Local Machine > Configure your data source > Build your first graphical user interface.
What are Some Real-world Industry Use Cases for Grafana, and How Can it be Put to Work?
According to 8bitmen.com, Grafana dashboards are used in a wide variety of industries, including gaming, the Internet of Things (IoT), financial technology, and electronic commerce. StackOverflow made use of the service to provide its developers and site reliability teams with the opportunity to construct individualized dashboards to visualize data and improve the performance of their servers.
Grafana is used at Digital Ocean to facilitate the exchange of visualization data and provide all of their teams with a centralized platform for doing so.
Where Do We Stand with the Grafana Reports?
Grafana gives businesses the ability to gain a comprehensive understanding of the “Hows” and “Whats” of users and events in their network or infrastructure. It is especially helpful for security analytics teams since it enables them to track events as well as users’ digital footprints, which enables them to observe what users are doing when they are logged into their network.
Because most applications and websites are not intended to generate in-depth reports or visualizations of themselves, analytics has become an essential component of modern SecOps and DevOps. Because they do not have adequate visuals, the data that they collect is frequently unreliable and badly presented (known as unstructured data). By merging all of the sources of data into a single, arranged display, Grafana renders previously useless data once again valuable.
When Is the Right Time to use Grafana?
The most typical usage for Grafana is as a tool for monitoring infrastructure, which enables users to keep track of application performance as well as error rates. Visual dashboards make it fast and simple to determine whether or not your stack is running regularly. This provides you with real-time insights without the need to manually sort through data points.
When humans need to ingest a big amount of raw data with as little effort as possible, Grafana is an excellent tool. Although some of your other tools, such as Prometheus, may already provide some level of support for data analysis, Grafana provides you with a single purpose-built platform that can perform everything from high-level source interrogation to the creation of overview dashboards.
When you wish to retrieve aggregate information from numerous sources at the same time is another important use case. Grafana shines in this regard because it enables you to locate time-series events, log entries, and custom searches alongside each other for easy access. You can decide to construct an overview dashboard that displays on a single page the use of your hardware resources, significant log lines, and a graph of new user sign-ups in your database. This would provide you with a single location to visit whenever you require an overview of everything that is taking place within your firm.
Other Matters to Take into Account
Data-first methods for engineering and operations are made easier to implement with Grafana’s aid. Although this does not mean that you shouldn’t use it for simple dashboards and monitoring solutions, the best use case is when you are seeing large amounts of data from multiple sources.
Your organization and its goals need that the perspectives you present be unique to them. Before you begin putting together a dashboard, it is a good idea to jot down what you want to monitor and how it should be represented in graphical form. A situation in which incorrect data is presented is just as unhelpful as one in which there is no data at all.
As you continue to develop your dashboards, you can run into data gaps along the way. These occur when a component of your stack is not supplying metrics or when those measurements are unable to be received by Grafana via a data source. If the component is essential to the operation of your application, it is time well spent to fit it with the appropriate instrumentation so that Grafana can keep track of its status. If your dashboards aren’t presenting the complete picture, then consumers may be led to believe they are safe when they aren’t.
On the other hand, you shouldn’t strive to jam as much data as possible into your dashboards. The purpose of Grafana is to make data simpler to comprehend; but, having an excessive amount of material accessible at first glance might be overwhelming, which makes it more difficult to understand what’s going on. Every one of your dashboards needs to have a certain goal, which in most cases can be summed up in the form of a question.
If you have a dashboard that can answer the question “which servers are low on storage?”, you should restrict its panels to only include indicators that directly relate to storage utilization. Adding graphs for the CPU and RAM will make it more difficult to see the most relevant information. It is recommended that a second dashboard be added so that the question “which servers are at risk of performance issues?” may be answered.
It is essential to take into account the impact that Grafana has on the components of the infrastructure that it visualizes. The retrieval of data from your databases and the services that are being monitored causes an overhead that may affect those resources. It is important to avoid refreshing data sources more frequently than necessary. If you have a graph that displays “transactions done today,” then it is quite unlikely that you will need to refresh it every few seconds. The burden that is placed on your infrastructure will be lessened if you choose to settle for less frequent refreshes.
Conclusion
Grafana is a tool for data analytics that allows you to combine, analyze, and visualize data from all of the sources that are pertinent to you. It offers built-in support for more than 15 of the most common databases and monitoring solutions. The metrics that have been gathered from your various data sources are presented in understandable dashboards in the form of modular panels, so producing views that can be comprehended by everyone.
When it comes to data-driven DevOps, using Grafana for your analytics solves several of the problems that are typically encountered. The data that has been collected is frequently not utilized because it is either inconsistent, dispersed across multiple platforms, or too sophisticated for members of the team who are not data specialists to query. You may investigate events and generate helpful visualizations with the tools that are provided to you by Grafana, which combines all of your data into a single platform.
Grafana’s rise in popularity can be attributed to the fact that it enables users to put their data to use. When it comes to spotting patterns, making targeted adjustments, and generally improving their effectiveness, organizations and teams that make efficient use of data have a significant advantage. The contribution that Grafana dashboards make is that they enable product managers, data analysts, and developers to access shared views that ensure that everyone is on the same page.