Considering the impressive release of NPMv12 is fresh in everyone’s mind, one would think SolarWinds would lay low for a bit of time before the release of its next impressive feature.
Well, you would be wrong, because SolarWinds just released v12.1 which includes yet another great feature: PerfStack.
Note: This post has historical reference – updates have been made since 2018 when it was first published
I don’t know about you, but PerfStack is finally what we needed to tie together all the different modules.
Now, let’s start picking apart some of the individual aspects of PerfStack that make it so powerful.
Find Network & Connectivity Issues in LAN via PerfStack
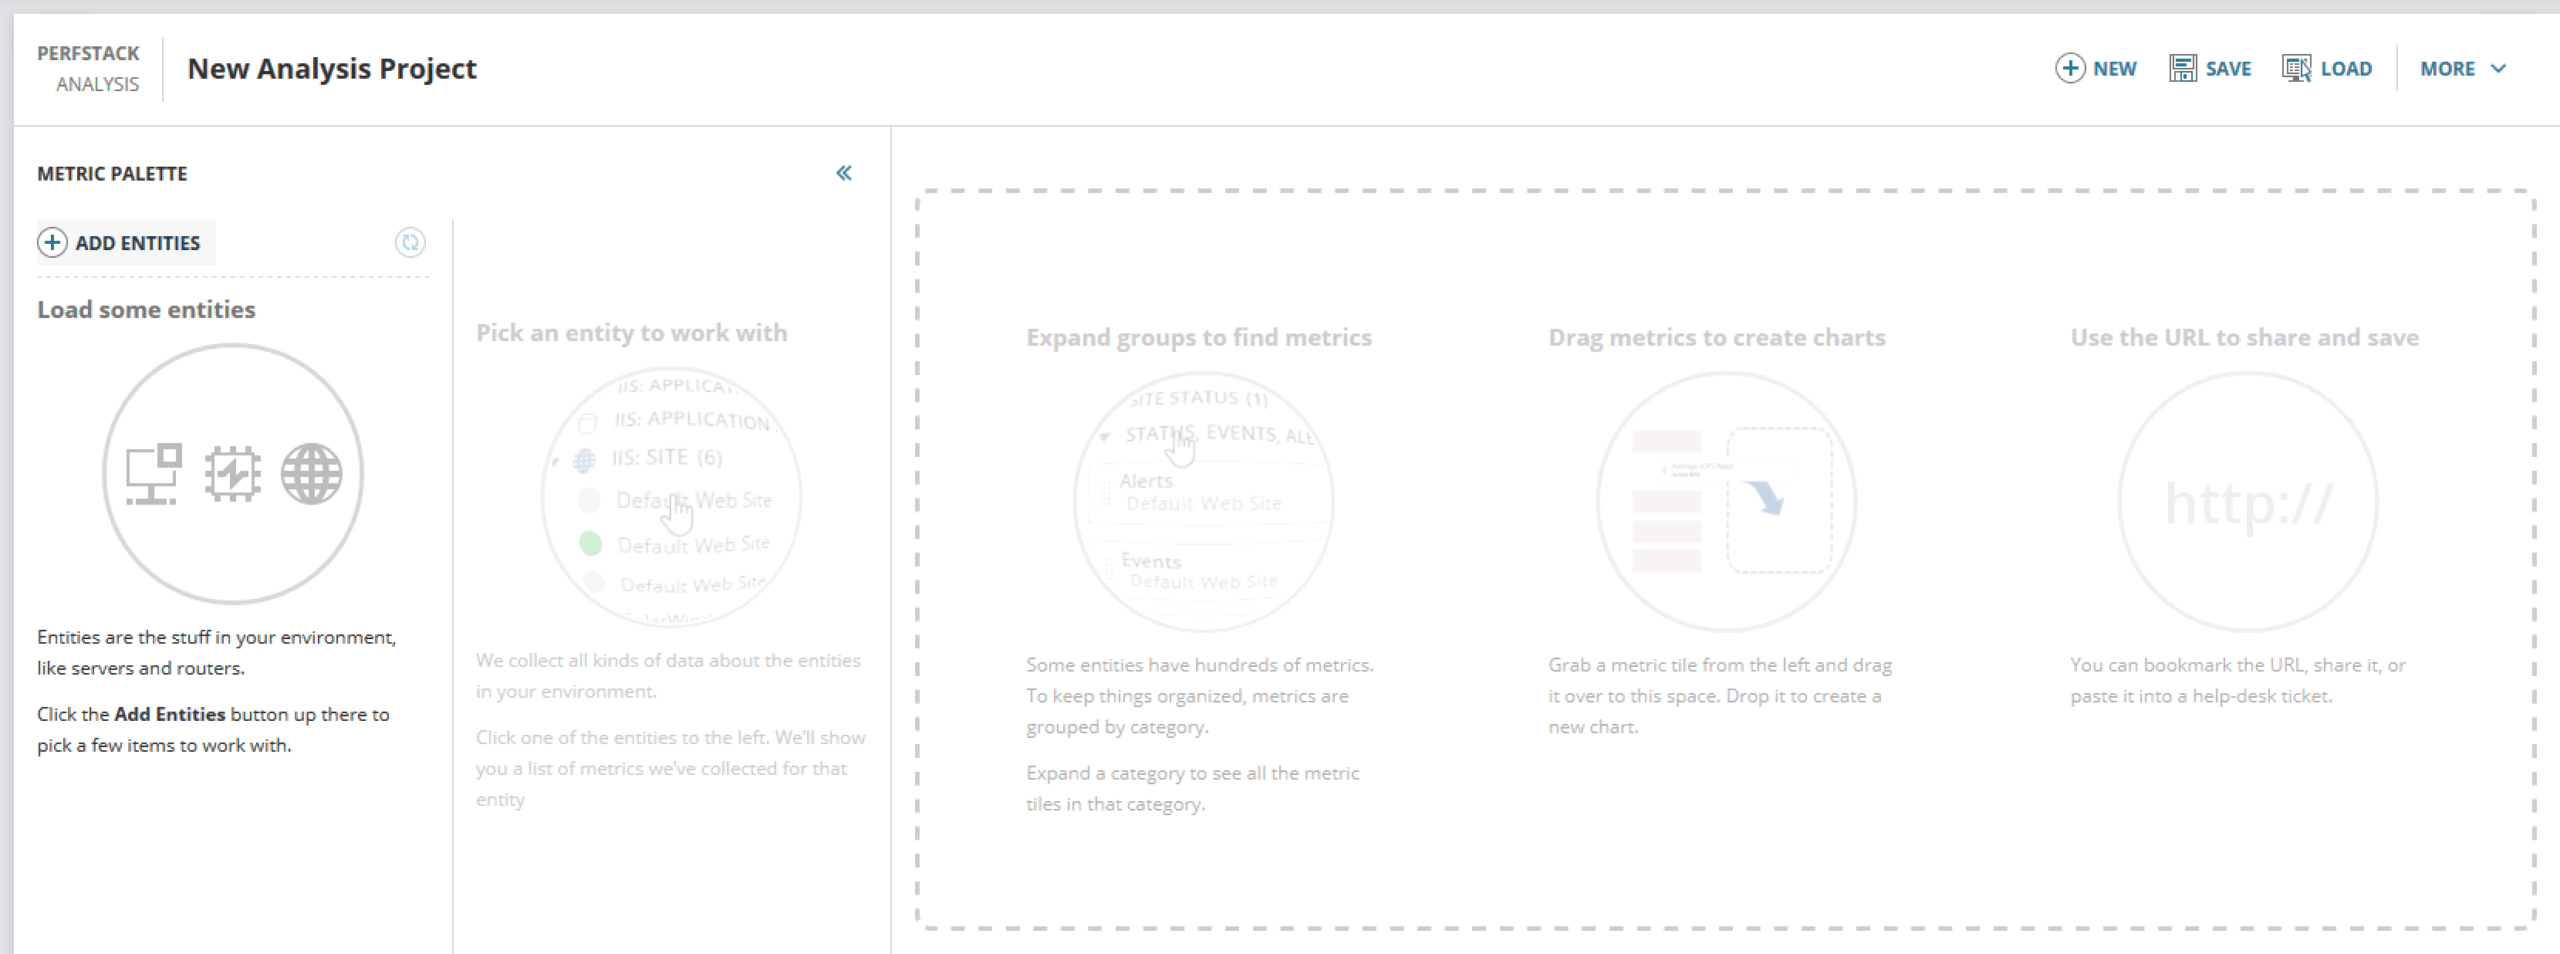
Blank PerfStack dashboard, ready to be built out.
A large SolarWinds environment is capable of monitoring almost every aspect of an IT infrastructure, providing countless pages of customized performance data, but now with PerfStack we can start to take all this information and mold it into a single customizable dashboard.
Dynamic Dashboards:
We can take specific monitoring information from different elements, and line them up side by side with elements from a completely differently module to provides a new view that was previously impossible or unheard of with previous versions of SolarWinds.
Prior to version 12.1 if we wanted to compare router utilization with actual NetFlow data we would need to jump between different web pages across different modules, forcing us to take the time to also configure those 2x separate pages to ensure they are displaying the correct data for the correct time frame.
Now, with PerfStack, once we drag and drop the required elements, the time frame is holistically configured at the top of the page, ensuring all the information we are reviewing is during the proper time frame, regardless of where that information is being pulled from within Orion.
The aspect that allows PerfStack to really shine is the amount of time it takes PerfStack to load the performance data of these different elements, it’s instantaneous.
In the amount of time you can drag & drop elements onto the dashboard it immediately starts fully populating even before reach over to grab the next element.
This allows PerfStack to greatly speed up the troubleshoot process when using SolarWinds.
The next key feature is the ability to save and share dashboards for the future.
This in itself can be a life saver for the following reasons:
- Imagine troubleshooting an issue involving your entire team or another infrastructure team and you stumble on something real interesting. Well, you can save this dashboard, copy the URL, and send that same URL to any additional team mates that are taking part in the troubleshooting process.This allows you to quickly and easily collaborate greatly decreasing the time to resolution.Just like other dashboards within SolarWinds, when a user shares the PerfStack URL not only does the load to the PerfStack page, but the PerfStack page will load up the exact same dashboard that the previous user had saved with all the previously placed elements in their exact same spot right down to the proper time span.

- Let’s say you have a few very important applications or network locations. You can create some PerfStack dashboards ahead of time with the desired information. So when an issue occurs you can open the already created dashboard to get a birds eye view of what is going on.
Grouping Different Elements Together
I have been talking about the ability to grab different elements from different modules, but to what extent can we grab these elements?
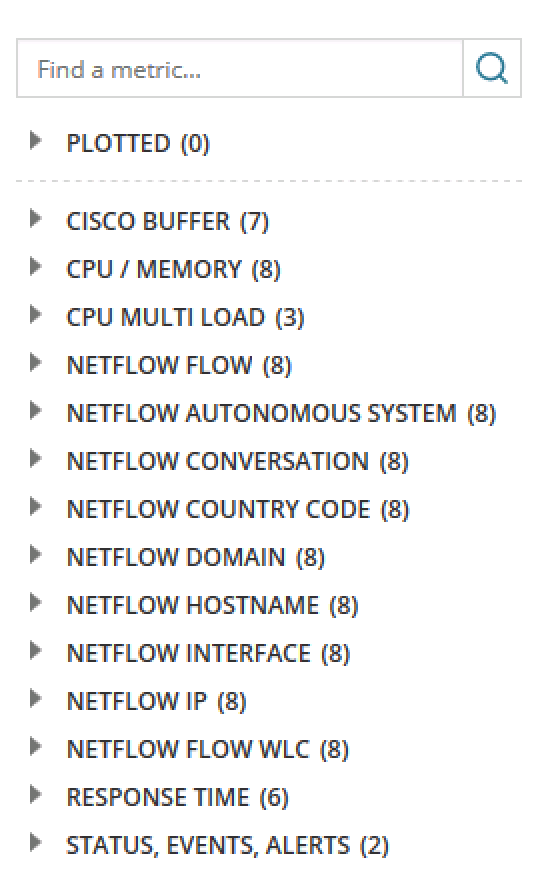
Well, we can pick individual nodes, groups, interfaces, and even elements monitored by AppInsight such as SQL applications and databases.
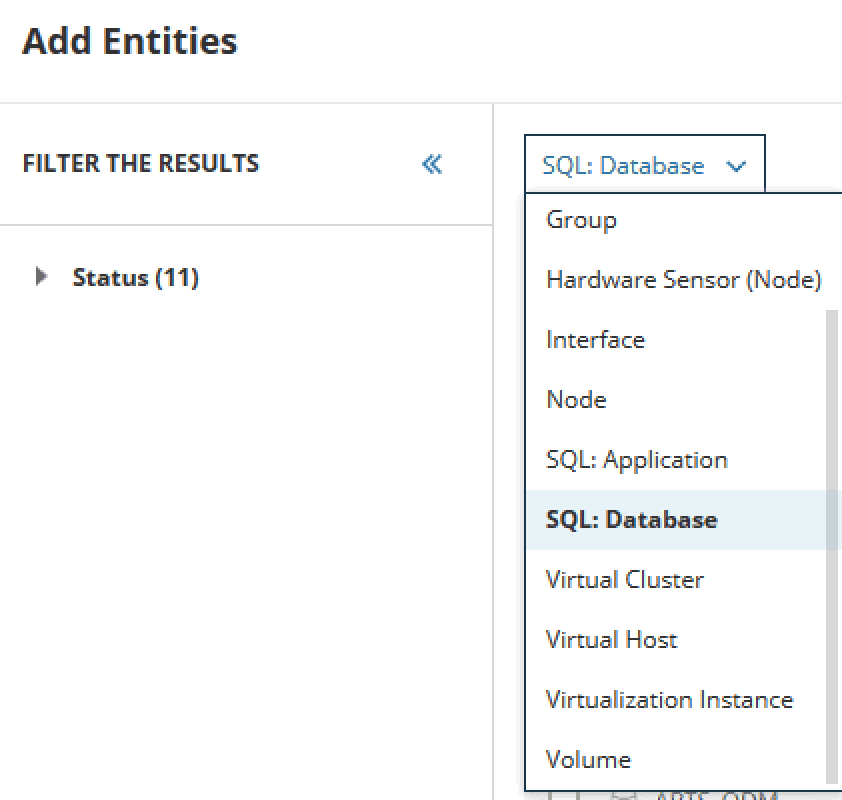
Sample view of some elements available to PerfStack
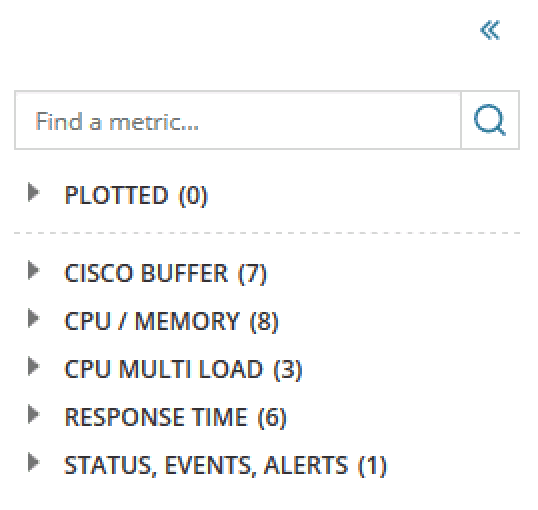
Default information a Cisco switch
Now, those are just the elements from a single node.
Once you add a node, with a single click you can add any other associated elements such as interfaces, hardware sensors, and even IP SLA monitors from the VQNM module that are running on the associated node.
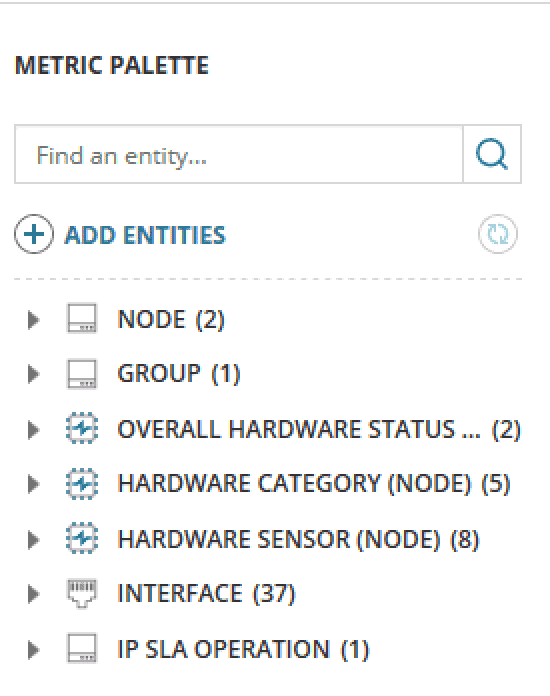
Elements from multiple nodes
The one caveat with this, however, is when we add additional nodes, take a peek at the above ‘interfaces‘ section above.
There are 37 of them, and while the node name is in the prefix of every interface name, this list can quickly grow out of hand. I do hope there are some future improvements to the UI layout of all these elements to improve the organization of this information.
From the above we see information is pulled in from VQNM, but what other modules can be included in this dashboard?
So far NTA is also part of PerfStack. If we add a device that is actively sending NetFlow to the NTA module that information will also show up as a possible data point to plot out.
Netflow elements from NTA
Out of the gate we already have key integration with many of the different modules including NPM, SAM, NTA, VQNM and I imagine additional module support will be added as new versions are published.
Sample Dashboard
Let’s now take a peek at a PerfStack dashboard:
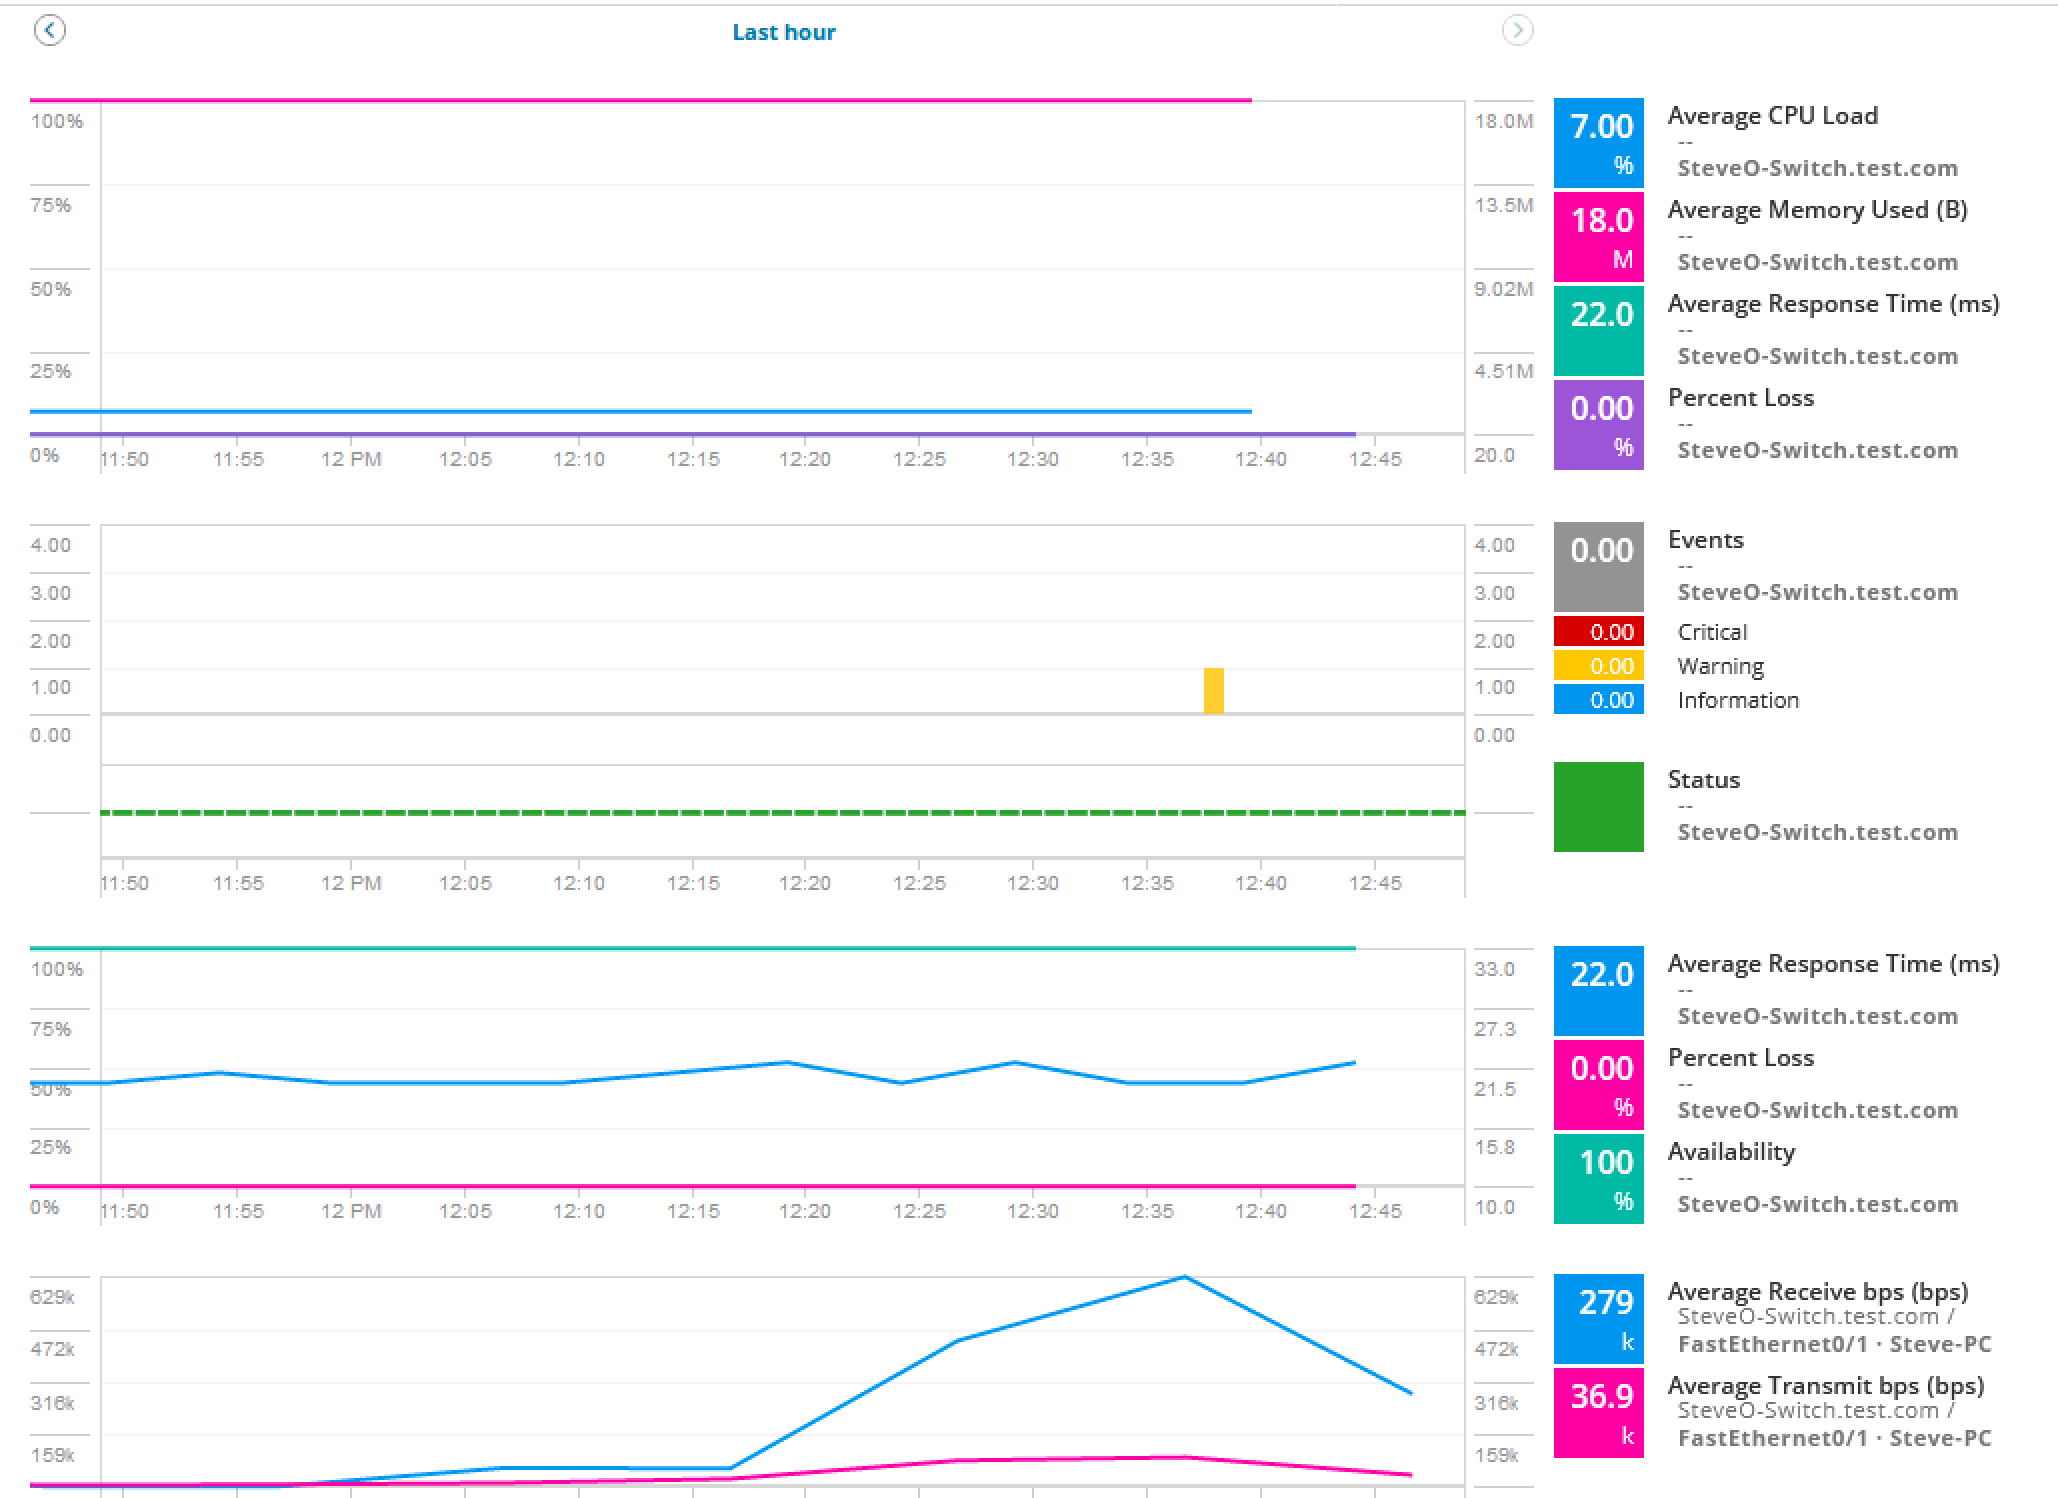
Performance stats from different elements of the same node
From here we can quickly see the overall health of a device as well as the the utilization of the device and some of its interfaces. I definitely have to make a positive comment to the layout of this dashboard as you can simply drag and drop different elements onto the dashboard. Each dashlet can contain a different number of elements, each one color coded in their own right. Consider the potential of lining up events & alerts with utilization statistics. Typically when it comes to alerts or events you either have to be on the specific node/element page or on the actual alert/event page and filter accordingly, but now we have easier access to this information. It’s also easy enough to remove performance data by simply hovering over the desired data point on the right hand side and clicking on the ‘X‘ that appears.
I also want to point out, that everything is properly lined up from a timing perspective. You can also change the time range of the entire dashboard with just a few clicks affecting all the added dashlets.
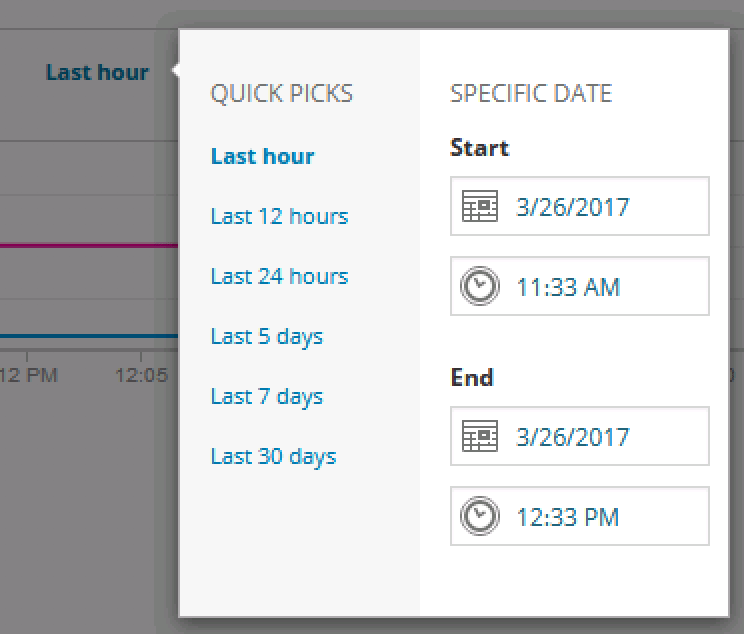
Setting the time for the entire dashboard.
Steve’s Verdict
I’ve said it before and I’ll say it again, this is the type of feature I have been waiting for! PerfStack breaks new ground with SolarWinds products allowing any sharp minded engineer to paint a picture visually expressing a root cause or bottle neck using the palette provided by the various modules monitoring your infrastructure.
This web site has been mentioned before, but if you are still interested in seeing what PerfStack can do, I recommend checking out the Orion Demo website and seeing what this new tool is capable of. I can not wait to see where SolarWinds takes this feature next.
Building dashboards with data from different modules is great, but I am wondering what can be done to improve the time taken to build-out the dashboard.
Perhaps in the future we will get some type of wizard allowing us to pick and choose what performance data we want and the picking an already created group or NetPath monitor improving the node selection process. Until then though I will definitely be utilizing PerfStack in its current stage.