
A distributed NoSQL database management system called Cassandra is built to handle enormous amounts of organized and unstructured data across several commodity computers. For modern applications, it is an open-source database management system that offers high availability, fault tolerance, and scalability.
The peer-to-peer paradigm, which is the foundation of Cassandra’s architecture, distributes data among a cluster of computers. A piece of the data is stored and processed on each node in the cluster. As a result, Cassandra can offer linear scalability, high availability, and fault tolerance.
To maintain the system’s dependability and effectiveness, Cassandra’s performance and health must be closely monitored because it is built to handle large amounts of data. We’ll talk about the top Cassandra monitoring tools in this article so you can keep an eye on your cluster’s functionality and general health.
How does Apache Cassandra work?
Apache Cassandra is a NoSQL decentralized database system that is open-source, totally accessible, and capable of managing enormous amounts of data duplicated over numerous computer units while retaining excellent stability. Netflix and Spotify, for example, have adopted Apache Cassandra. The official Apache website offers a free download of Cassandra.
Although Cassandra has built-in fault tolerance and other characteristics, it still needs to be managed well. To provide the greatest performance and prevent security incidents, a network monitoring tool must be used to assess the functionality and health of databases.
Key Features of Apache Cassandra
- Engineered to manage enormous volumes of data across several servers; Extremely scalable and distributed.
- Peer-to-peer design for high availability and fault tolerance; optimized for workloads that include a lot of writing; strong assurances of consistency to assure accurate data;
- Support for ACID transactions, a flexible data model for structured, semi-structured, and unstructured data.
- Cross-datacenter replication for disaster recovery and data backup.
- Built-in data compression for efficient data storage and support for unique indexing and query languages.
- Interoperability with well-known programming frameworks and languages.
- An open-source community that is active and regularly updates and improves.
Here is our list of the best tools to monitor Apache Casandra:
- ManageEngine Applications Manager – EDITOR’S CHOICE You can try out ManageEngine Apps Manager for free. Has a fantastic dashboard that can monitor clusters and more, and is also compatible with MongoDB. Access a 30-day free trial.
- Site24x7 – FREE TRIAL A monitoring package that can be extended with a Cassandra plug-in, giving teams visibility into database performance, health, and resource consumption. Delivered as a hosted service. Access a 30-day free trial.
- Datadog Apache Cassandra Monitor A database monitoring tool from a cloud platform, Datadog Apache Cassandra Monitor is a system infrastructure monitoring package that is tied into an application dependency map.
- AxonOps 3-in-1 Cassandra Operations This cloud platform of specialized Cassandra services offers Cassandra system monitoring, upkeep, and backup services. Enter the demonstration sandbox.
- Sematext Apache Cassandra Monitoring The Sematext Infrastructure Monitoring package, which also monitors servers and networks, and other applications, includes this monitoring service. either designed for hosting using Docker or as a SaaS bundle.
- Dynatrace It can analyze the data it collects in-depth and automatically recognizes Apache Cassandra databases.
- SolarWinds Server & Application Monitor Excellent for keeping an eye on Linux or Unix, including node statistics, network health, and tracking.
- Instaclustr Using a unique Cassandra monitoring API, Instaclustr Network monitor, offers updates every 20 seconds and a useful cluster overview view.
The Best Tools for Monitoring Apache Casandra
1. ManageEngine Applications Manager – FREE TRIAL
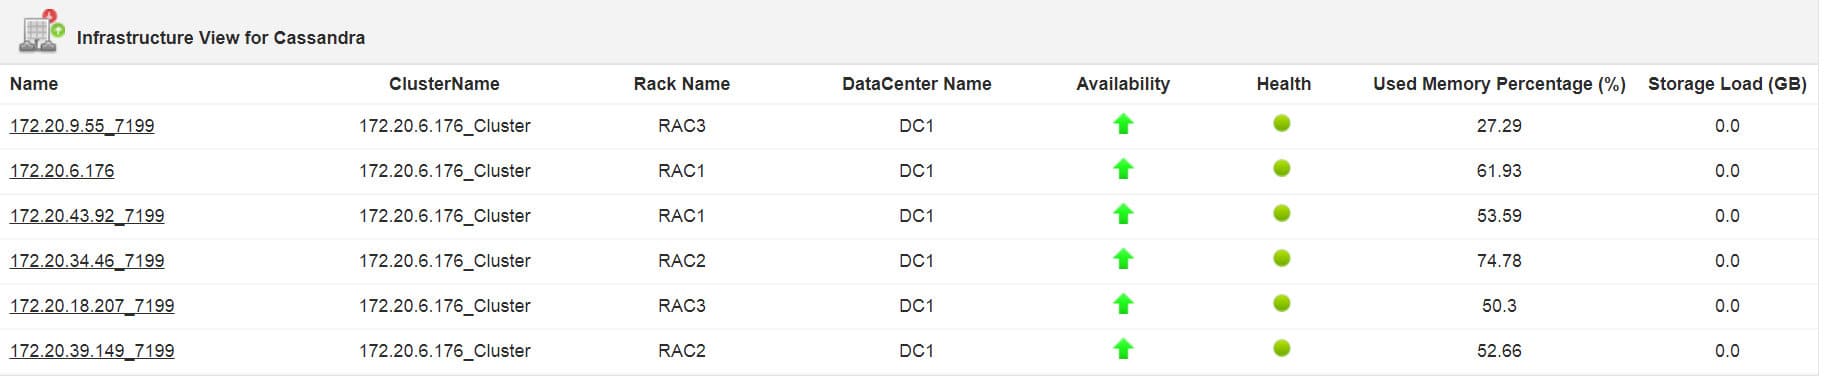
Comprehensive network monitoring, cutting-edge digital surveillance, and many other features are available through ManageEngine Applications Manager. Apache Cassandra is integrated with the monitoring tool ManageEngine Application Manager. Monitor the database’s performance.
In this, several behavioral graphs are used to demonstrate Cassandra’s functionality and performance in addition to the monitoring. These infographics also display disc space information and CPU load.
Key Features:
- Monitoring Cassandra’s performance in various settings is simple.
- Databases, dedicated servers, and other networking devices are all immediately recognized.
- The alert system that supports notifications is accessible.
- It offers log monitoring services to keep tabs on outside variables.
Installing either the Professional or Corporate version is an option. The software will automatically return to the free version with reduced features if you don’t sign up for a business license before your 1-month free trial expires.
Pros:
- Show how applications are interdependent to show how performance issues may affect business operations
- Provides log monitoring services to track metrics like memory use, disc IO, and cache condition, giving you a complete picture of the health of your database
- Able to instantly and automatically discover databases, server hardware, and devices
Cons:
- Can take time to fully explore all options
In addition to the dashboard, Cassandra’s performance is displayed through a variety of performance graphs. There are graphs for storage statistics, CPU consumption, and memory usage. The memory consumption graph, for instance, displays the evolution of total memory, free memory, and consumed memory over time. Start a 30-day free trial.
EDITOR'S CHOICE
ManageEngine Applications Manager is our top pick for a Cassandra monitoring tool because of its comprehensive and intuitive approach to managing the database’s complex architecture and performance requirements. Designed to provide deep visibility into critical metrics like read/write latency, memory utilization, and storage, Applications Manager simplifies the task of monitoring Cassandra’s distributed nature and ensures peak performance for business-critical applications. One of its strengths is real-time performance tracking, which alerts administrators to issues like slow queries or node failures, allowing for swift troubleshooting. Applications Manager’s dashboard provides an easy-to-navigate view of Cassandra clusters, helping administrators monitor the health of nodes and data consistency across distributed databases, while identifying potential bottlenecks. This is particularly valuable for businesses using Cassandra for high-availability applications that require continuous uptime and quick responsiveness. The tool also excels in capacity planning, displaying historical trends that allow administrators to make proactive adjustments as usage grows. Applications Manager has broad monitoring capabilities beyond Cassandra monitoring, and it discovers all applications, creating a dependency map that sets up predictive alerting.
Download: Get a 30-day FREE Trial
Official Site: https://www.manageengine.com/products/applications_manager/download.html
OS: Windows Server, Linux, AWS, and Azure
2. Site24x7 – FREE TRIAL

Site24x7 provides core monitoring for networks, servers, applications, and cloud systems, and it can be expanded through plug-ins. The platform includes an add-on for Cassandra monitoring, and because the service can reach remote platforms, it does not matter whether the database is on-premises, hosted in the cloud, or part of a hybrid environment.
Key Features:
- Tracks Cassandra metrics such as read and write latency, disk usage, memory consumption, and node status
- Monitors individual Cassandra nodes
- Measures Cassandra-specific indicators such as commit log size, cache hit ratios, and request latency
- Provides customizable dashboards for Cassandra performance visibility
- Supports alerts based on custom thresholds for latency, disk space, and memory use
The service collects database activity data together with information about the resources Cassandra consumes and the availability of those resources. It monitors each node as well as the wider cluster, which gives administrators continuous visibility into availability and response times. If an error occurs, the platform can raise an alert automatically.
Site24x7 also does more than monitor Cassandra on its own. It can watch the systems that feed data into the database and the infrastructure that supports it, including networks and internet links, which helps teams identify root causes more quickly when problems arise.
Pros:
- Stores historical performance data for trend analysis and capacity planning
- Monitors multiple Cassandra clusters from one interface
- Fits into a broader monitoring suite covering the wider IT estate
- Suitable for small through large Cassandra deployments
- Works across multiple systems at once for hybrid monitoring
Cons:
- No on-premises hosting option
Site24x7 is sold as a subscription service with several plans. Entry pricing is aimed at very small businesses, while larger organizations pay more for greater capacity. You can assess the platform by accessing a 30-day free trial.
3. Datadog Apache Cassandra Monitor
Datadog is a complete monitoring tool for Apache Cassandra deployments that also features a wide range of functionality for connections, events, apps, and network architecture monitoring. There are numerous applications supported by this SaaS (Software-as-a-Service) infrastructure model, including Apache Cassandra, continuous profiling, distributed tracing, and many more.
Key Features:
- Real-time representation of adjustable parameters and actionable information
- To quickly evaluate response streams, a simple log analysis framework and auto-pattern recognitions are used
- Deductive algebra can be used to put up hybrid alerts so users don’t have to waste time responding to untrue information
- It is simple to identify downward Cassandra queries and data restrictions thanks to thorough delay splitting and edge application monitoring
- Make unique drag-and-drop data visualization charts in a flash
If the default screen looks overly crowded, you can design your own home page using the metrics that are most important to you. Widgets from different sites can even be combined to create a stack overview that displays database, server, and network performance overviews all in one location.
It is impossible to constantly monitor all of your database’s performance statuses. This is not a problem, though, because Datadog Infrastructure establishes performance thresholds for each statistic and notifies you when one is exceeded. Instead of spending all of your time monitoring your Apache Cassandra databases, this service allows you to go on to other duties.
Pros:
- Gives network administrators a comprehensive view of the performance and usability of the network by monitoring both internally and externally
- Supports auto-discovery that dynamically creates network topology maps
- The network reflects changes in almost real-time
Cons:
- Would like to see a longer trial period
Datadog is a subscription-based service that is broken up into different monitoring sections. The system’s constituent parts are charged separately, either regularly or as needed. When compared to yearly pricing, on-demand payment increases the cost of the goods by about 17 to 20%.
4. AxonOps 3-in-1 Cassandra Operations
An online tool for managing and monitoring Apache Cassandra clusters is called AxonOps. It offers a full range of monitoring services, including real-time cluster health, resource usage, and performance metrics monitoring.
Key Features:
- Use dynamic dashboards to visualize stats and logs
- Active service checks to ensure you never miss a problem
- Comprehensive alerting with integration across the entire company
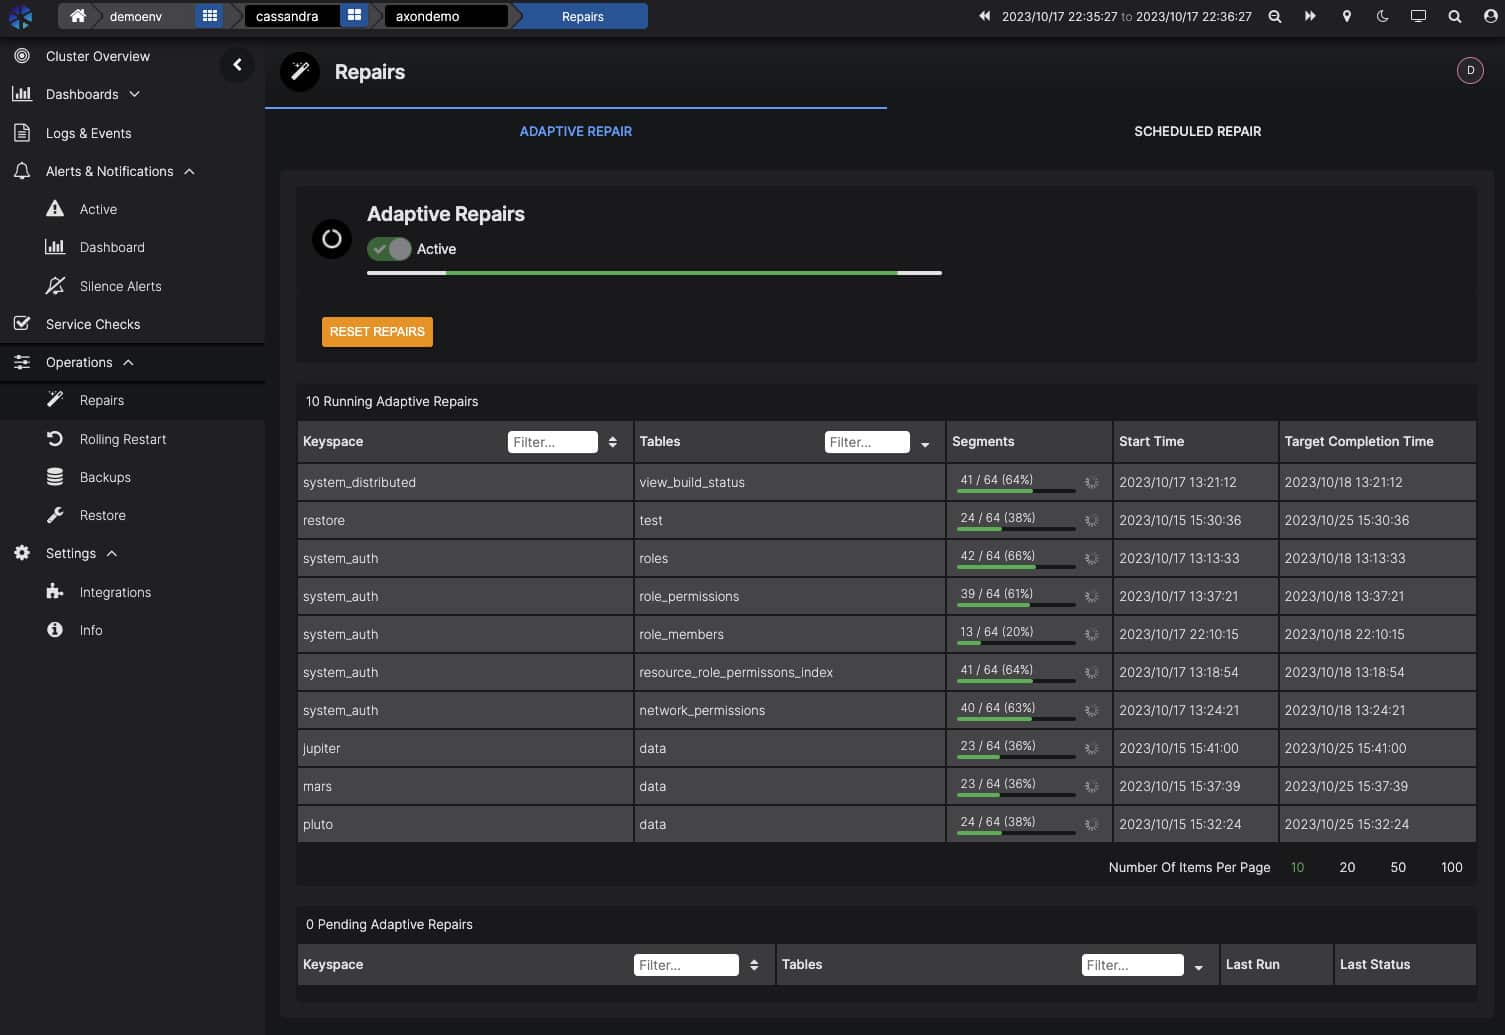
- Scheduled and Adaptive Cassandra Repairs strives to be proactive at all times
- Maintenance With a job scheduler, automate your essential jobs
With a user-friendly web-based interface that offers a unified view of your whole Cassandra cluster, AxonOps is made to be simple to use. You can make your own dashboards and alerts using the many visualization choices, including graphs and tables.
AxonOps’ capability to automatically find and notify users of abnormalities in the Cassandra cluster is one of its primary features. This enables you to swiftly locate and fix problems before they affect the functionality of your application.
AxonOps’ capability to automatically find and notify users of abnormalities in the Cassandra cluster is one of its primary features. This enables you to swiftly locate and fix problems before they affect the functionality of your application.
AxonOps also comes with several management tools, including node management, performance tweaking, and backup and restore. It gives you options for growing your Cassandra cluster as your data increases and makes it simple to add and remove nodes from your cluster.
The ability of AxonOps to offer predictive analytics for your Cassandra cluster is yet another crucial feature. It analyzes previous data using machine learning algorithms to find patterns that can be utilized to forecast future performance and resource use.
Pros:
- Monitors all key performance metrics, including CPU, memory, and disc use
- Provides a log reader and stores log messages for analysis
Cons:
- Not keeping track of other DBMSs
Overall, AxonOps is a strong and user-friendly cluster management and monitoring solution for Apache Cassandra. For businesses of all sizes that need to monitor and manage their Cassandra clusters, its extensive feature set and user-friendly interface make it a great option.
5. Sematext Apache Cassandra Monitoring
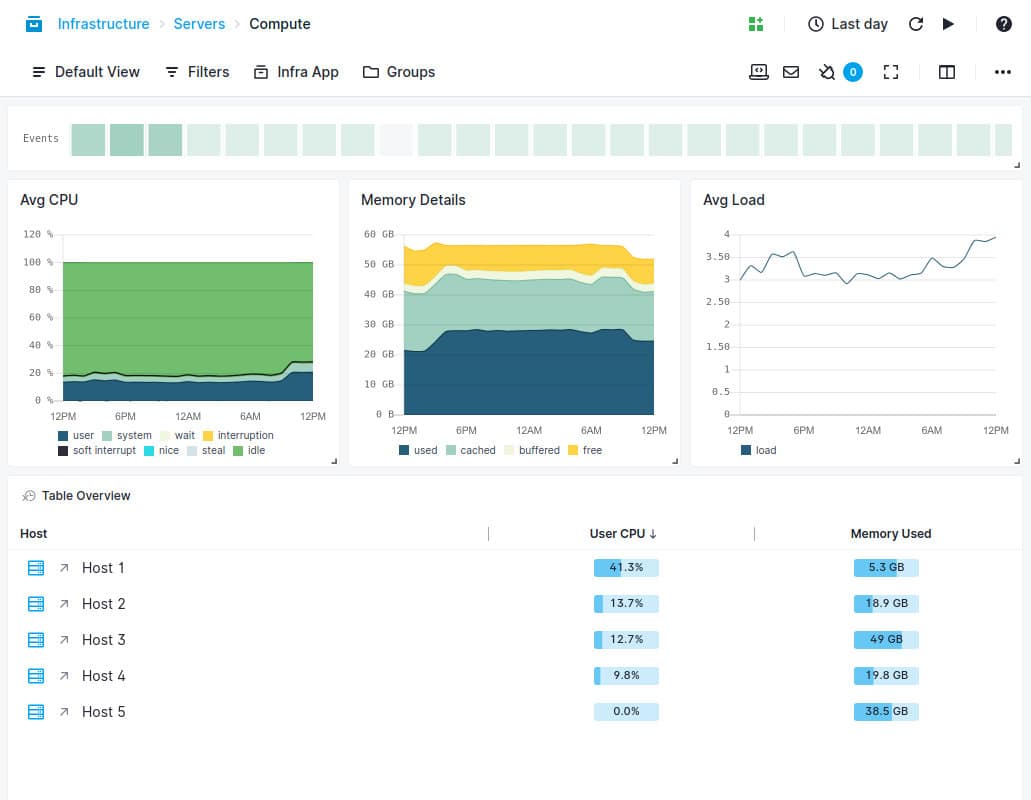
Using an on-demand cloud platform, Sematext quickly identifies potential problems and system failures to give businesses full-stack information. SemaText is easy to set up and provides thorough visibility into your IT infrastructure. It offers to monitor Apache Cassandra.
It is a dependable solution that will provide a great tracking environment for Apache Cassandra deployments. It combines a powerful reporting mechanism with the ability to recognize aberrant behavior in support of numerous indications.
Key Features:
- It offers powerful graphing tools allowing virtually any data from the SemaText to be shown
- Alerting based on the detection of anomalous behavior and compatibility with external notification systems
- Systematic reporting and ongoing upkeep
- It enables customizable monitoring, enabling the user to keep tabs on any faults and performance problems
- Metrics analysis may be utilized in dynamic contexts based on virtualization technology. This makes it simple to scale resources up or down to match the needs of the organization
The Apache Cassandra Monitoring integration, an add-on to the standard monitoring package, gives users the ability to retrieve Cassandra metrics. Because it can be accessed by clicking a button on Sematext’s settings pages, the plug-in is simple to use. If you run Cassandra in a distributed model or a cluster, this service will consolidate the monitoring of numerous instances, which is wonderful.
Pros:
- Cassandra’s performance tracking in real-time
- Storage of metrics for historical analysis
- Across all platforms, keeps track of all system resources
Cons:
- The cost of the subscription may increase with longer data retention periods
If you just monitor five hosts and agree to a 30-minute data retention period, Sematext Infrastructure Monitoring and the Apache Cassandra integration are free to use. A premium subscription is necessary to access more hosts and extend retention times.
6. Dynatrace
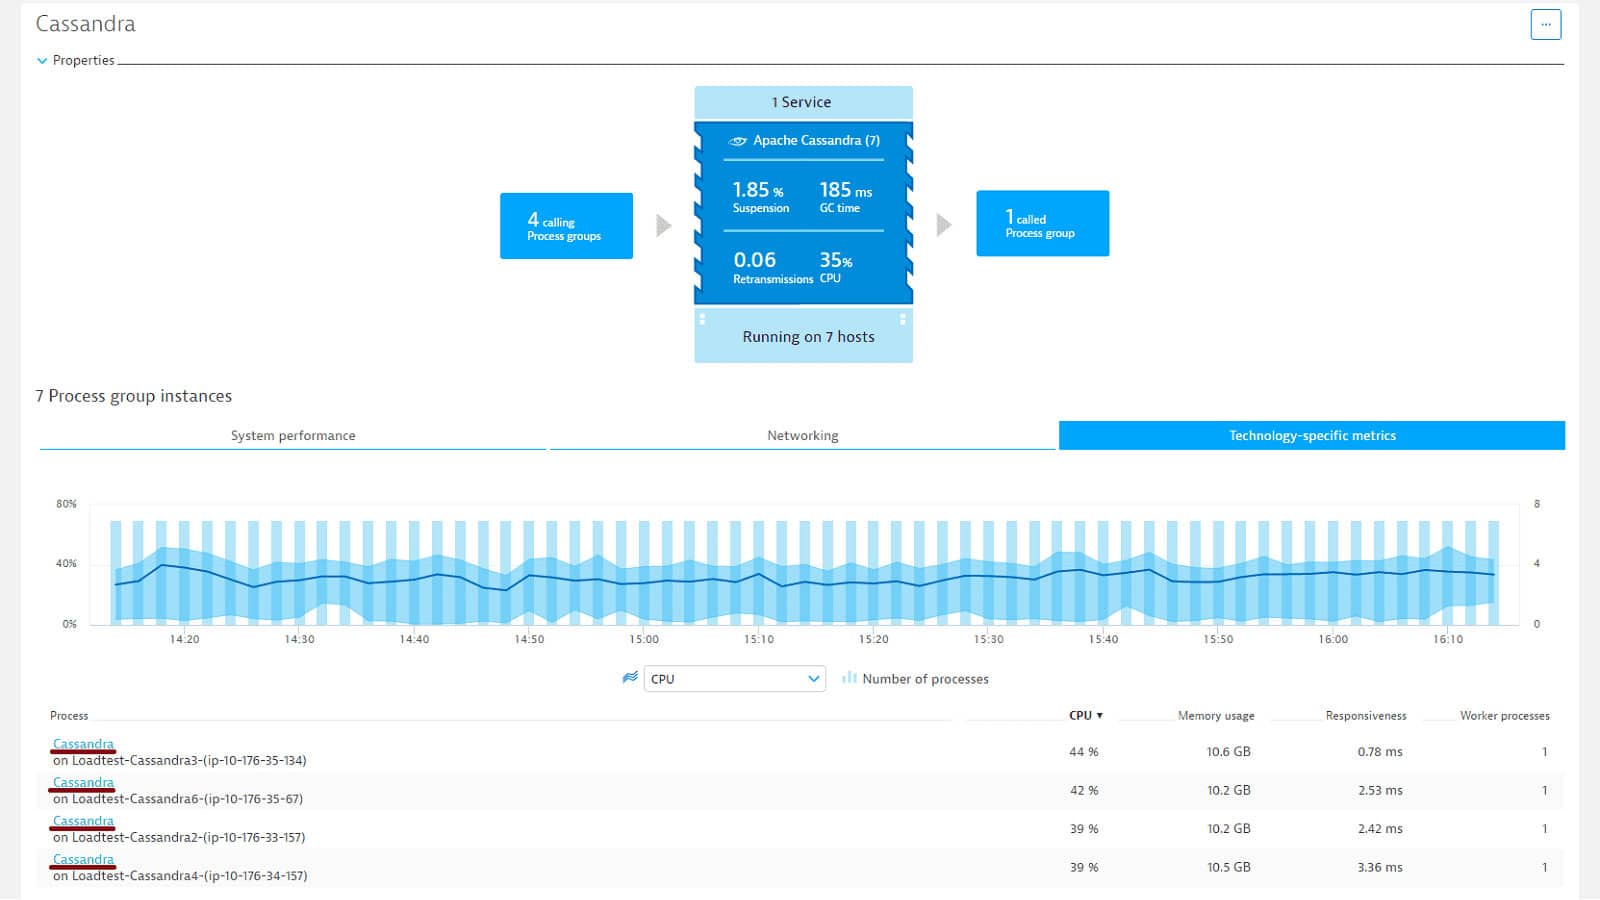
Another top-notch monitoring tool that quickly detects Cassandra databases and enables you to start monitoring their performance is Dynatrace. The Dynatrace monitoring tool can be used to evaluate any complex application environment.
Key Features:
- To identify the root causes of problems, it has a built-in root cause analysis technique
- Dynamic and flexible dashboards
- When using well-known cloud services providers like GCP, IBM Cloud, and AWS, Apache Cassandra statistical measures are compatible
- With help, users can identify problems, their effects on the organization, and their root causes with ease
With the help of this tool, you’ll be able to see a more comprehensive picture of your entire application architecture, including network infrastructure, client engagement, and changeable functionality data. It provides a simple way for you to monitor your architecture, data system, and records. It can detect, resolve, and streamline applications automatically.
CPU, connection, garbage collection time, suspension, and retransmissions are among the performance data you can track. You can begin reviewing more in-depth statistics on the Additional Information tab, including disc use, Cache, Hints, Load, Thread Pools, and Java Managed memory.
Pros:
- Functions in the cloud, making it independent of platforms
- Keep track of an application’s availability, together with its supporting technology and user experience
Cons:
- Has a more extensive onboarding process
If you require a straightforward Cassandra monitoring solution that is easy to set up and has transparency down to the root level, Dynatrace is a product you have to take into consideration. The services are available under the SaaS cloud service paradigm and can be purchased on a pay-per-use basis. A 15-day free trial is additionally offered.
7. SolarWinds Server & Application Monitor
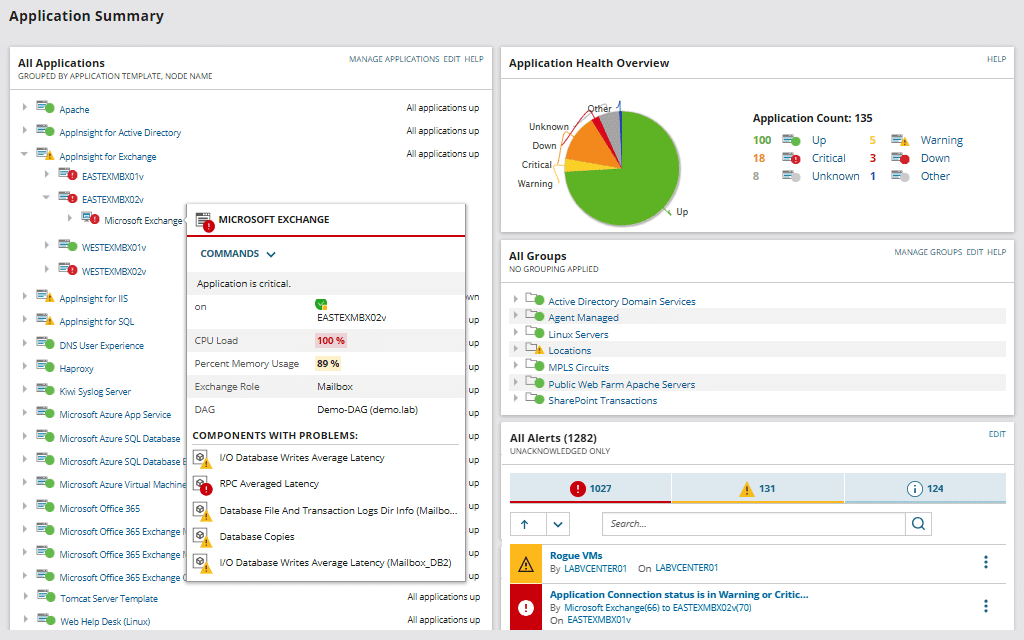
A clever and potent Cassandra performance monitoring tool to improve database performance is the SolarWinds Server & Application Monitor (SAM). To avoid performance issues like network congestion and service outages that could hurt end users, Cassandra’s monitoring requires an organized strategy.
Key Features:
- Adds new widgets to the dashboard to alter its design
- Often check the Cassandra database
- Control several Cassandra monitoring dashboards from a single location
- dependency maps for infrastructure
- Build intelligent alerts for the Cassandra server-appropriate thresholds to be informed of urgent issues
Installing this monitoring tool is simple, and its first configuration may be carried out with the aid of its auto-discovery process with equal ease. It is intended to find and fix the root causes of Apache Cassandra’s performance issues. Users can also delve further into particular Cassandra clusters thanks to it. The user can also design personalized notifications using this tool.
Pros:
- May monitor infrastructure resource utilization as well as indicators related to Apache
- Proactive warnings are sent out when performance deviates from the norm.
- Supports Linux and Unix deployments fully.
Cons:
- Must set aside time to research all monitoring options
Moreover, SolarWinds Server & Application Monitor allows you to build up personalized notifications. Increased delay or continuing hint activity are some of the variables that are tracked. The All Active Alerts page, which provides a list of all currently active alerts and information on their origin and duration, allows users to view notifications.
8. Instaclustr
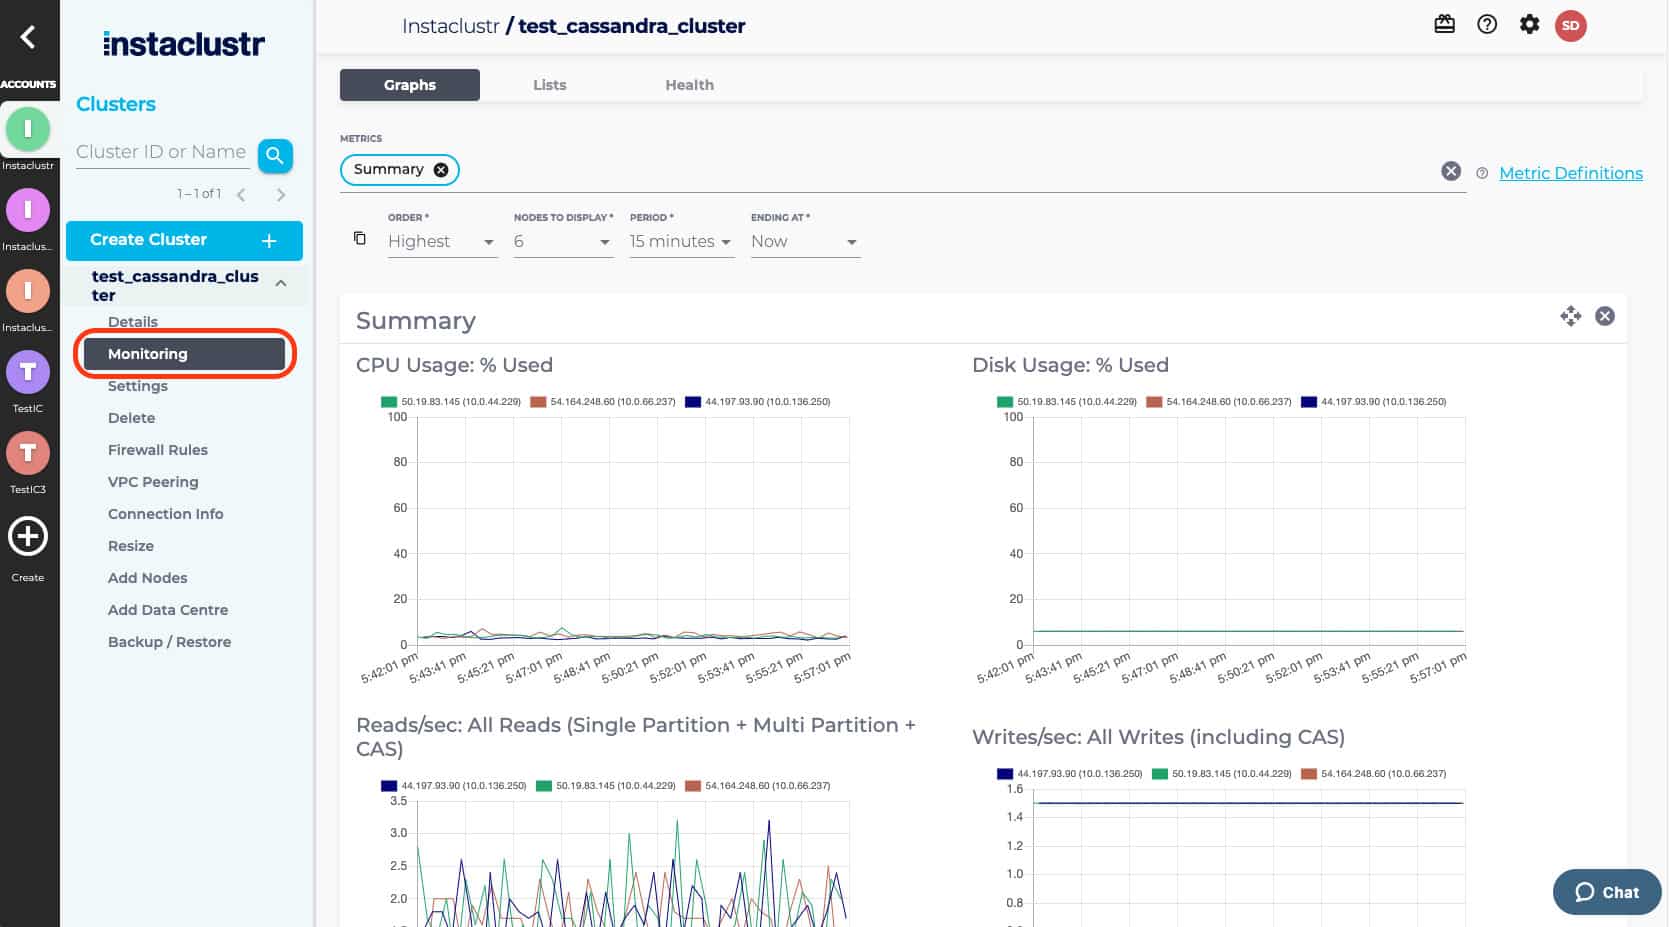
A Cassandra Monitoring API is available on the network monitoring software Instaclustr. The CPU, disc, reads, writes, latency tasks, pending compactions, task statistics, live cells, and tombstones per reading are all tracked by the Cassandra Monitoring API. Every 20 seconds, each measure is updated, ensuring that the data you see is accurate. The Cluster Summary view provides adequate details from an overhead perspective to determine a cluster’s health.
Key Features:
- Users can monitor resource usage closely and produce reports on it
- The excellent price is clear and straightforward for your service infrastructure
- It is capable of managing infrastructures with several clusters successfully
There is a free trial that is fully functioning. By selecting an application and service provider on the pricing page, you can also identify the best plan for Your infrastructure and analyze the associated costs.
Pros:
- Apache Cassandra API monitoring is built-in
- May monitor and report host resource usage
- Can effectively manage multi-cluster settings
Cons:
- Fewer integrations available
A built-in visualization tool allows users to see the evolution of parameters over time. For instance, a graphing tool can be used to examine changes in propagation latency over time. These infographics make it simple to spot trends that the dashboard can make you miss.