Serverless monitoring tools boost distributed app security. There are many Serverless Monitoring Tools available that can help with smooth integration and infrastructure monitoring. This article will discuss the best ten serverless monitoring tools.
Here is our list of the best serverless monitoring tools:
- ManageEngine Applications Manager – FREE TRIAL This monitors serverless hosting systems along with services, middleware, software, and Web applications. Available for Windows Server, Linux, AWS, and Azure. Get a 30-day free trial.
- Site24x7 – FREE TRIAL A cloud-based application performance monitoring service that can trace serverless systems. Start a 30-day free trial.
- Paessler PRTG Network Monitor – FREE TRIAL A software-based system for monitoring networks that don’t need agents to run. Get a 30-day free trial.
- Datadog Provides powerful distributed tracing capabilities.
- Amazon CloudWatch Performs deeper code debugging, lets you monitor code metrics and view logs.
- Lumigo A serverless intelligence platform that will assist developers in understanding and troubleshooting their serverless apps.
- Epsagon This serverless monitoring and troubleshooting platform does not require a server based on the distributed tracing principle.
- AppDynamics Use this cloud-based monitoring package to track the performance of your serverless accounts and the microservices that run on them.
- Catchpoint Application Experience This platform is focused on performance monitoring for websites and it tracks the activities of microservices in support of that aim.
- Dashbird A tool created specifically for Lambda deployments that centralizes all the information in one place: the logs, analytics, and traces.
- New Relic A tool that helps with tracking and diagnosing problems in Lambda, which has been improved with a new framework and provides faster response times.
What is serverless Monitoring?
Serverless computing is a cloud-based computing approach where the cloud provider operates the server and allocates machine resources dynamically. The use of serverless computing can speed up innovation and lower operational costs. In summary, serverless monitoring tools enable administrators to keep track of their apps and services.
AWS uses backend infrastructure and networks to create serverless offerings. When you hear the term serverless, it does not indicate that you don’t need to supply your server for hosting; it simply means you aren’t required to provide a server. Using a serverless monitoring solution is the best way to minimize expenses and improve the performance of your apps.
Overall, you need a solution to monitor serverless applications across different functionalities and create accurate data without affecting the application’s functionality or speed. We’ll take a look at some of the most effective serverless monitoring tools available nowadays.
Why do we need “Serverless monitoring”?
- Serverless monitoring enables your systems to provide data that you may use to understand how they work. Many essential parameters, such as latency, prices, resource utilization, and cold starts, maybe tracked using serverless monitoring tools.
- A competent serverless monitoring tool will spot application failures in real-time and route them to the appropriate channel. Unfortunately, you’ll find that it’s not easy to keep track of your serverless architecture, as it has a proprietary character that prevents you from knowing too much about the underlying code.
Challenges associated with serverless monitoring
Let’s talk about the common errors that people encounter when using serverless and how to avoid them. New adopters frequently face concerns with control, security, architectural complexity, and monitoring and testing. Let’s take them one by one and see how we can best solve their obstacles.
Loss of Control
An issue with serverless is the loss of control. So, what? In serverless applications, we often integrate third-party managed services (BaaS—backend as a service) and function platforms (FaaS—functions as a service). Third-party developers and operators run these BaaS and FaaS. In a non-serverless world, we take over the entire stack, including which software versions go into each service. Then we write queues and databases. We lose control as we migrate to serverless because we no longer own the software stack our services run on. The good news is that we can devote more time and energy to providing business value.
- Solution: A risk evaluation is essential if you are worried about losing control of your infrastructure. This can help you assess what matters most to your company and how losing control might impact it. Using a third-party authentication system provides the same (if not more) value as creating your own. Remember that if you write a system yourself, you must own and maintain it for its entire life.
Security
Poorly configured applications are a significant serverless danger. Poor configuration can lead to many problems, including security ones. For example, if you use AWS, you must correctly configure your services’ rights to access other AWS services. A function, for example, may be granted more privileges than it needs, allowing for a security violation. In addition, since cloud security mechanisms cannot be transmitted outside the cloud, we must ensure that any HTTP connections to third-party services are secure and the data is encrypted.
- Solution: The most important thing is to provide your AWS resources with the correct permissions so they can do their jobs. Give your functions the exact permissions they require and provide them with strict permissions. Then encrypt all your data at rest. Additionally, ensure that third-party connections are made through a secure connection.
Architecture Complexity
Even the most straightforward serverless application has a complex architecture diagram. Generally, function code is short and does just one thing, leading to many functions per application. We also employ managed services for several tasks. Combining these two factors tends to complicate architecture. The architectural level of an application’s complexity is then increased. You must follow solid architectural patterns, or you will end up with complicated architecture.
- Solution: The simplest method for preventing architectural complexity is to learn distributed system design. Understand how to construct event-driven apps using the most prevalent architectural patterns and understand how to use asynchronous messaging to add extra features to your applications. In a distributed system, asynchronous messaging is more efficient than synchronous messaging. It is critical to understand how services interact, how latency affects requests, and where bottlenecks exist. Changing the architecture can sometimes increase the performance of all programs.
Difficult to Test
Serverless apps are difficult to test due to their distributed nature. Developers prefer local testing because they were used to it before serverless was accessible. However, local tests are complicated in the serverless era since we need to imitate cloud services locally. One of the significant hazards in non-serverless apps is in the code. Configurations and integrations are the most significant dangers in serverless apps. So we must also execute a sufficient number of integration tests.
- Solution: Finding a suitable monitoring tool that works for your application is critical to overcoming monitoring challenges. There are several unique features. Having a monitoring service that supports the ELK Stack, visualizes the various logs and metrics (from resources and functions), and provides distributed tracing is widely regarded as the industry standard. In addition, the most advanced tools will already have serverless integrations like Lambda.
Difficult to Monitor
Our system is challenging to monitor for the same reasons it is difficult to test. The tools and methods of tracking serverless apps are still a long way from perfection. Such a task is far more complicated than expected. Unlike traditional applications, where we only monitor code execution, serverless apps require us to monitor service integrations and ensure that we can track a request from start to finish in our distributed system.
- Solution: To overcome the challenges of testing serverless apps, it is critical to properly build your application to unit-test the business logic and create cloud integration tests.
The Best Serverless Monitoring Tools
1. ManageEngine Applications Manager – FREE TRIAL
ManageEngine Applications Manager is able to monitor the serverless systems of AWS Lambda, AWS SQS, and also DynamoDB, Oracle Autonomous Database, and Node.js. The tool discovered all linked applications, so it will identify the microservices that you host on your serverless accounts and include them in its monitoring services. The applications that you build on serverless-hosted microservices might also call externally-hosted functions and the system will identify those as well. This investigation results in an application dependency map, which draws all of the relationships between functions and supporting services. The Applications Manager will also discover all of your other applications, services, and hosts and include those in the applications dependency map.
Some key features of ManageEngine Applications Manager are:
- Discovers and maps microservices, linking monitoring to serveless hosting
- Records the number of cold starts and their duration
- Track the number of invocations of each function alerting if the maximum allowed is approached
- Error tracking and alerts for an excessively high rate
- Account resource capacity management
- Memory activity monitoring
- Tracks servers and cloud platforms across the network and the internet rather than just the system on which it is installed
- Provides platform service level checks
- Alerts by SMS, email, Slack, and Service Desk ticketing
- A free edition to track up to five assets
- Track applications and services on Windows Server, Linux, AWS, Azure, Google Cloud Platform, and Oracle Cloud Infrastructure
Why do we recommend it?
ManageEngine Applications Manager includes distributed tracing and code profiling for microservices. The system also records delivery performance for serverless systems on AWS, Azure, GCP, and Oracle Cloud. It is particularly good at timing cold starts on each platform. You also get monitoring services for traditional, hosted applications with this package.
Who is it recommended for?
This is a big package that is delivered as software. You can run the package on AWS or Azure, so you aren’t limited to hosting the software yourself. The on-premises options are for Windows Server and Linux. Small businesses can use the Free edition to monitor up to five assets.
Pros:
- Monitors cloud serverless accounts even when running on premises
- Tracks all invocations through their lifecycles
- Measures cold start time and will raise an alert for lengthy starts
- Error rate alert thresholds
- Application dependency mapping to identify root cause for performance problems
Cons:
- Not a SaaS package
You can assess ManageEngine Applications Manager with a 30-day free trial.
2. Site24x7 – FREE TRIAL
Site24x7 APM is a cloud-based application performance monitoring service that can trace serverless systems. It can track Java, .NET, and Node.js modules. But Site24x7 doesn’t say which monitoring standards it uses. The APM scans apps, mobile apps, and websites for serverless systems APIs. Site24x7’s distributed tracing effort is incorporated into the application dependency maps it plots for all standard applications.
Here are the features of Site24x7’s serverless monitoring:
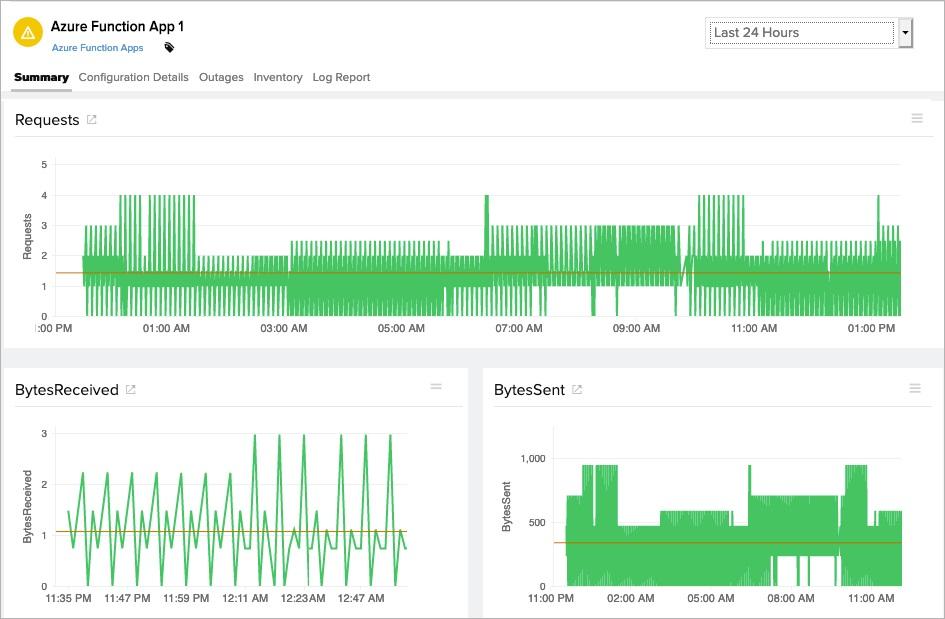
- It provides real-time performance monitoring for Azure, AWS, and Google Cloud.
- It keeps track of total requests, including bytes delivered and received.
- It uses performance counters to make app development more straightforward.
- Displays the application’s uptime status.
- Measures a variety of variables, including code execution time, faults, and other parameters.
- It measures crucial performance parameters like errors, throttles, and latency.
- Ensures peak cloud infrastructure performance.
- Its AI system swiftly pinpoints a problem’s core cause so you can address it.
- Auto-resolves resource issues.
- It ensures complete transparency.
Why do we recommend it?
Site24x7 is a cloud-based monitoring platform that has strong capabilities for monitoring serverless accounts. The cloud monitoring service covers AWS, Azure, and GCP. IT will track activities on AWS Lambda and AWS Fargate, Azure Functions, and Google Cloud Functions. The platform’s APM provides distributed tracing and code profiling for Web applications.
Who is it recommended for?
The Site24x7 APM plan includes platform and network monitoring plus Web performance testing functions. You can opt for hourly pricing instead of the standard monthly or yearly subscription rate. The charge rate isn’t per server but per application with the base package covering three. Any size of company would benefit from this package.
Pros:
- One of the most holistic monitoring tools available, supporting networks, infrastructure, and real user monitoring in a single platform
- Uses real-time data to discover devices and build charts, network maps, and inventory reports
- Platform is intuitive, little training is needed to get fully functional
- User monitoring can help bridge the gap between technical issues, user behavior, and business metrics
- Supports a freeware version
Cons:
- Is a very detailed platform that will require time to fully learn all of its features and options
The Site24x7 dashboard displays the current operational status of each module involved in delivering an API request. First, the dashboard displays the complete serverless operation, segmented into components. After that, each module in the chain tool is shown. You can start with a 30-day free trial.
3. Paessler PRTG Network Monitor – FREE TRIAL
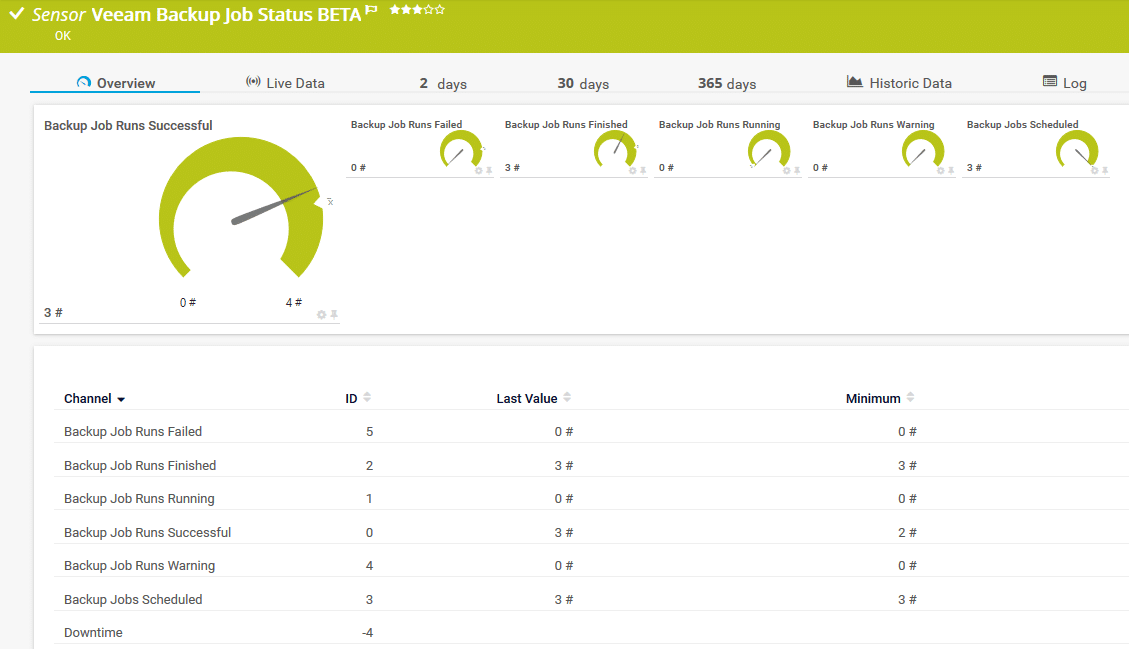
The Paessler PRTG Network Monitor is a software-based system for monitoring networks that don’t need agents to run. Agentless means that it doesn’t need to have proprietary software operating on the devices and systems being monitored. Germany-based Paessler GmbH has given us the tool for the past 15 years, which has been with us the entire time. The PRTG Network Monitor can be used to monitor virtually any network device, including routers, switches, access points, software, and cloud-deployed systems. That includes any network-based software, servers, services, storage, and even the end-desktop. User’s Many tools cannot provide multiple valuable benefits, including increased visibility, usability, and scalability.
Some key features of PRTG are:
- Many network servers and network devices (such as network servers) have built-in sensors.
- An interface that is both clean and sleek.
- Customizing sensors to detect specific thresholds or things is simple.
- In terms of user comprehension, this is simple to grasp.
- Good permissions functionality, allowing remote users to log in securely.
- The tree interface enables settings and permissions to be inherited.
- Flexible notification/threshold features.
- Plenty of monitoring possibilities.
- The ability to update, deploy new probes, reposition and clone sensors are simple to accomplish.
- QR codes for specific devices or sensors can be printed and affixed to physical hardware for mobile monitoring in the data center.
Pros:
- Uses a combination of packet sniffing, WMI, and SNMP to report network performance as well as discover new devices
- Autodiscovery reflects the latest inventory changes almost instantaneously
- Drag and drop editor makes it easy to build custom views and reports
- Supports a wide range of alert mediums such as SMS, email, and third-party integration
- Supports a freeware version
Cons:
- Is a very comprehensive platform with many features and moving parts that require time to learn
You can figure out your network requirements by downloading a 30-day free trial.
4. Datadog APM
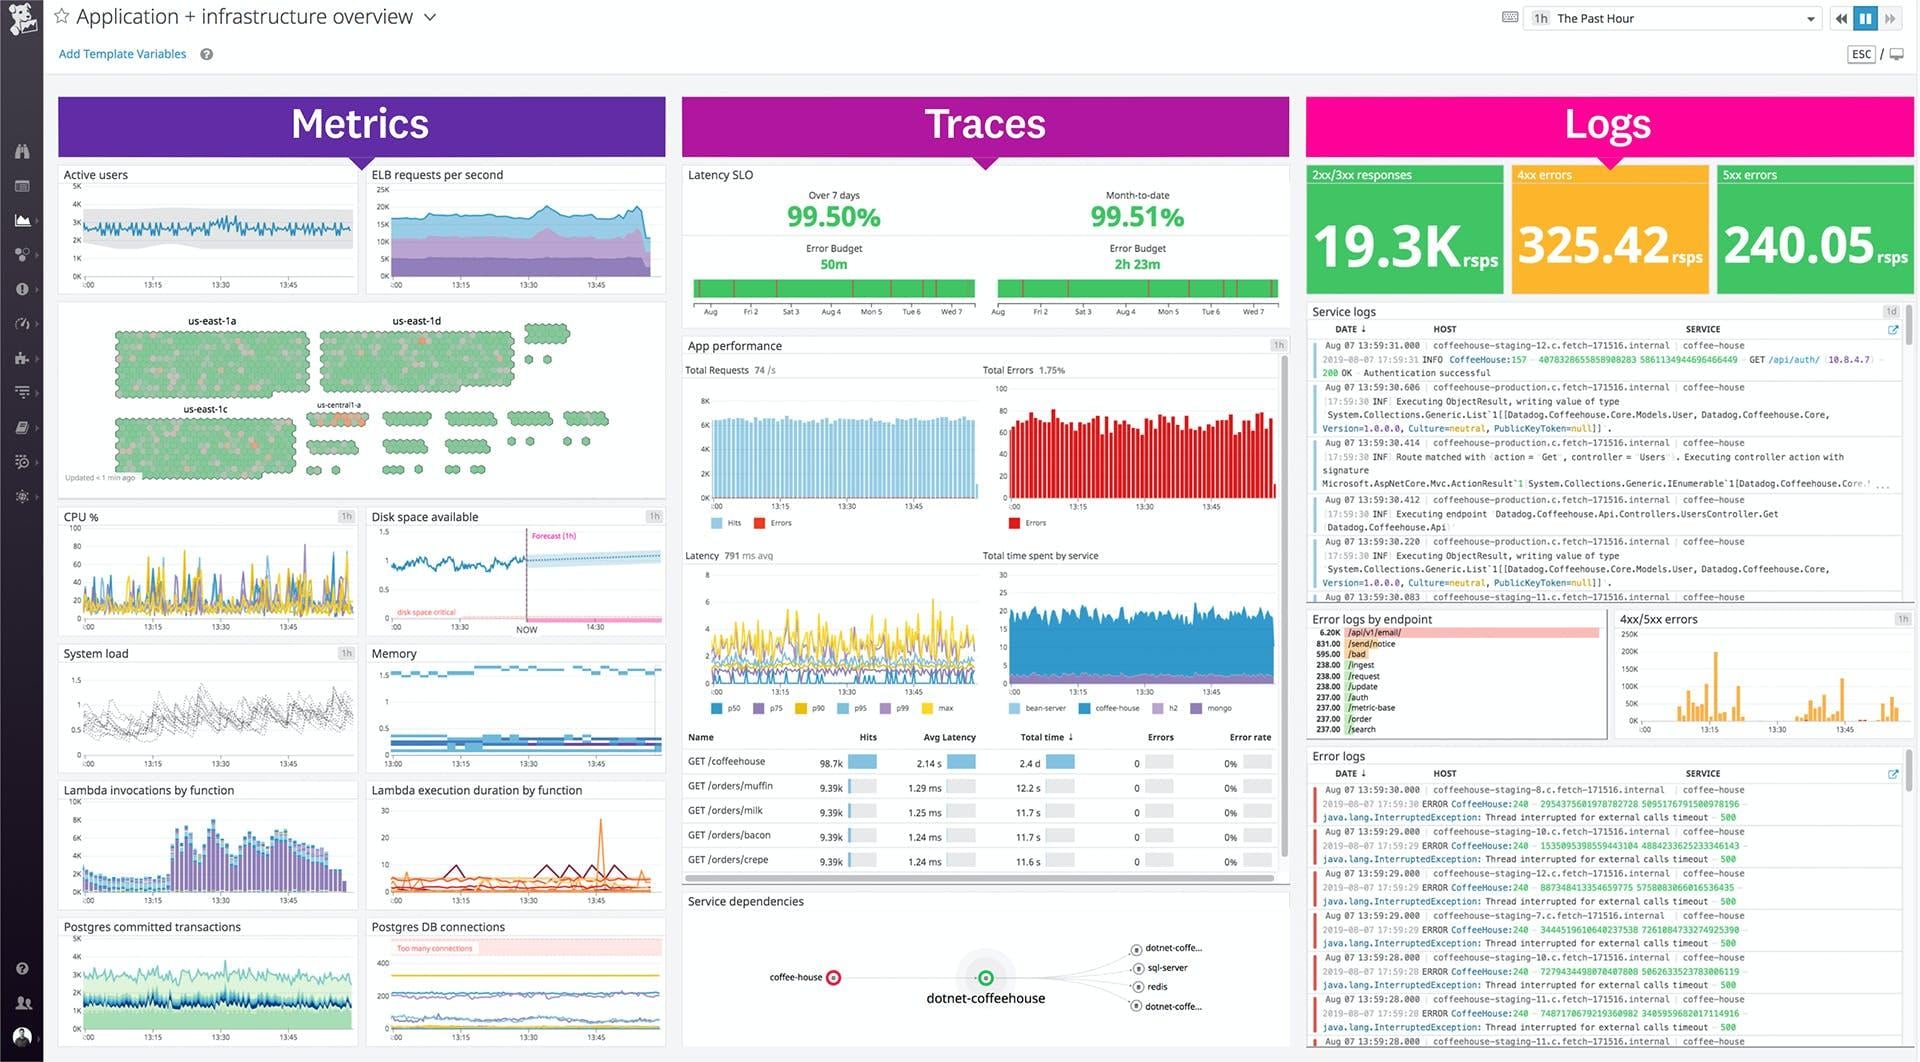
Database performance monitoring tool Datadog APM provides powerful distributed tracing capabilities. Distributed tracing uses two essential message standards. First, a microservice developer understands how to send status messages in a specified format. Second, monitors are held to the same high standards. For example, OpenTracing and OpenTelemetry are open protocol standards, and the Datadog APM framework employs both of them.
Some more features of Datadog APM are:
- Datadog automatically detects all serverless functions, allowing administrators to monitor and debug APIs, queues, databases, and more from a single platform.
- Business metrics can be gathered straight out of the box, without any configuration, and without any involvement needed unless custom metrics monitoring is necessary.
- It captures critical serverless data to detect and handle incidents occurring anywhere in the service architecture, including serverless functions, containers, and VMs.
- Amazon DynamoDB, S3, EC2, ECS, API Gateway, and Kubernetes are many popular services that Datadog can monitor.
- It can track microservice calls across a stack, providing end-to-end insight.
- Datadog may also map these distributed microservices with tags like functions, customers, versions, and more.
- If an unhandled exception, error, or crash occurs, it can be isolated and traced to the source logs and metrics.
The ability of Datadog APM to process both telemetry standards increases the likelihood of tracking any serverless system encountered. However, in reality, microservices developers only care about these two logging standards.
Why do we recommend it?
Datadog APM is a comprehensive monitoring package for Web applications and microservices. Datadog is very similar to Site24x7 in that it is a cloud platform with a series of specialized monitoring modules. Datadog charges separately for each module and you will need the Infrastructure module to track your serverless cloud accounts.
Who is it recommended for?
Datadog offers six plans for its APM, which are all priced per host. This could work out expensive if your Web applications pull in functions from many different platforms. You can get AWS Farget monitoring as an add-on to the APM. For other platforms, you will need the Infrastructure Monitoring package.
Pros:
- Easy-to-use customizable dashboards
- Cloud-based SaaS product allows monitoring with no server deployments or onboarding costs
- Can monitor both internally and externally giving network admins a holistic view of network performance and accessibility
- Supports auto-discovery that builds network topology maps on the fly
- Changes made to the network are reflected in near real-time
- Allows businesses to scale their monitoring efforts reliably through flexible pricing options
Cons:
- Would like to see a longer trial period for testing
Datadog watches serverless services and generates its reporting comments as well as logs the service’s log messages. So it has two reporting levels. Datadog also has a built-in AWS.
5. Amazon CloudWatch
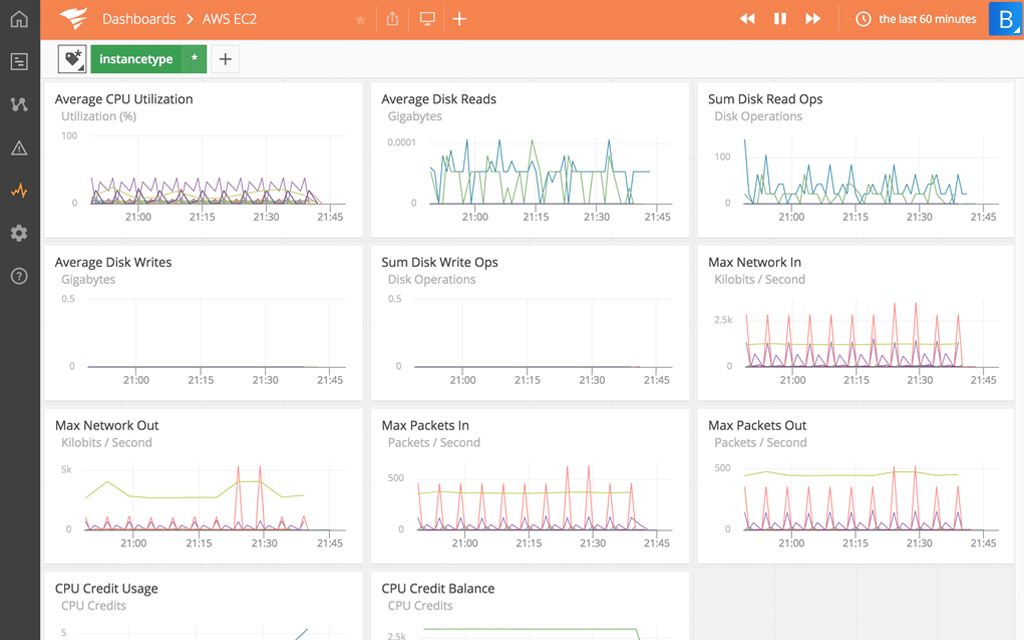
To perform deeper code debugging, Amazon’s CloudWatch tool lets you monitor code metrics and view logs. Amazon CloudWatch is a service geared toward DevOps engineers, developers, SREs, and IT managers who wish to keep their projects organized and in good standing. CloudWatch gives you the tools to monitor your apps, react to global changes in system performance, utilize resources effectively, and get a more cohesive picture of the overall operational health of your infrastructure. The CloudWatch platform collects operational and monitoring data in the form of logs, metrics, and events, giving you a single, comprehensive view of all AWS resources, on-premises servers, and AWS applications and services. CloudWatch may be used to detect abnormal behavior in your environment, create alarms, visualize logs and analytics, and automate various processes, such as troubleshooting issues and finding insights.
Some features of Cloudwatch are as follows:
- Collect and store logs from AWS services, resources, and applications in real-time.
- Without any effort, it gathers default metrics from AWS services.
- Monitor how you are doing by collecting specific analytics from your apps to find patterns, solve problems, and monitor performance.
- It gathers and aggregates container logs and metrics for monitoring and alerting.
- It assembles Lambda metric logs.
- Full visuals and customizable dashboards.
- It helps you visualize your apps and cloud resources, creating reusable diagrams.
- It allows you to receive one alert warning for all issues in an application.
- Set alarms to keep track of operational issues based on correlated data and records.
- It integrates with AWS IAM to control data access. This ensures users’ safety. In addition, CloudWatch Logs use FedRamp and PCI compliance to encrypt data.
Why do we recommend it?
Amazon CloudWatch is the native performance monitor that is offered to all AWS account holders. The package includes a special process for monitoring Lambda, which is called Lambda Insights. There isn’t an equivalent specialization for AWS Fargate, but you can get general activity data, such as usage metrics.
Who is it recommended for?
Amazon Cloudwatch is a good option for businesses that only host their microservices on AWS. If you have a mix of platforms, you wouldn’t limit your monitoring capabilities to AWS by going for Cloudwatch. The system has a Free Tier, which will provide enough capacity for low-volume applications.
Pros:
- Native to AWS ecosystem
- Supports a wide range of AWS itegrations into services like AWS IAM
- Provides a single pane to view your ecosystem
- Offers simple reporting, alerts, and data visualization
Cons:
- Better suited for small to medium-sized networks
6. Lumigo
Lumigo is developing a serverless intelligence platform that will assist developers in understanding and troubleshooting their serverless apps. In addition to analyzing massive volumes of data, the platform learns the expected behavior of the serverless application. It generates real-time visual maps and insights that allow developers to identify and fix serverless app issues before manifesting themselves.
Some of the salient features of Lumigo are:
- Construct a virtual stack of all transaction services.
- A visual map has been created for each service, making it easy to locate and sort them.
- In addition, you don’t have to alter a single line of code.
- It helps the user see everything they’re dealing with, including Lambdas, API calls, external SaaS services, and anything else.
- Performs the execution of every service from beginning to conclusion.
- It makes predictive analysis possible with machine learning.
- It works on every scale.
- Assesses the effect of deployments by contrasting the previous and present states.
Why do we recommend it?
Lumigo is an attractive system analysis and performance monitoring service for serverless-based microservices and also container-delivered packages. The interface for this tool is very attractive and it shows a service dependency map with system errors highlighted. Clicking on a unit gets a code view of the asset, enabling analysis.
Who is it recommended for?
You would need programming skills to get the most out of Lumigo. It goes right down to code level and that feature would be completely wasted on a non-technical consumer of a Web application. So, this package is designed for the DevOps teams that write and support Web applications.
Pros:
- Minimalistic interface – very clean and scalable
- Offers simple network maps to help view assets and troubleshoot
- Can process and sort large amounts of data
Cons:
- Can take time to fully explore all features
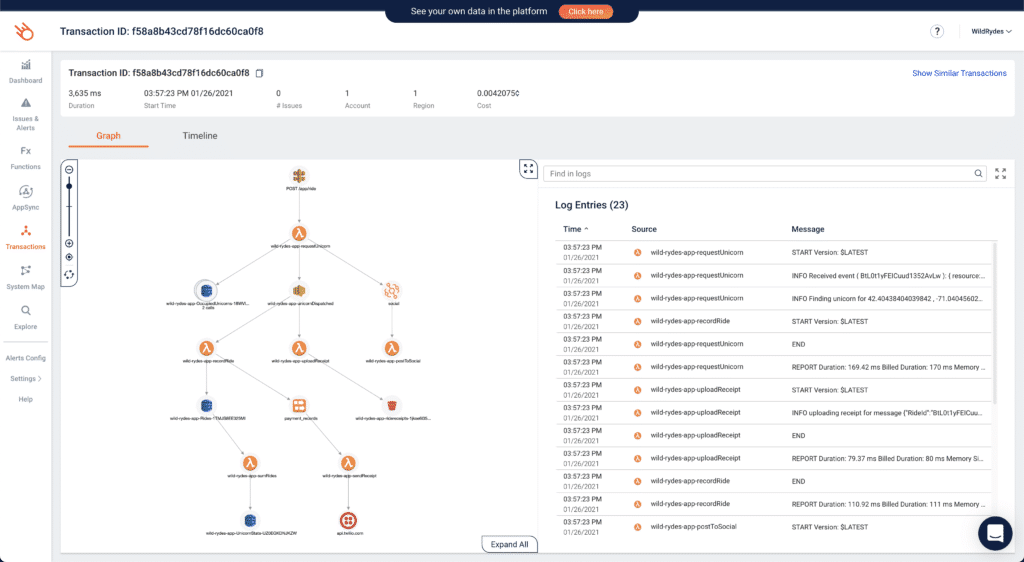
7. Epsagon
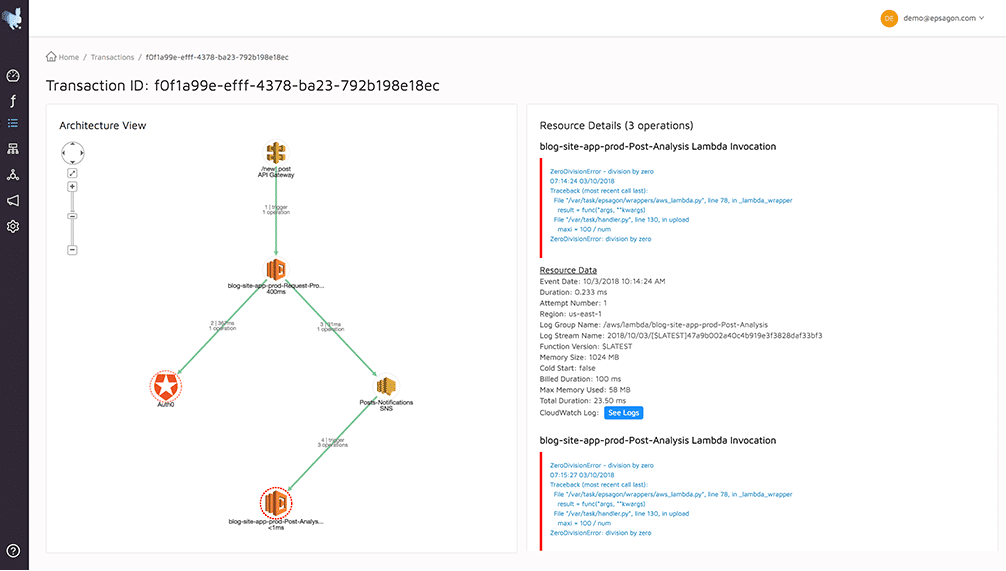
This serverless monitoring and troubleshooting platform does not require a server based on the distributed tracing principle. Instead, Epsagon automatically detects the components of your serverless system and the links that exist between them, offering actionable insights into the logic and business flows of your serverless system. In addition to root cause analysis, Epsagon employs powerful artificial intelligence (AI) approaches to anticipate and prevent any issue from occurring.
The key features of Epsagon are as follows:
- The graphical user interface (GUI) assists you in configuring functions to collect your APM and trace data.
- If a program or function generates an error, automatic log and payload correlation helps you discover why.
- Set up in minutes, with simple connections to most major logging software to let logs and traces work together.
- Maps of the service that have automated and intelligent components can find traffic areas and excessive latency with a bit of help.
- A complete view of the overall application topology.
- Filter on payload data, custom labels, and native tags, among other data.
- Set up predefined dashboards to find faults more quickly with saved queries.
- Find threshold values for every trace by receiving granular alerts.
Pros:
- Automatically scans the networks and collects data and assets
- Provides root cause analysis to improve troubleshooting
- Leverages AI to prevent future issues based on past data
Cons:
- Is more technical than some competing solutions
8. AppDynamics
AppDynamics is an APM that also offers an Infrastructure module. Like AppOptics, if you opt for the APM, you also get the Infrastructure Monitoring unit. This system is able to monitor both on-premises and cloud-based systems but it is much stronger in the cloud realm and Cisco, the producer of AppDynamics is working hard and investing to strengthen that specialization.
The key features of AppDynamics are:
- Covers serverless accounts with its Infrastructure Monitoring unit
- Measures microservices with the APM units on the platform
- Also tracks the activities of containers, including Kubernetes accounts on cloud platforms and on-premises servers
- Identifies network issues that could be causing application delivery failure
- Builds an application and services dependency map
- Observes delivery times and throughput rates for connection between assets
- Color codes the dependency map with traffic light indicators for fast status recognition
- Provides AI-adjusted performance baselines and expectation thresholds that trigger alerts
Why do we recommend it?
AppDynamics is based in the cloud and you install agents on the servers and cloud accounts that you want to monitor. The system can integrate with AWS, Azure, and GCP for serverless monitoring, covering AWS Lambda, AWS Fargate, Azure Functions, and Google Cloud Functions. Important measurements include cold start frequency and timings.
Who is it recommended for?
If you only want to monitor your serverless systems, you could get by with just the Infrastructure Monitoring package on the AppDynamics platform. However, you will probably also want to watch the performance of your microservices and Web applications. In that case, you will need to choose one of the two APM plans. Prices are levied per CPU core.
Pros:
- Automatically detects applications and services
- Creates a constantly adjusted application dependency map
- Provides immediate root cause analysis
Cons:
- Not so strong on network monitoring
You can examine AppDynamics with a 15-day free trial.
9. Catchpoint Application Experience
Catchpoint has created a website performance monitoring platform that includes testing systems, such as synthetic monitoring. The Application Experience module focuses on the activities of your coded assets rather than the activities of visitors, which is dealt with by other modules on the platform. Application Experience also tracks the performance of APIs and mobile apps. It will look at systems running on your servers and on cloud platforms. As the distributed tracing service monitors each microservice, it registers each related function that is called, creating an application dependency map.
Some of the relevant features of Catchpoint Application Experience are:
- Measures invocation and error rates
- Presents activity data in tables and graphs
- Can monitor performance through the development lifecycle
- Implements distributed tracing
- Draws up an application and services dependency map
- Provides code profiling
Why do we recommend it?
Catchpoint Application Experience is in an expansion phase so there will be a lot more functions coming online over the next year. Catchpoint recently acquired Thundra, which is a microservices tracking system. You can use the distributed tracing features of the new service within the Application Experience module to identify application and service dependencies.
Who is it recommended for?
This system is a good choice for companies that run websites. It is also good for those businesses that provide services to other companies through APIs. It isn’t so strong at monitoring the actual serverless platform that microservices run on. However, it could partner well with Dashbird for that service.
Pros:
- Good for spotting errors early during Web application development
- Produces bug reports for rework
- Identifies dependencies
Cons:
- Doesn’t monitor the serverless platforms, just the microservices
10. Dashbird
This tool was created specifically for Lambda deployments. Once Dashbird has been implemented and has begun gathering data, it centralizes all the information in one place: the logs, analytics, and traces. With a single control console, you can easily see all architectural components and applications in action.
Here are some crucial features of Dashbird:
- Observe the entire system with comprehensive coverage.
- It displays metrics and logs together to help you visualize system status.
- Continuously monitors application security and efficiency.
- Aids in compliance.
- Analyzes logs for faults and timeouts.
- presets built-in checks.
- It detects problems before they become major roadblocks.
- A simple UI.
- Watches lambda functions, API gateways, ECS containers, and DynamoDB tables.
- Analyses the impact of architecture and code modifications.
Why do we recommend it?
Dashbird is a platform monitor and it is specifically designed to monitor AWS Lambda. It can also examine the supporting services beneath Lambda and those that interact with systems running on Lambda as long as those other systems are also AWS services. Those other services include RDS, SNS, API Gateway, and ECS.
Who is it recommended for?
You would need to be running all of your microservices on AWS LAmbda to choose the Dashbird package. There is a Free edition of the package that will cover one Lambda account and monitor one million executions per month. You would need to move up to the paid Standard package, which will watch up to 15 million executions. The top plan has no throughput limit.
Pros:
- Sleek and clean interface – highlights key insights well
- Supports end-to-end visibility across your entire ecosystem
- Supports codeless monitoring – great for less technical teams
- Offers a wide range of integrations into cloud environments
Cons:
- Can take time to fully explore all options
11. New Relic
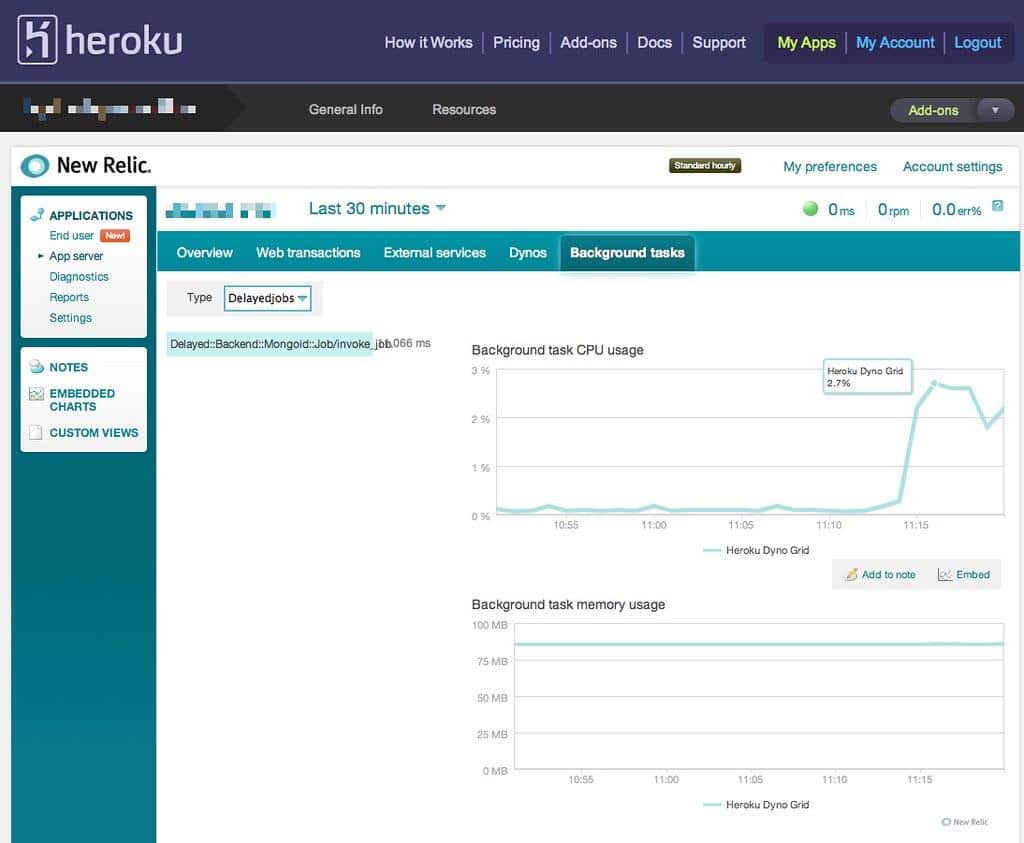
New Relic is a tool that helps with tracking and diagnosing problems in Lambda, which has been improved with a new framework and provides faster response times. It can scan, spot, visualize, fix, and inform you of problems with all your Lambda functions immediately. The drill-down capability lets you get to the Lambda-specific metrics, such as error rate, throughput, and the invocation source data. In addition, the New Relic Distributed Tracing feature has a high cardinality; it can identify strange faults that occur far more frequently.
Some key features of New Relic are:
- Monitors and troubleshoots all serverless functions and microservices in one place.
- Get dynamic real-time insights across the stack to monitor stability even as apps increase quickly.
- The new Relic CLI Installer and Lambda Layer features allow users to quickly auto-instrument serverless services without writing code.
- Filter metrics based on attributes to retrieve rich invocation data.
- Customize notifications depending on invocation criteria.
- Not reliant on AWS data access for Python, Java, or Node.
- Global technical assistance and a strong community.
- an orderly file of all the related data.
Why do we recommend it?
New Relic is a large platform of monitoring services that cover all types of IT systems. The brand is most famous for its APM and that unit is still there. It gives you distributed tracing for your microservices. Look to the INfrastructure Monitoring module for to track the performance of your serverless accounts.
Who is it recommended for?
New Relic can track performance and activity on AWS Lambda, AWS Fargate, Azure Functions, and Google Cloud Functions. You don’t subscribe to individual modulus on the platform – you get the whole lot, which might be too much for some small businesses. New Relic offers a Free Tier that processes up to 100 GB of data per month. All subscribers get that free allowance.
Pros:
- Certified for Microsoft Azure monitoring
- Uses anomaly detection to highlight abnormal behavior in your environment
- Uses simple but intuitive admin dashboards
Cons:
- Better suited for small to medium-sized networks
Conclusion
So, we just reviewed the top ten serverless monitoring technologies and discussed their features. The ease of maintenance and resulting time and effort savings are undeniably a benefit for serverless apps.
However, monitoring is vital with serverless apps. It allows you to monitor their performance and make modifications to improve it. It has specific functionality to monitor and offer value to your organization. Some of them even have specific features to match your needs.
We hope this list helps you get started with serverless monitoring.