Python is one of the most extensively used programming languages due to its simplicity and flexibility. It is compatible with a wide variety of programs and also works in correlation with other programming languages. Much of its ease of use stems from its easy understanding since it is more closely related to everyday languages. As a result, much of the websites and applications rely on Python. Its popularity in the corporate sector is uncontested. Furthermore, it is widely employed in user interfaces, the forerunner of any application or website. In short, python is present almost everywhere.
Here is our list of the best Python Monitoring tools:
- Site24x7 – FREE TRIAL All-in-one cloud-based website performance monitoring solution to keep real-time records of servers, networks, applications, cloud, and user experiences. Start a 30-day free trial.
- ManageEngine Application Monitor – FREE TRIAL An on-premise monitoring tool supported by Windows and Linux. It is a comprehensive tool for monitoring website performance and server resources. Start a 30-day free trial.
- Datadog APM A cloud-based monitoring service that can help users monitor total requests, total errors, latency distributions, and the total number of queries in real time and record it for future consultation.
- Dynatrace A flexible monitoring tool that supports many applications and works well with Python-based code.
- Cisco AppDynamics APM A full-service application monitoring tool compatible with various applications, software, and integrations.
- New Relic APM A full-stack observability platform that can monitor the performance of Python applications and all background processes to help you locate and fix performance issues.
- SolarWinds Observability SaaS This platform offers two plan levels with the lower option being an Infrastructure Monitoring service. It includes that Infrastructure Monitoring service and adds on features such as a code profiler and distributed tracing.
- Prometheus Αn entirely free, open-source, and community-driven monitoring tool that will help you examine Python web applications and generate reports.
- Sentry APM Lightweight and easy-to-use APM allowing you to diagnose, fix, and optimize code performance. You can implement it directly into your Python project.
The wide use of pythons gives rise to specific issues. First, code execution is tough to track among the thousands of lines of code. It is suitable for an automated tool to tackle this issue. Second, resource management is one of the top issues that intimidate developers. Memory is a scarce and limited resource. Memory needs to be appropriately allocated without choking the resource. In Python, a single execution may call many modules at the same time. Also, a single code may be required to run many times in parallel with each other. In addition, more issues persist in the background of the application programming interface (API) that developers must deal with.
Therefore, developers must keep track of the issues mentioned above and solve them. However, it is incredibly time-consuming for developers to manually go through each line of code to sort out the problems. For this purpose, developers rely on automated monitoring tools to keep track of the entire code and alert you of any upcoming issues. The primary purpose of the monitoring tools is to save time and allow the developers to utilize them in other important tasks.
There are several Python monitoring tools, and it is important to choose the one that best fits your needs. This article will give an in-depth insight into the various functionalities of different monitoring tools, allowing you to select the most suitable one.
The Best Python Monitoring Tools
Our methodology for selecting Python monitoring tools and software
We reviewed various Python monitoring tools and analyzed the options based on the following criteria:
- Support for various Python environments
- Ability to schedule or automate processes
- A facility to analyze Python performance over time
- Graphical interpretation of data, such as charts and graphs
- A free trial period, a demo, or a money-back guarantee for no-risk assessment
- A good price that reflects value for money when compared to the functions offered
1. Site24x7 – FREE TRIAL
Site24x7 is an all-in-one cloud-based website performance monitoring solution to keep real-time records of servers, networks, applications, cloud, and user experiences. It is a highly robust tool allowing you complete monitoring tools for your needs.
Key Features:
- Application discovery
- Full stack observability
- Code profiling
- A cloud-based SaaS platform
Why do we recommend it?
Site24x7 is a cloud platform that provides modules of monitoring services for different technologies. It includes an APM that provides distributed tracing and code profiling, which will step through any Python code that it encounters. The profiler will show you each line of Python code as it runs, letting you put in stop points to examine variable statuses.
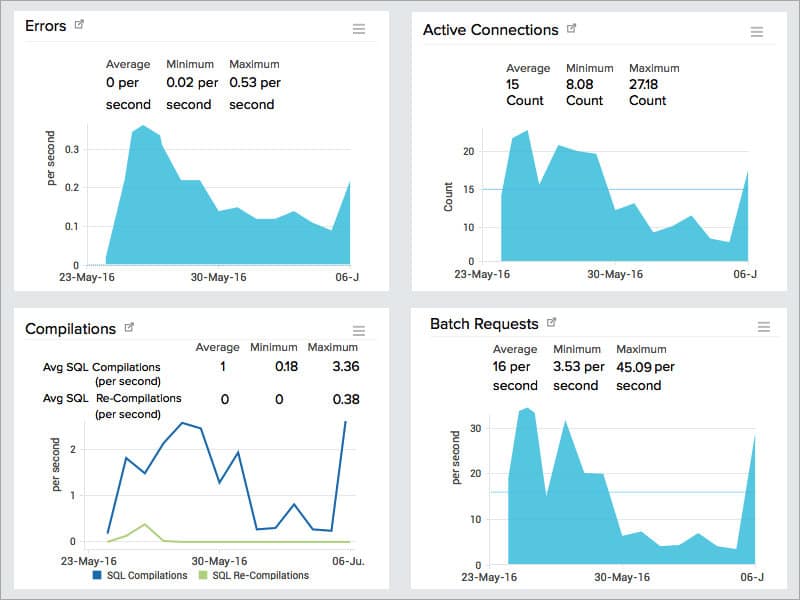
Site24x7 provides a Python agent that will help monitor resource management in Python applications and help you optimize them. It offers a variety of metrics, including response times, errors, throughputs, and more. Also, it features a utility to identify applications and keep track of the interactions between various applications. In addition, a component analysis tool helps you monitor the number of resources utilized by the code. It can also help you in validating Python frameworks and different APIs that you intend to use.
Who is it recommended for?
This platform is suitable for any business that has IT systems to monitor. The APM is included in plans that provide server and network monitoring as well. You also get traditional performance monitoring for hosted applications and website synthetic and real-user monitoring tools. Plans are accessible to businesses of all sizes.
Pros:
- One of the most holistic monitoring tools available, supporting networks, infrastructure, and real user monitoring in a single platform
- Uses real-time data to discover devices and build charts, network maps, and inventory reports
- Platform is intuitive, little training is needed to get fully functional
- User monitoring can help bridge the gap between technical issues, user behavior, and business metrics
- Supports a freeware version
Cons:
- Is a very detailed platform that will require time to fully learn all of its features and options
Site24x7 has four different packages suited to different needs. The cheapest package is the starter package, priced at $9, while the expensive enterprise package is priced at $449. You can start with a 30-day free trial.
2. ManageEngine Application Manager – FREE TRIAL
ManageEngine is another reputed brand when it comes to monitoring tools. ManageEngine Application Manager is an on-premise monitoring tool supported by Windows and Linux. It is a comprehensive tool for monitoring website performance and server resources.
Key Features:
- Application discovery and dependency mapping
- Tracks on-premises and cloud-based systems
- Code profiling and distributed tracing
Why do we recommend it?
ManageEngine Application Manager monitors both hosted and serverless applications. It discovers all of your software and services and creates an application dependency map, which traces all of the connections between systems. It also drills down to server resources. You also get distributed tracing and code profiling for Python and other web application scripting languages.
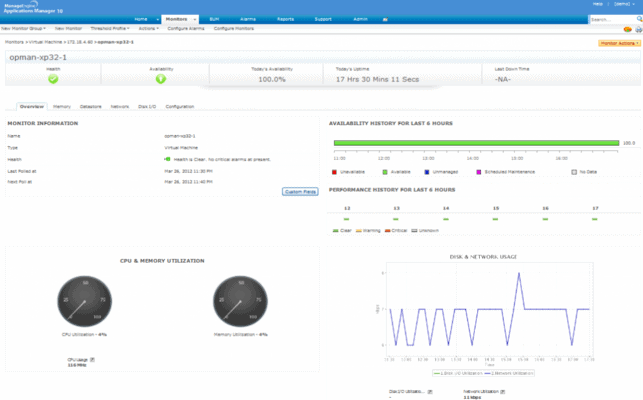
ManageEngine can diagnose full stacks and keep track of performance bottlenecks no matter where they are present. It supports a comprehensive catalog of programming languages, including Python. It has a utility specifically for identifying applications and figuring out links between them. It can also create a visual application dependency map to give you an accurate idea of the systems that call modules and the locations where they are hosted. ManageEngine can also keep track of background API processes. Hence, it can track a code’s execution no matter where the code is hosted. It can also issue alerts whenever an issue arises as well as identify its root causes.
Who is it recommended for?
This is an on-premises package that runs on Windows Server or Linux. There is a free edition for small businesses that will cover five assets, but that doesn’t include the distributed tracing or code profiling features for Python programs. So, businesses of all sizes will need to look at the paid editions.
Pros:
- Offers on-premise and cloud deployment options, giving companies more choices for install
- Can highlight interdependencies between applications to map out how performance issues can impact businesses operations
- Offers log monitoring to track metrics like memory usage, disk IO, and cache status, providing a holistic view into your database health
- Can automatically detect databases, server hardware, and devices in real-time
Cons:
- Can take time to fully explore all features and options available
ManageEngine has three packages. The free version can support up to 5 monitors. The professional edition supports up to 500 applications, and the enterprise edition can support multi-site businesses.
3. Datadog APM
Datadog APM is a cloud-based monitoring service that does not have to be installed on-premise. Datadog can help users monitor total requests, total errors, latency distributions, and the total number of queries in real time and record it for future consultation.
Key Features:
- Code profiling
- Distributed tracing
- A cloud-based SaaS platform
Why do we recommend it?
Datadog APM is a very similar service to the Site24x7 service. However, the Datadog platform keeps expanding and there are options such as security monitoring as well as distributed tracing and code profiling for web applications written in Python. You can get automated full stack monitoring with this platform.
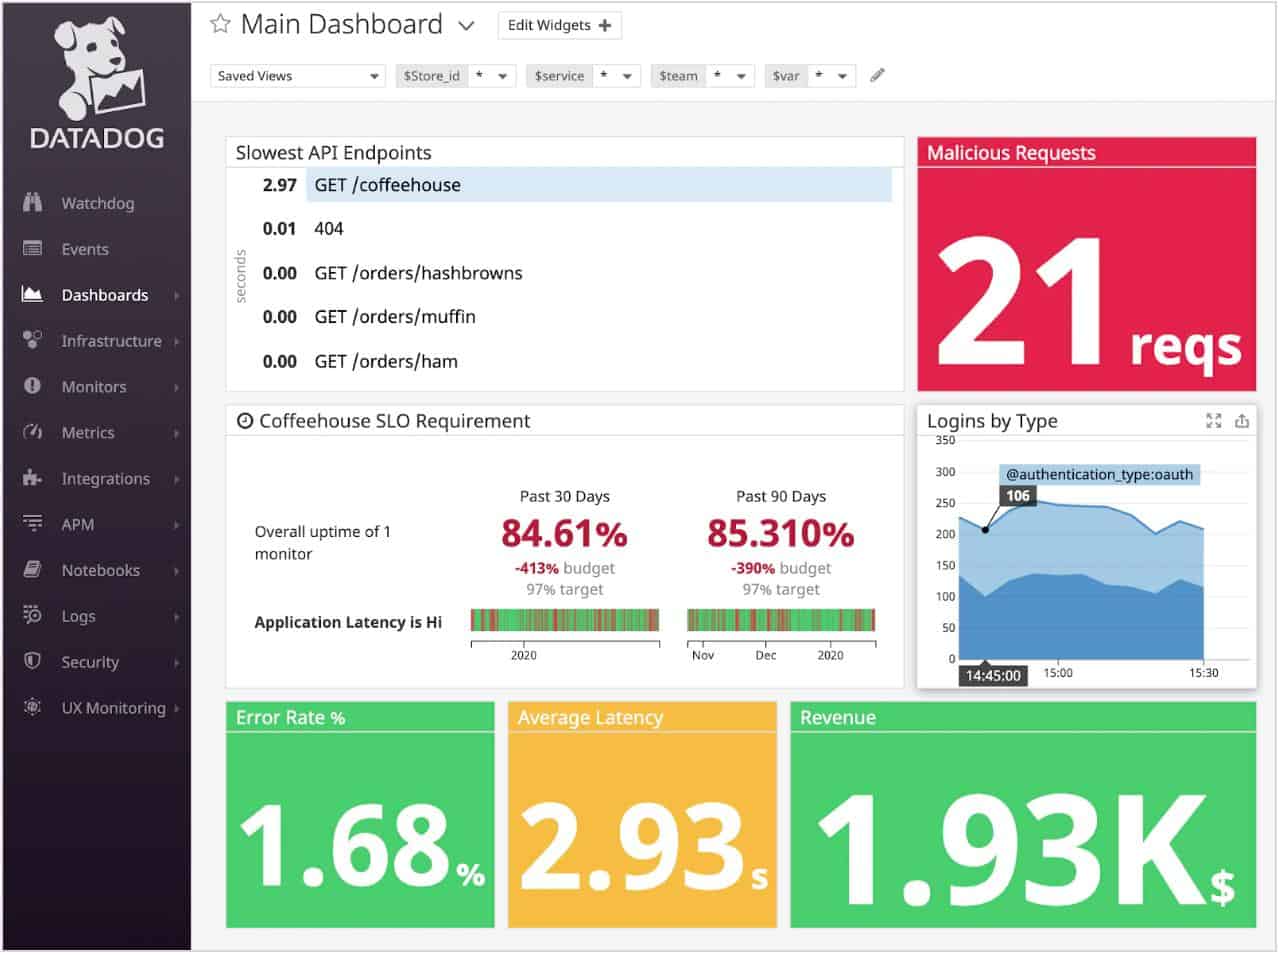
Datadog features a fully customizable dashboard with easy-to-read metrics that are convenient to use. Datadog also features a monitoring utility for codes on websites and servers. It also features a lookup tool for traces. You can search for traces by looking up various tags associated with multiple tracers. This can help you quickly locate problems in your Python code. Moreover, continuous profiling constantly monitors code for issues. When it detects issues, it color-codes them to allow the user to identify them. Memory utilization and high CPU usage are two issues identified by Datadog.
Datadog can also keep track of all API executions, monitoring the executed codes and the programs implementing them. This ensures that the user is always aware of occurring changes. Code tracking services identify linkages between various Python systems, system resources, and programmed modules. It also provides you with relevant insights. You can use Datadog’s synthetics to stimulate traffic on your website and stress test it from the consumer’s perspective.
Who is it recommended for?
Datadog is a flexible system because you choose the units that you need rather than the strategy of Site24x7 that bundles modules into plans. As well as the APM, you will probably need the Infrastructure module, which is the pivotal unit on the Datadog platform. Look at the cloud monitoring options and security monitoring options as well.
Pros:
- Easy-to-use customizable dashboards
- Cloud-based SaaS product allows monitoring with no server deployments or onboarding costs
- Can monitor both internally and externally giving network admins a holistic view of network performance and accessibility
- Supports auto-discovery that builds network topology maps on the fly
- Changes made to the network are reflected in near real-time
- Allows businesses to scale their monitoring efforts reliably through flexible pricing options
Cons:
- Would like to see a longer trial period for testing
Datadog APM offers two packages. APM is priced at $31/host/month while APM + Continuous profiler is priced at $40/host/month. In addition, you can claim a 14-day free trial.
4. Dynatrace
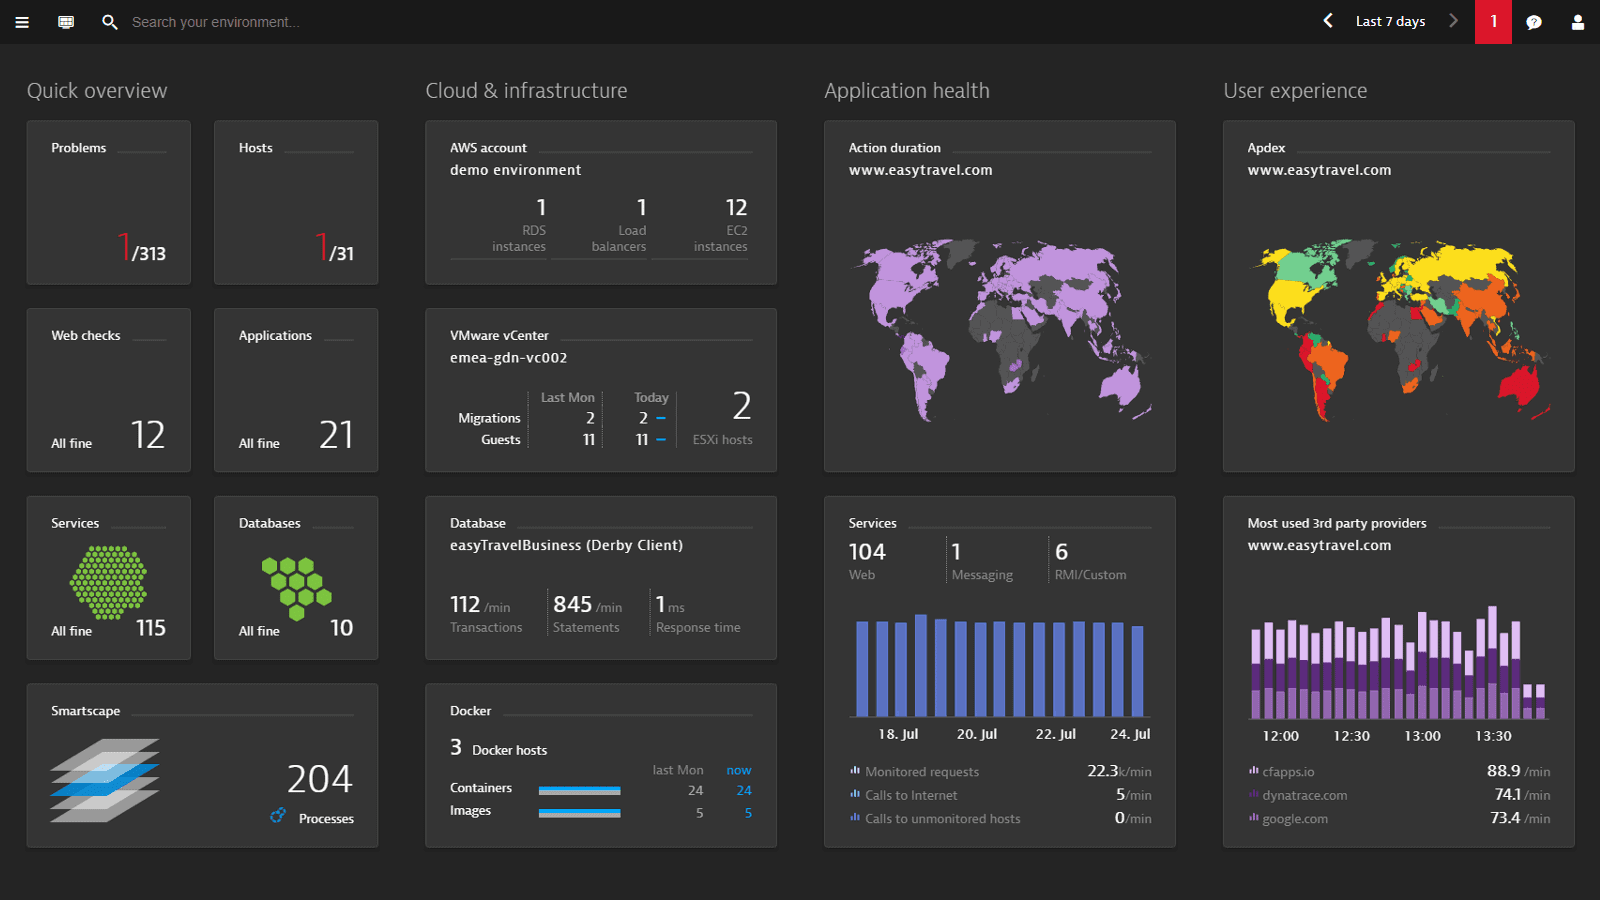
Dynatrace is a flexible monitoring tool that supports many applications and works well with Python-based code. It is an in-depth monitoring tool with easy-to-read visual metrics that will help you optimize your code to the best.
Key Features:
- Infrastructure monitoring
- Full stack observability plan
- Code-level monitoring
Why do we recommend it?
Dynatrace is a SaaS platform of monitoring services that uses AI to discover applications and link their activities together for monitoring and resource requirements forecasting. This platform includes a Full-stack Monitoring package that includes distributed tracing and code profiling for web applications written in Python and other script-based languages.
Dynatrace can automatically assemble all dependent applications and services and display dependencies on a map, allowing users to track issues easily. It relies on smartscape technology to provide comprehensive information about the dependencies. The map provides a transparent overlay of tracers being executed which you can track easily. The map is also interactive allowing you to dive deep into the granular detail.
Dynatrace monitors at the process level enable you to monitor the modules being called on and the processes calling them. Dynatrace also supports a web monitoring tool that displays issues on a geographical map allowing you to account for locations suffering from poor performance or outages.
Who is it recommended for?
The Dynatrace Full-stack Monitoring package is charged for per 8 GiB host per hour. This hourly rate is a charging structure that the users of cloud serverless hosting packages will understand. It also makes the system very scalable and affordable for all sizes of businesses.
Pros:
- Highly visual and customizable dashboards, excellent for enterprise NOCs
- Operates in the cloud, allowing it to be platform-independent
- Can monitor application uptime as well as the supporting infrastructure and user experience
Cons:
- Designed specifically for large networks, smaller organizations may find the product overwhelming
- Offers synthetic monitoring rather than real-user monitoring
The infrastructure monitoring edition is priced at $21/month for 8GB/host. In comparison, full-stack monitoring is priced at $69/month for 8GB/host.
5. Cisco AppDynamics APM
Cisco AppDynamics APM is a full-service application monitoring tool compatible with various applications, software, and integrations. It can provide in-depth insights and plot them on a map to help you easily track issues.
Key Features:
- AI process to track application interactions
- Python profiling
- Error tracking
Why do we recommend it?
Cisco AppDynamics is a very similar package to the Dynatrace platform. This is a cloud SaaS package and it is available in two editions. The company also offers a module for infrastructure monitoring, SAP monitoring, and real user monitoring. The APM service includes distributed tracing and code profiling for Python and other languages used for Web applications.
One of the best features of AppDynamics is its real-time monitoring facility. It can keep track of changes in the codes and notify you of any arising issues. The application also automatically plots the issue on a topology map, assisting you in pinpointing the cause of the issue. The automated mapping can create a map of your entire Python code, allowing you to interact with specific parts of the code.
AppDynamics APM also features a runbook execution feature that executes a particular script whenever a specific condition is met. AppDynamics also notifies you of issues that stem from the code. It keeps track of applications using four levels of health status: critical, warning, normal, and unknown. AppDynamics can also notify you whenever there is a change in the health status of applications or services.
Who is it recommended for?
AppDynamics charges a subscription rate per CPU core per month, so it is affordable for all sizes of businesses. The packages that provide the APM unit also include monitoring for infrastructure and systems such as databases. The tool also includes AI for resource demand predictions.
Pros:
- Tailored for large-scale enterprise use
- Excellent dependency mapping and visualizations to help troubleshoot complex application systems
- Includes a free version
Cons:
- Would like to see more templates for monitoring
AppDynamics comes in four editions: Monitoring, Premium, Enterprise, and Realtime, allowing you to choose the one best suited for your needs.
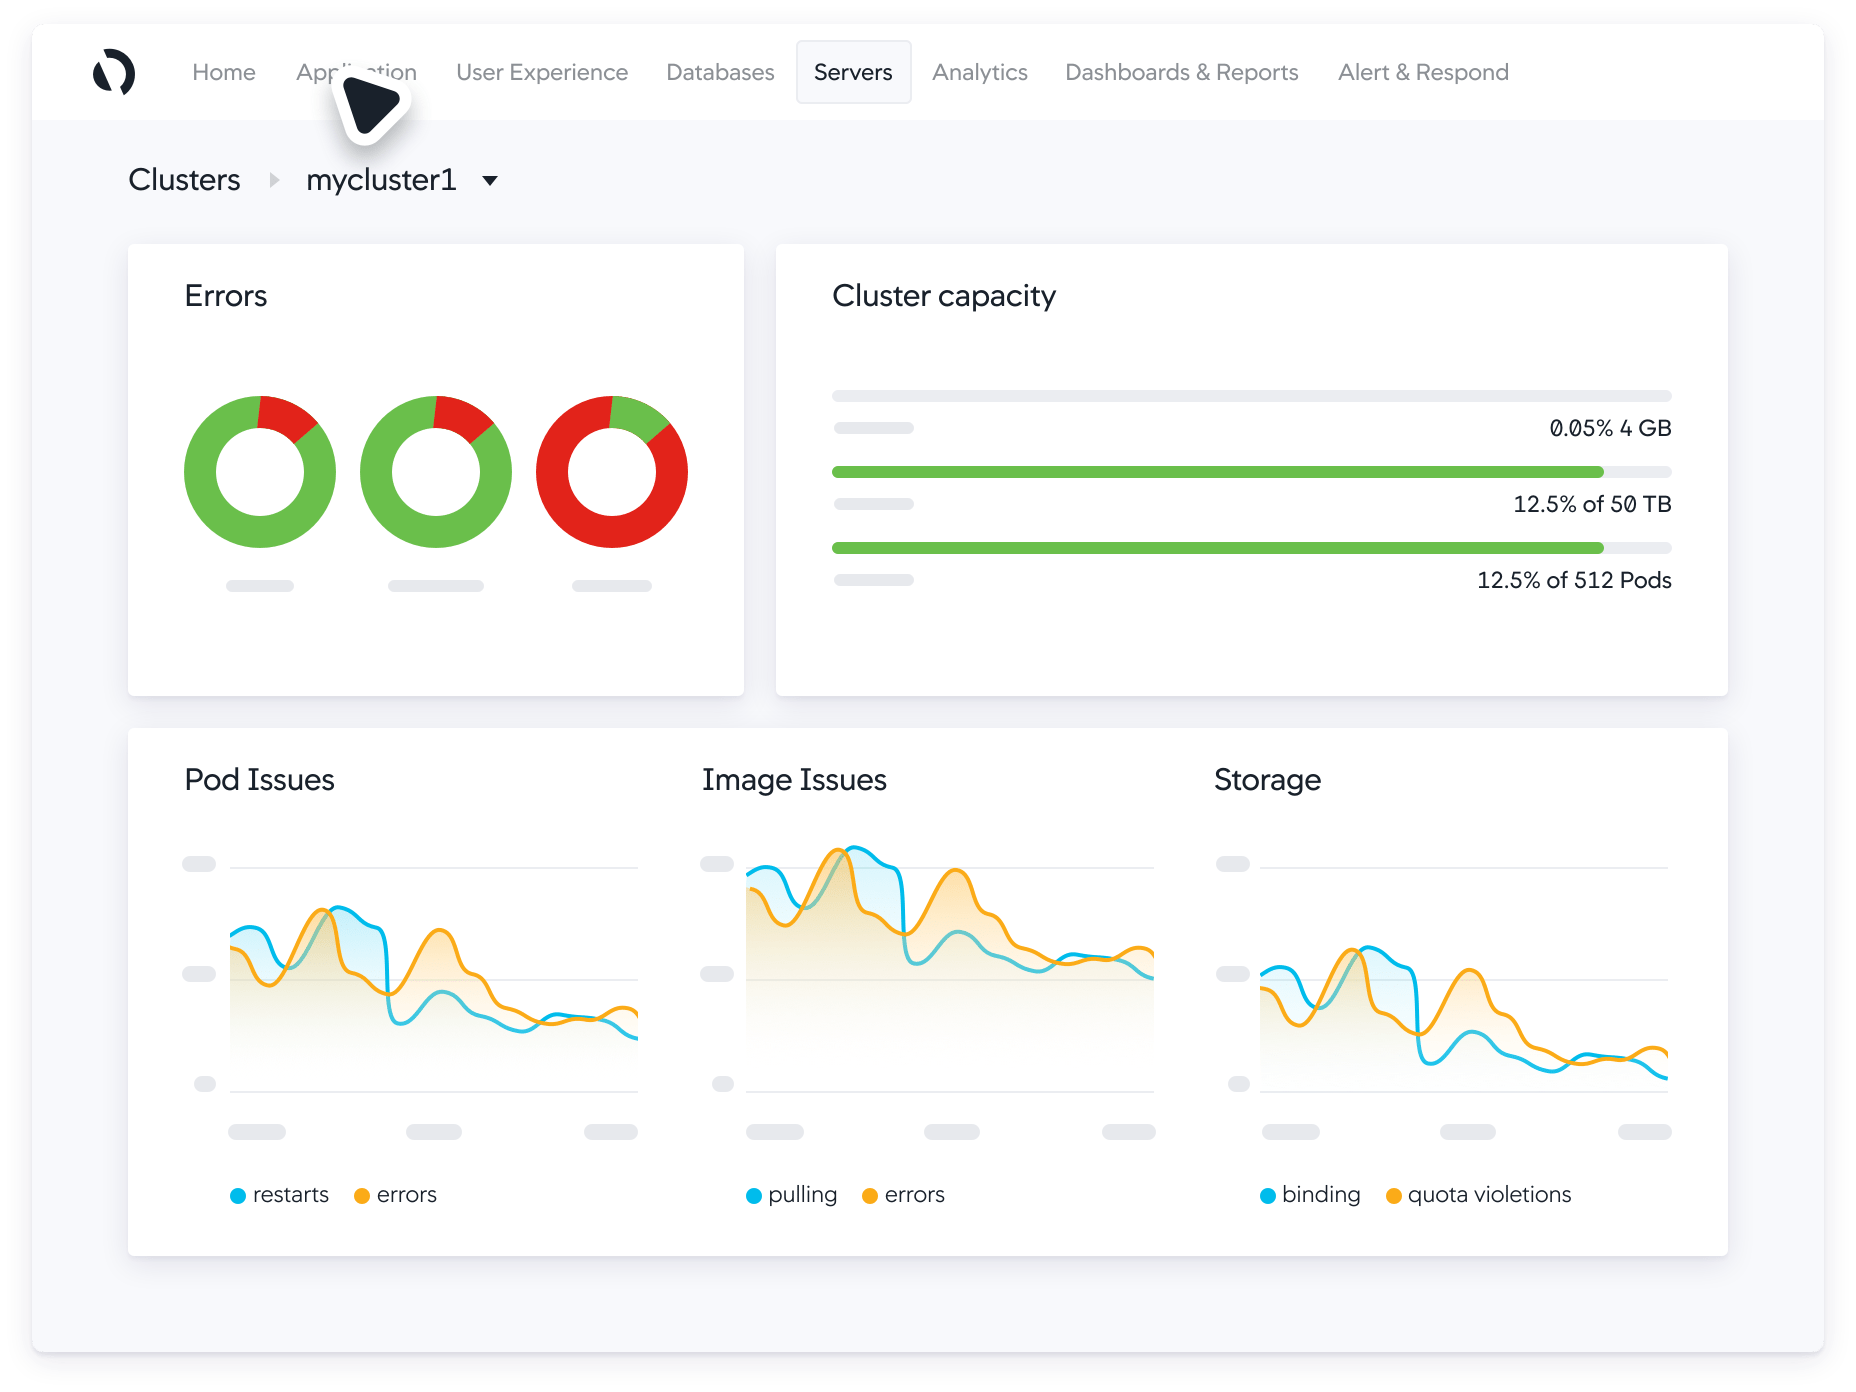
6. New Relic APM
New Relic APM is a full-stack observability platform that can monitor the performance of Python applications and all background processes to help you locate and fix performance issues. Besides providing a general overlay of the underlying problems, it can also offer precise geographical details and insights.
Key Features:
- Full stack observability
- Distributed tracing
- Code profiling
Why do we recommend it?
New Relic APM is a SaaS service from the company that invented the classic APM package with distributed tracing and code profiling. This APM is still available but the company has changed its marketing strategy and provides a vast platform of monitoring services for all IT technologies for one fee. So, the APM is just one module in the package.
New Relic is a utility that collects data about traces, correlates them, processes them using an AI algorithm, and provides you insights. The insights can be both superficials as well as in-depth. For example, it can provide data on response time, web transactions, total requests per minute, and error rates. It can support multiple platforms, including clouds, servers, and even a combination of both.
New Relic’s top-notch APM can aid in comparisons of new code with the older code and highlight all changed fragments of the old code causing issues. It comes with various metrics, but it also provides its users the liberty to create their metrics. Once user metrics are configured, they are seamlessly integrated with the dashboard, allowing you to monitor specific functions of the Python applications. It also features a cross-application trace enabling you to monitor traces across various tiers and services. The gathered information is plotted on a map for easier readability, making the linkages between multiple tiers prominent.
Who is it recommended for?
This is a large platform of monitoring services that would probably be a little too much for small businesses. However, it is ideal for mid-sized and large organizations, particularly those that manage web applications. The APM will track the performance of Python code and other script languages used to construct web applications.
Pros:
- Focused on providing AIOps for websites and mobile apps
- Can identify and alert to SSL, JavaScript, load times, and browser issues
- Ideal for high-traffic websites and services – great for getting better uptime
- Offers a completely free tier
Cons:
- Available only as a cloud service
New Relic has four editions: Free, Standard, Pro, and Enterprise. The pricing tiers are ideal for smaller dev teams.
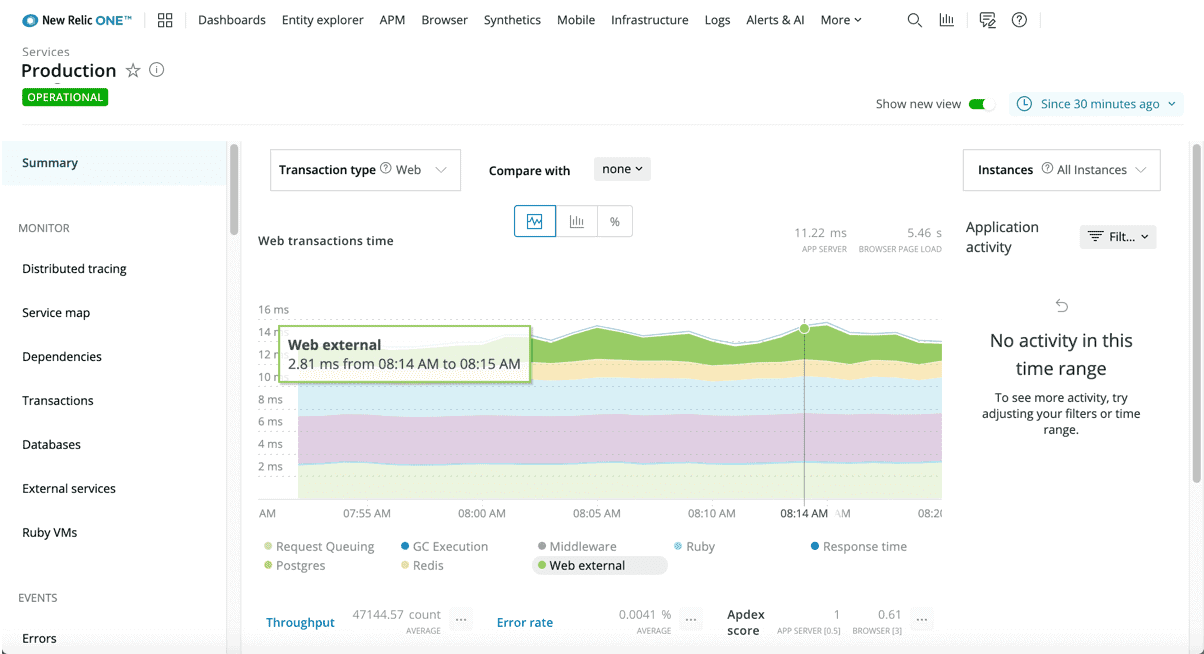
7. SolarWinds Observability SaaS
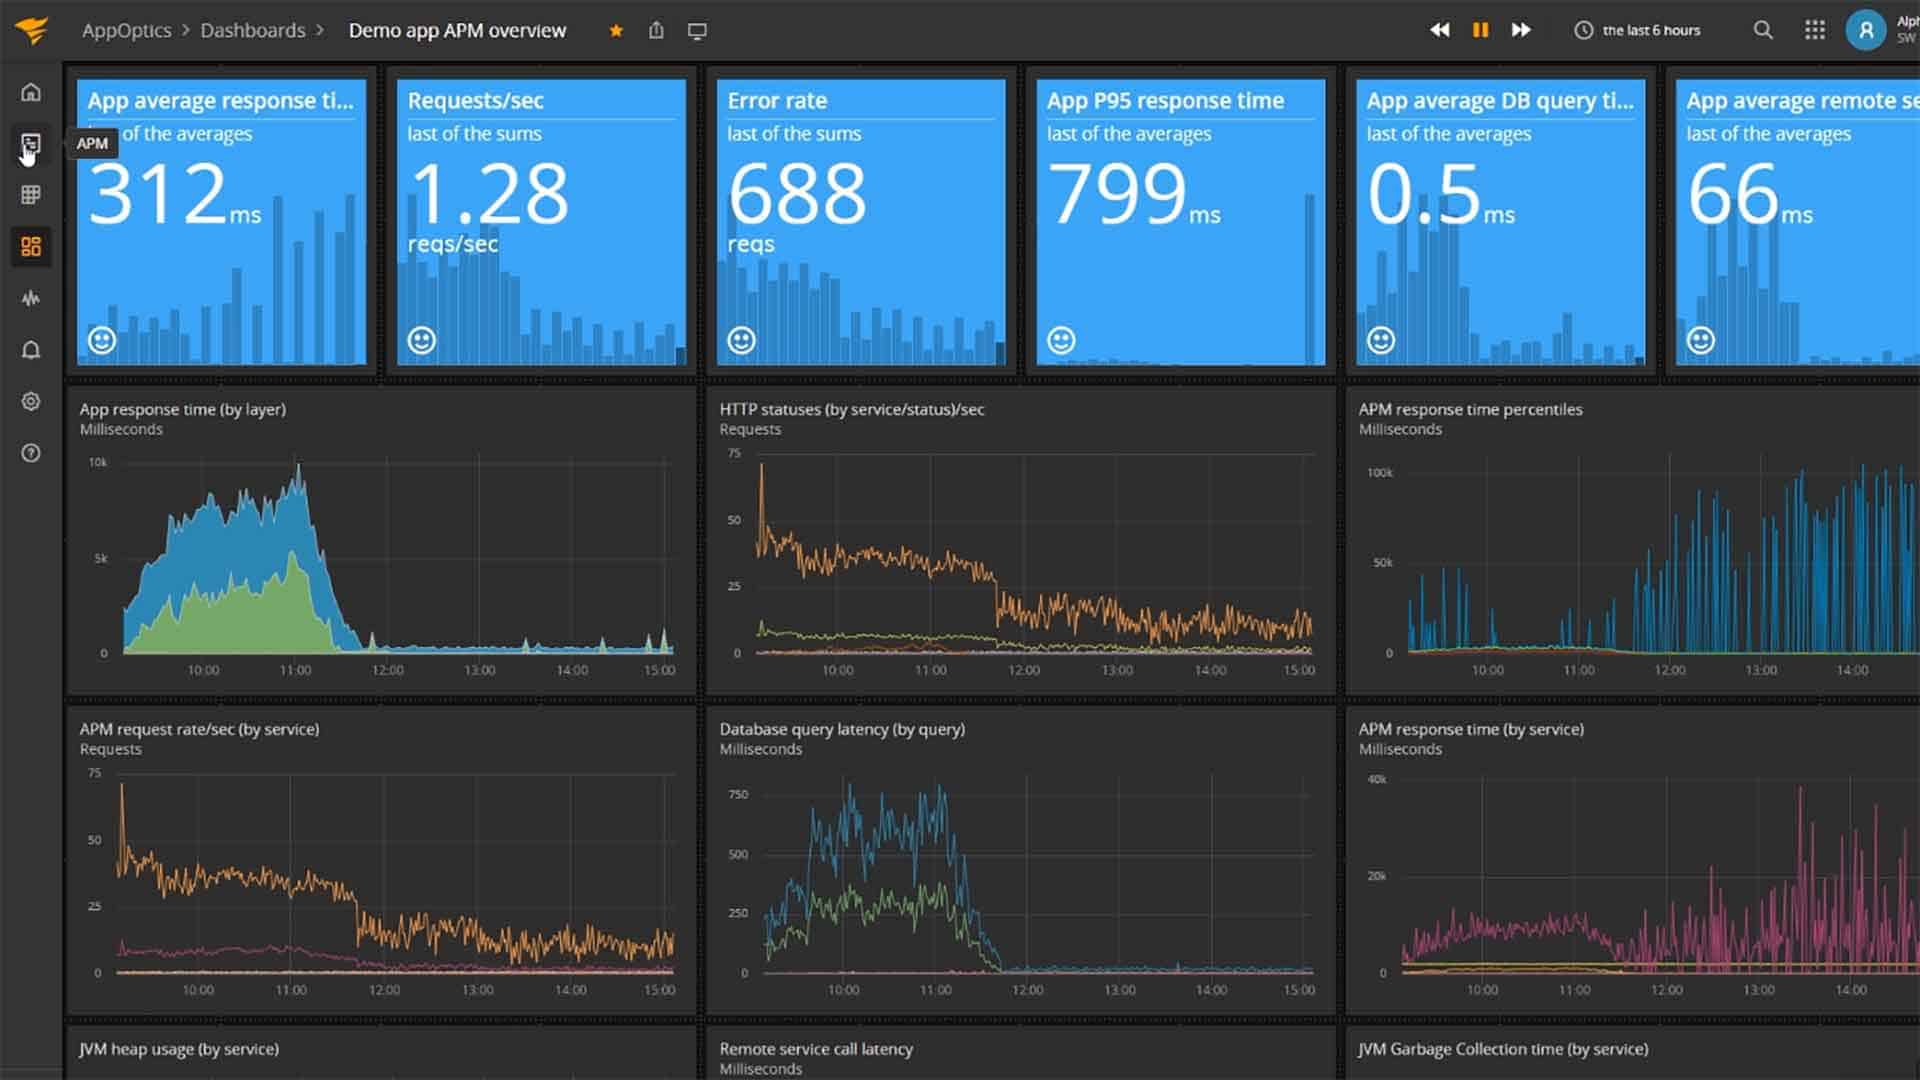
SolarWinds is a well-known company when it comes to monitoring tools. SolarWinds Observability SaaS (formerly AppOptics) is a robust and comprehensive tool that thoroughly monitors Python-based applications and stacks. In addition, this tool is an application performance monitoring (APM) software that will keep track of the performance of codes at the application level and monitor rendering times and errors. It is available as SaaS (Software as a service), which means it does not need to be installed on-premises.
Key Features:
- Application discovery
- A service dependency map
- Infrastructure monitoring
- Distributed tracing
- Code profiling
Why do we recommend it?
SolarWinds Observability SaaS is the upper tier of a two-level service. The lower edition is an Infrastructure Monitoring plan, which looks at services and on-premises applications, such as databases and web servers. The APM adds on distributed tracing and code profiling for web applications.
The tool features more than 150 plugins, allowing you access to numerous metrics and monitoring your Python programs to the granular detail. A tracking function keeps track of codes being executed and traces the execution to the underlying process, exposing the code. Furthermore, the code analyzer examines executable code and keeps track of memory management. It can detect bugs or code insufficiencies. SolarWinds Observability SaaS can conveniently track data logs, including performance, user data, and errors, and even provide insights about the underlying issues.
It features a heavily customizable dashboard that allows you to monitor data in graphs and other metrics. You can even customize your metrics or use default metrics provided by Solarwinds. You can even set thresholds for events or actions and be notified about changes around the events through various mediums.
Who is it recommended for?
You need the APM module of SolarWinds Observability SaaS for code profiling for web applications written in PHP, Python, and other scripting languages that don’t need to be compiled. Web systems that can’t be profiled because they are compiled can be monitored by the APM through distributed tracing or dynamic application security testing.
Pros:
- Offers great visualizations reflecting live and historical health metrics and resource consumption
- Is easily scalable, built as a cloud service
- Tracks all major resources such as CPU, memory, and network usage
- Can monitor Docker, Azure, and Hyper-V platforms, offering more flexibility than competing options
Cons:
- Would like to see a longer trial period
SolarWinds Observability SaaS offers two packages. Infrastructure monitoring is the cheapest package priced at $9.99/host/month. Infrastructure + application monitoring is priced at $24.99/host/month. Unfortunately, python monitoring is only included in the more expensive edition of Solarwinds – see here. You can try SolarWinds Observability SaaS on a fully functional 30-day free trial.
8. Prometheus
Prometheus is an entirely free, open-source, and community-driven monitoring tool that will help you examine Python web applications and generate reports.
Key Features:
- On-premises monitoring package
- Highly customizable
- Works in conjunction with Grafana
Why do we recommend it?
Prometheus is a do-it-yourself application package. Create your own monitoring system with this framework that will run on Windows, Linux, or Darwin. You can use a range of open-source probes and sensors to collect data and feed it into the Prometheus engine. From there, decide how to represent the data in graphs and data tables.
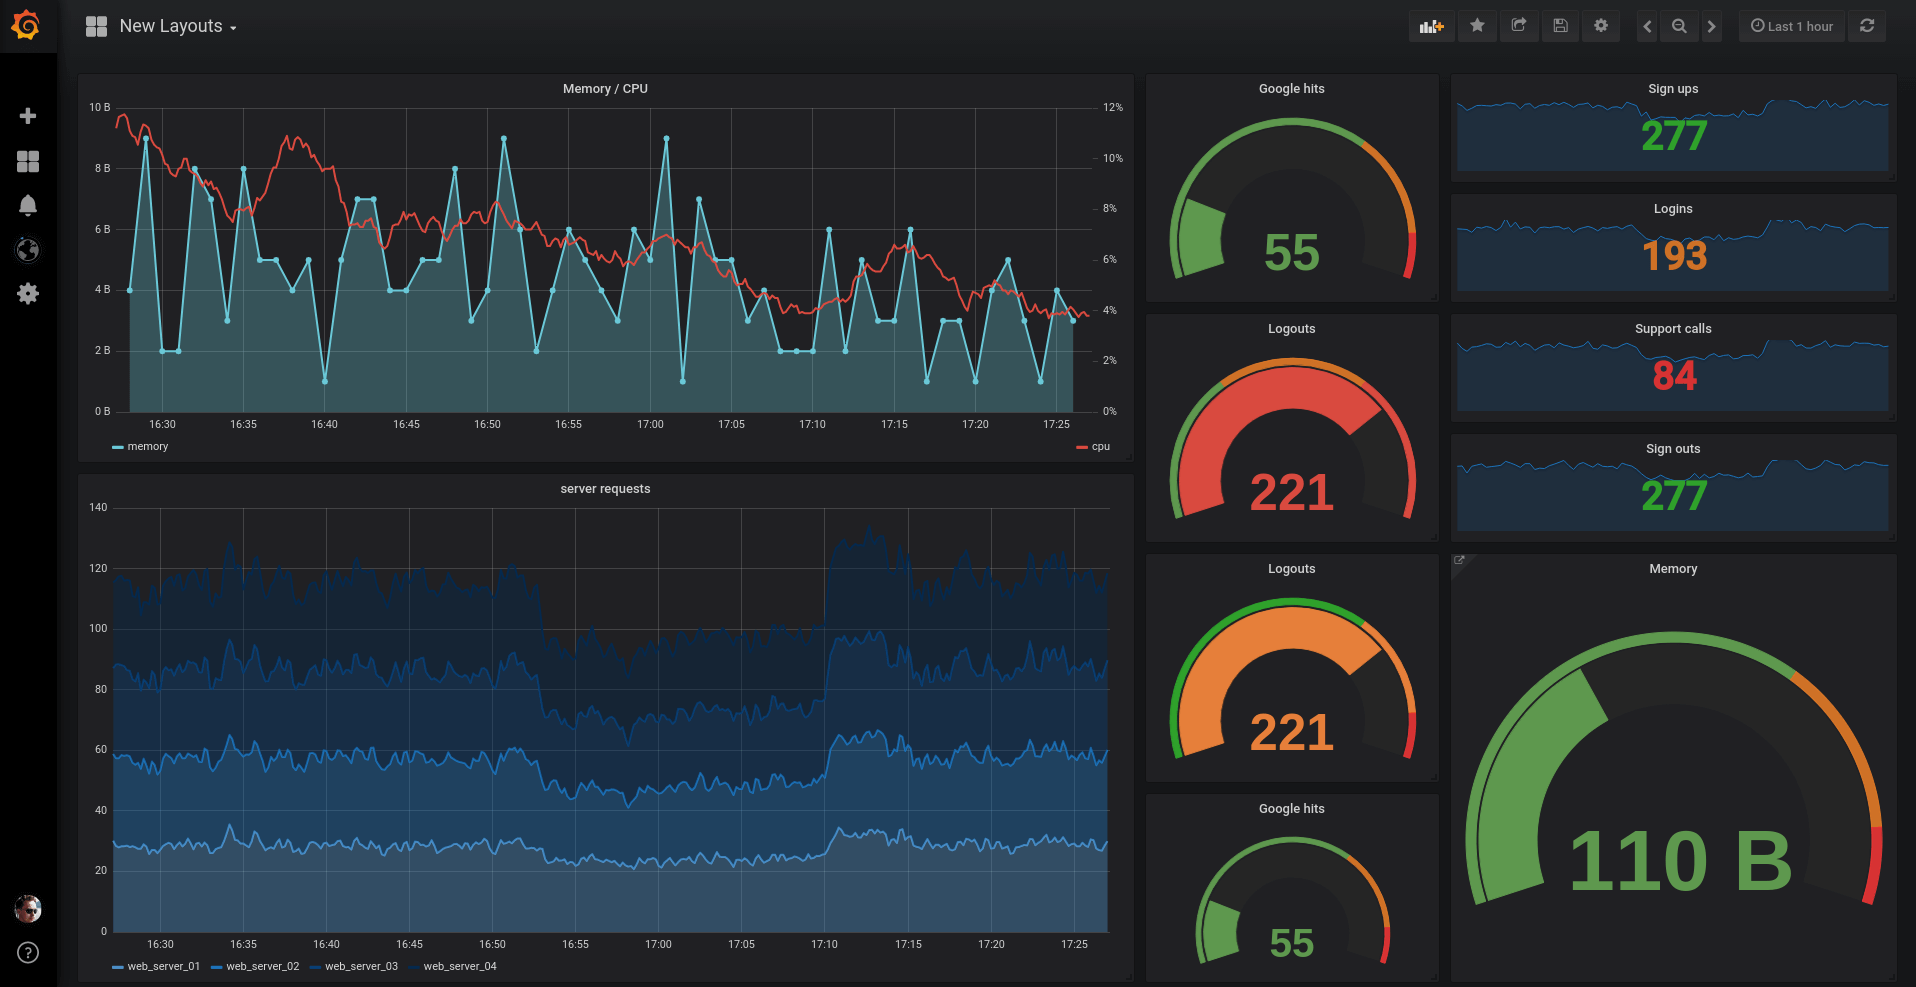
Prometheus can conveniently monitor light service-oriented architectures due to its ability to collect multi-dimensional data. It uses a functional query language called PromQL that you can use to generate graphs, tables, and alerts from the collected data. For preparing graphs and charts of that data, you can use a tool called Grafana. After downloading Grafana, it has to be configured before it can start pulling live metrics from Prometheus. Grafana will take time for setting up and implementation. It is not as seamless as other paid APMs.
Prometheus can also send expressions for processing using an HTTP API integration. You can customize Prometheus to send you conditional alerts regarding various issues. However, customized alert implementation can prove to be detrimental. It takes time to understand Prometheus entirely but, you can always rely on the community for help.
Who is it recommended for?
Prometheus isn’t an off-the-shelf package and to get code profiling for Python code, you will need to sort out a tracing system to feed statistics into the engine. So, you would need to like putting together systems yourself or run an in-house development team if you want to assemble a Python monitor with this free tool.
Pros:
- A free open-source tool
- Has a large community-driven repository of add-ons and hotfixes
- Can accommodate complicated Kubernetes environments
Cons:
- Lacks official paid support
9. Sentry APM
Sentry APM is a lightweight and easy-to-use APM that allows you to diagnose, fix, and optimize code performance. You can implement it directly into your Python project. Primarily, Sentry is known for its real-time error and crashing tracking capabilities; however, its software has so much more potential.
Key Features:
- Always-on Python debugging
- Monitors other Web scripting languages, not just Python
- Performance analysis
Why do we recommend it?
Sentry is a code verification system that will scan web application code when it is under development, being tested for release, or operating in production. This system looks for coding errors that will damage performance or create security weaknesses. The tool excels at testing script-based languages, such as Python.
When Sentry identifies a poor-performing API call, it will create a log of the error for you to review later. Sentry also features a Breadcrumb error feedback which allows you to view the specific events that led to the error. When Sentry was first developed, it was only compatible with Python; however, it has expanded its compatibility catalog to include more than 30 languages. Sentry can be employed on-premise or used as a software-as-a-service (SaaS). As a result, Sentry can effortlessly be integrated with many collaboration tools. It can also monitor full stack traces allowing you to identify and report application errors quickly.
Who is it recommended for?
This is a great tool for any business that runs web applications. However, it is really designed for DevOps teams. If you create web applications and run them as services for other businesses, you will be particularly interested in this package. There is a free edition for individual developers.
Pros:
- Completely open source
- Can query multidimensional data structures
- Supports root cause analysis for faster resolution times
- Supports a wide range of integrations for logging and PSA
Cons:
- Not the best option for enterprise organizations
Sentry comes in four editions. The developer edition is free. However, the capabilities are limited. The team edition is priced at $26 per month, while the business edition is $80/month. The pricing for the enterprise edition can be requested at Sentry’s website.
Conclusion
Programming languages are a necessity in the modern era of technology. Nearly all operations are based on the programming language. From small websites to large applications, all are hosted by one of many programming languages. Therefore, IT specialists need to ensure their applications are operating at their optimum. Automated monitoring tools have significantly reduced the time and effort in ensuring programs and services run smoothly. We must make use of all tools at our disposal to perform our tasks as efficiently as possible. In the end, the most critical resource is time.
Best Python Monitoring Tools FAQs
What are some common features of Python monitoring tools?
Common features of Python monitoring tools include real-time monitoring and alerts, performance and availability reporting, log management and analysis, network traffic monitoring, and security monitoring.
What are some popular Python monitoring tools?
Popular Python monitoring tools include Datadog, Prometheus, New Relic, Nagios, Zabbix, Graphite, Sensu, Graylog, Statsd, and Collectd.
Can Python monitoring tools be used for network monitoring?
Yes, Python monitoring tools can be used for network monitoring, by providing features such as network traffic monitoring and analysis.
Can Python monitoring tools be used for DevOps and Agile methodologies?
Yes, Python monitoring tools can be used for DevOps and Agile methodologies, by providing real-time feedback and collaboration between development and operations teams, and by enabling continuous monitoring and testing.
Can Python monitoring tools be used for machine learning and AI applications?
Yes, Python monitoring tools can be used for machine learning and AI applications, by providing real-time monitoring and analysis of data and performance metrics.