PostgreSQL is becoming one of the most popular relational databases. You can see this by looking at its growth on DBengine or in the most recent survey of developers on StackOverflow. It is a popular open-source, and as with any other data storage solution, capturing metrics is crucial for making sure your database is reliable and performs optimally. This will help you dig deeper into database performance problems, do performance tuning, optimize queries and indexes, and make partitioning decisions. But that’s not all. You’ll also be able to set up alerts and plan for failures or upgrades.
Here is our list of the best PostgreSQL Monitoring tools
- ManageEngine Applications Manager – EDITOR’S CHOICE This facility monitors a variety of relational database management systems (RDMSs), including PostgreSQL. It is part of a suite of infrastructure management tools. Start a 30-day free trial.
- Paessler PRTG – FREE TRIAL This full stack observability package includes A PostgreSQL monitor as well as monitoring services for other DBMSs, such as SQL Server, Oracle, MySQL, and MariaDB. Offered as a SaaS platform or as a software package for Windows Server. Get a 30-day free trial.
- Site24x7 Infrastructure – FREE TRIAL This plan from a cloud-based SaaS platform provides server, network, cloud, and middleware monitoring and it can be extended by a PostgreSQL plug-in to provide database performance tracking. Start a 30-day free trial.
- Datadog You will be provided with end-to-end tracing capabilities, which will enable you to identify the application or microservice that is responsible for conducting inefficient queries.
- AppDynamics It is a database monitor that can keep an eye on PostgreSQL, among other databases, and provides a comprehensive view of database transactions, all the way down to how efficiently the code was written.
- Pganalyze It is a tool that can help you enhance performance by determining whether or not a query requires an index to improve performance.
- ClusterControl A monitoring tool for databases that is capable of keeping an eye on PostgreSQL servers. There are both free and premium versions available.
- SolarWinds Server & Application Monitor A comprehensive database monitor for databases such as PostgreSQL, MySQL, Apache, MongoDB, and Tomcat, as well as Cassandra.
In this article, we discuss in detail the best PostgreSQL Monitoring tools ranked above.
The Best PostgreSQL Monitoring Tools
Our methodology for selecting PostgreSQL monitoring tools and software
We reviewed various PostgreSQL monitoring tools and analyzed the options based on the following criteria:
- Support specifically for PostgreSQL environments
- Alerting and reporting capabilities
- Integration support for SIEMs and other platforms
- A facility to analyze PostgreSQL database performance over time
- Graphical interpretation of data, such as charts and graphs
- A free trial period, a demo, or a money-back guarantee for a free assessment
- A good price that reflects value for money when compared to the functions offered
1. ManageEngine Applications Manager – FREE TRIAL
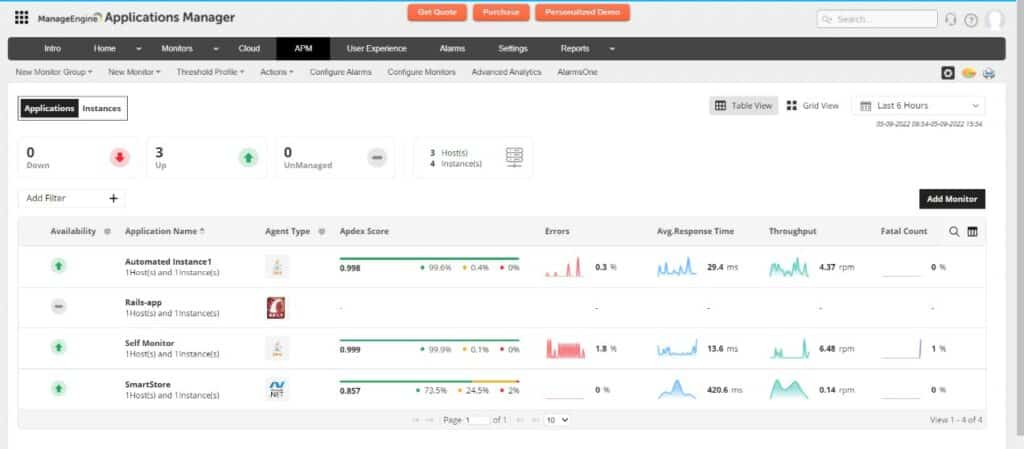
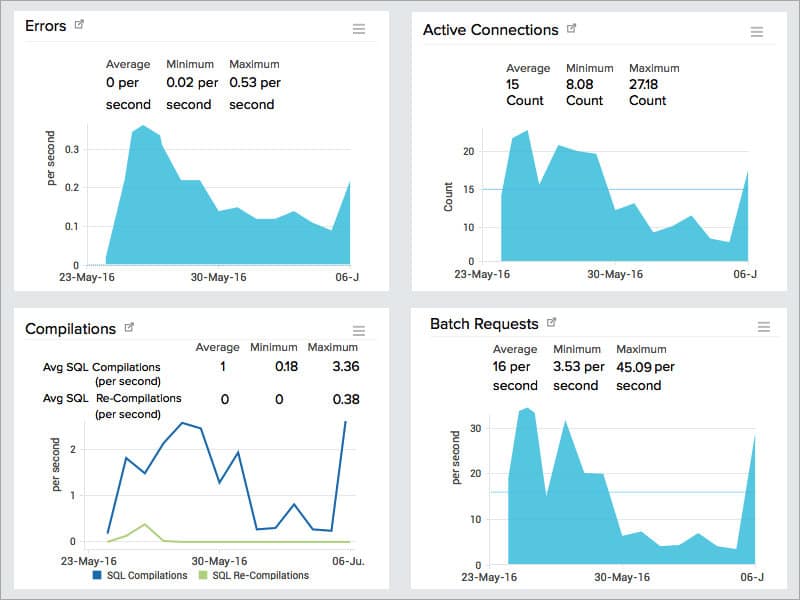
ManageEngine Applications Manager is another leading-edge application monitoring solution, this one provides support for PostgreSQL databases. Information such as buffer statistics, database connection statistics, disk use details, query statistics, table scan details, and many other types of information can be monitored by ManageEngine Applications Manager. The entirety of this data can be shown as charts, allowing one to monitor the metric’s evolution through time. Every graph is simple to understand even at a quick scan.
Key Features:
- Responsible for constructing application dependency maps
- Demand for records resources inside and beneath the database management system
- Includes a pre-configured PostgreSQL monitoring template out of the box
- Records live health metrics in addition to historical data to facilitate long-term monitoring
- It is an excellent choice for those that want to monitor additional environments in addition to their SQL servers
- Extremely comprehensive; all performance metrics for the database, as well as hardware statistics, replication, and session data, are displayed in a single view
- An examination of queries
Why do we recommend it?
ManageEngine Applications Manager is able to track traditional applications and services plus Web applications. It can monitor a range of DBMSs, including Postgres. The package tracks down all of your systems and creates an application dependency map, which provides root cause analysis when problems arise.
In addition to that, the software comes with a customizable notifications system. The user is given the ability to set dynamic baselines within ManageEngine Applications Manager, which assists in the identification of performance anomalies when they arise. You can have a more in-depth look beneath the surface thanks to the function known as root cause analysis. In a similar vein, APM Insight enables users to inspect application code as well as SQL queries to determine the source of an issue.
The user can take a look back at any performance concerns that were discovered through the use of the Reports feature. You can view the historical performance of PostgreSQL databases, as well as the performance trends. When it comes to long-term capacity planning, looking at performance trends in reports can be very helpful.
Who is it recommended for?
This package will watch over server resources as well as applications. It is able to track systems running on cloud platforms as well as on your own servers. There is a free edition available for Applications Manager. That is appealing for small businesses and it is limited to tracking five assets.
Pros:
- Offers on-premise and cloud deployment options, giving companies more choices for install
- Can highlight interdependencies between applications to map out how performance issues can impact businesses operations
- Offers log monitoring to track metrics like memory usage, disk IO, and cache status, providing a holistic view into your database health
- Can automatically detect databases, server hardware, and devices for real-time asset management
Cons:
- Can take time to fully explore all features and options available
ManageEngine Applications Manager provides a monitoring experience that is not only user-friendly but also very powerful for PostgreSQL. There is a free version of ManageEngine Applications Manager as well as paid versions available (Professional and Enterprise versions). You will need to make direct contact with the company to view the pricing information about the product. You have the option to download the 30-day free trial.
EDITOR'S CHOICE
ManageEngine Applications Manager is our top pick for a PostgreSQL monitoring tool because this system is able to monitor multiple database instances simultaneously and they can all be running on different platforms. The package implements a discovery routine that identifies and logs all software operating on a system. The tool also scans servers for their resource capacity. The result of this investigation is an application dependency map that records all the links between software units, which includes microservices and functions that might be hosted elsewhere. The map tracks down to server resources and can identify when a newly launched application and all of its suite of components will hit each resource. The accumulation of demand could cause a specific server resource to be exhausted and the Applications Manager will calculate this event and warn about it before it happens. The PostgreSQL monitoring package will look at issues such as availability, throughput, capacity, and response times.
Download: Get a 30-day free trial
Official Site: https://manageengine.com/products/applications_manager/download.html
2. Paessler PRTG – FREE TRIAL
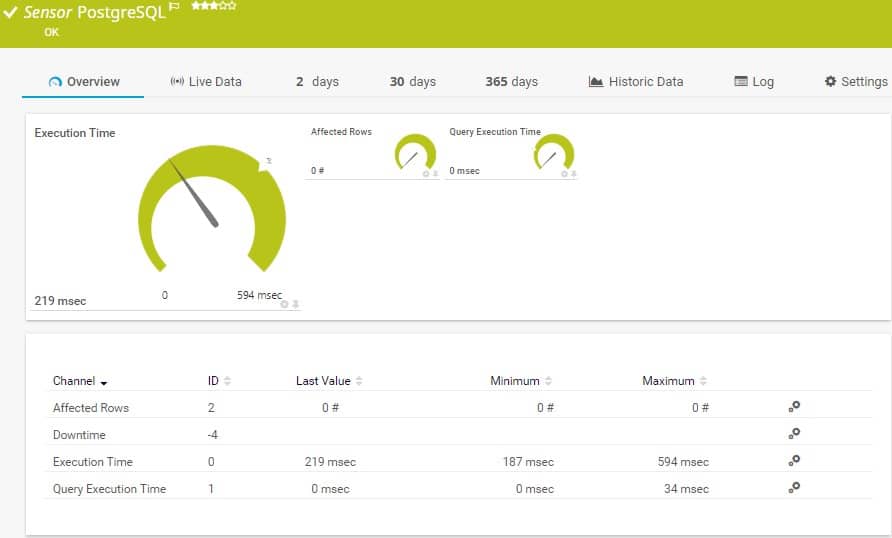
Paessler PRTG provides a bundle of monitoring services for networks, servers, and applications. The application monitoring services include database monitoring. You can monitor PostgreSQL database instances with PRTG and there are also sensors to monitor SQL Server, MySQL, MariaDB, and Oracle databases. The PRTG system allows for custom SQL monitors – you set up a query on system tables and the monitor will run it for you and report on the results.
Key Features:
- Customizable system with options to create queries and rearrange dashboard screens or create new screens
- Options to monitor SQL Server, MySQL, MariaDB, and Oracle databases as well as PostgreSQL
- Full stack observability that can show application and service dependencies
- Server monitoring with correlation with database activity and resource demands
- Database capacity planning assistance
- Data visualizations with dials and graphs
- Alerts for database performance issues
Why do we recommend it?
The power of Paessler PRTG is that it is able to monitor multiple IT assets simultaneously. The package has a discovery service at its core and this will document endpoints and provide a system map. You can monitor PostgreSQL database activity and performance while also monitoring databases from other DBMSs.
PRTG includes an alerting mechanism and every metric that the package collects has a performance threshold associated with it. If you set up custom sensors for PostgreSQL monitoring, those can also have thresholds registered on them. When each metric instance is collected, it is compared to the performance rule and if the new number doesn’t match that level, the system will generate an alert.
Alerts can related to response times for queries or resource usage. All alerts appear in the PRTG dashboard and administrators can set up the system to forward alerts to technicians by email or SMS.
The PostgreSQL monitoring screen also gives access to database logs. Metrics can be stored and then recalled for historical analysis. This helps with capacity planning and incident analysis.
Who is it recommended for?
PRTG is suitable for all sizes and types of businesses. The package is customizable and the buyer pays for an allowance of sensors with a minimum order quantity of 500. Small businesses can use the package for free forever if they only activate 100 sensors. Alerts create an automated monitoring service that enhances the productivity of support technicians.
Pros:
- Automated system discovery and documentation
- Can monitor multiple different DBMSs simultaneously
- Correlates activity tracking and resource demand between databases and the applications that access them
- Assessment of database resource requirements and physical server resource availability
- Log storage and access
Cons:
- The software package isn’t available for Linux or macOS
Buyers of PRTG pay a yearly subscription for an allowance of sensors. The system is offered as a hosted SaaS platform but customers can opt to download the PRTG software and host it on Windows Server. Paessler offers a 30-day free trial of PRTG with all sensors activated.
3. Site24x7 Infrastructure – FREE TRIAL
Site24x7 Infrastructure provides monitoring services for networks, servers, services, and cloud platforms. It can be extended by plug-ins and there is one available for Postgres Monitoring. This is a cloud platform and so it can be accessed from anywhere through a Web browser. The system is able to implement PostgreSQL monitoring on multiple sites simultaneously, consolidating statistics in an overview and offering a drill-down path for details on each instance.
Key Features:
- See live statistics on activity in each database instance
- Active and idle user counts
- Count of queries canceled due to data recovery actions
- Cache statistics
- Buffer activity data
- A record of scheduled checkpoints and buffers written during checkpoints
- Committed transaction counts
- Option to customize statistics collection
Why do we recommend it?
The Site24x7 Infrastructure plan combines the monitoring of networks, servers, services, applications, and cloud platforms. The system can be expanded by integrations, which add on dashboards and probes for specific technologies. There is an integration available for PostgreSQL monitoring. Site24x7 is a cloud platform and it automates monitoring by raising alerts if problems are detected.
Site24x7 Infrastructure provides monitoring for many other assets apart from Postgres databases. The system also watches the activity on the servers that host the database. This means that the processes that run the database instance are tracked and so are the server resources that those processes are going to call upon.
The ability to watch server capacity utilization provides quick root cause analysis if the Postgres instance suddenly slows its responses or seems to hang. This could be due to server resource shortage and if that is the case, the server monitor will have already raised an alert. This means that you don’t waste time investigating what is going on with your database when the real problem lies elsewhere.
The tool also provides network monitoring. Again, this lets you know immediately if there is a problem with the route between your database’s server and the users of the system. It could be that slow responses are due to the network and not either the server or the database, so this full-stack monitoring cuts out investigation time.
Who is it recommended for?
The Infrastructure plan is sized and priced for small businesses. Larger businesses pay for capacity expansions to get a service that provides suitable monitoring throughput. This is a cloud platform that can track assets on multiple sites in the same account and there is also a version for managed service providers.
Pros:
- Covers all systems between user-facing software and server resources
- Special screens for PostgreSQL activity monitoring
- Automated alerts for database performance issues
Cons:
- No on-premises version
The Site24x7 platform allows an administrator to create multiple user accounts for access to the monitoring console, so each of your technicians can get an individual account, which enhances traceability. There is also an MSP version of the Site24x7 platform, which has a multi-tenanted architecture to keep the data of clients separate.
Site24x7 Infrastructure is available for a 30-day free trial.
4. Datadog
Explain plans from each of your databases that may be viewed in a centralized location thanks to Datadog Database Monitoring’s capabilities. Any database professional may immediately identify expensive and slow queries with the help of Database Monitoring and then delve into specific execution details to address bottlenecks. In addition, a correlation between query metrics and host metrics makes it simple to recognize and comprehend the influence that resource restrictions have on database performance.
Key Features:
- Automatic integration with the remaining components of the Datadog platform, such as dashboards, monitors, and SLO tracking, as well as complex formulas and functions
- Compare and contrast the many available plans and display the results
- Monitors connections, requests, and raw access
- Keep an eye on both the host and the instance
- Monitor the state of backups and replications.
- Monitoring of disk space for purposes of capacity planning
- Access control depending on the user’s roles
- Automatically identifies the replication topology
Why do we recommend it?
Datadog is a similar cloud platform to the Site24x7 system. The Infrastructure module of Datadog provides expansions, called integrations and there is one for PostgreSQL monitoring. This tool will link its monitoring of database activity to server resource availability and network performance. However, you have to buy extra modules to get full stack observability.
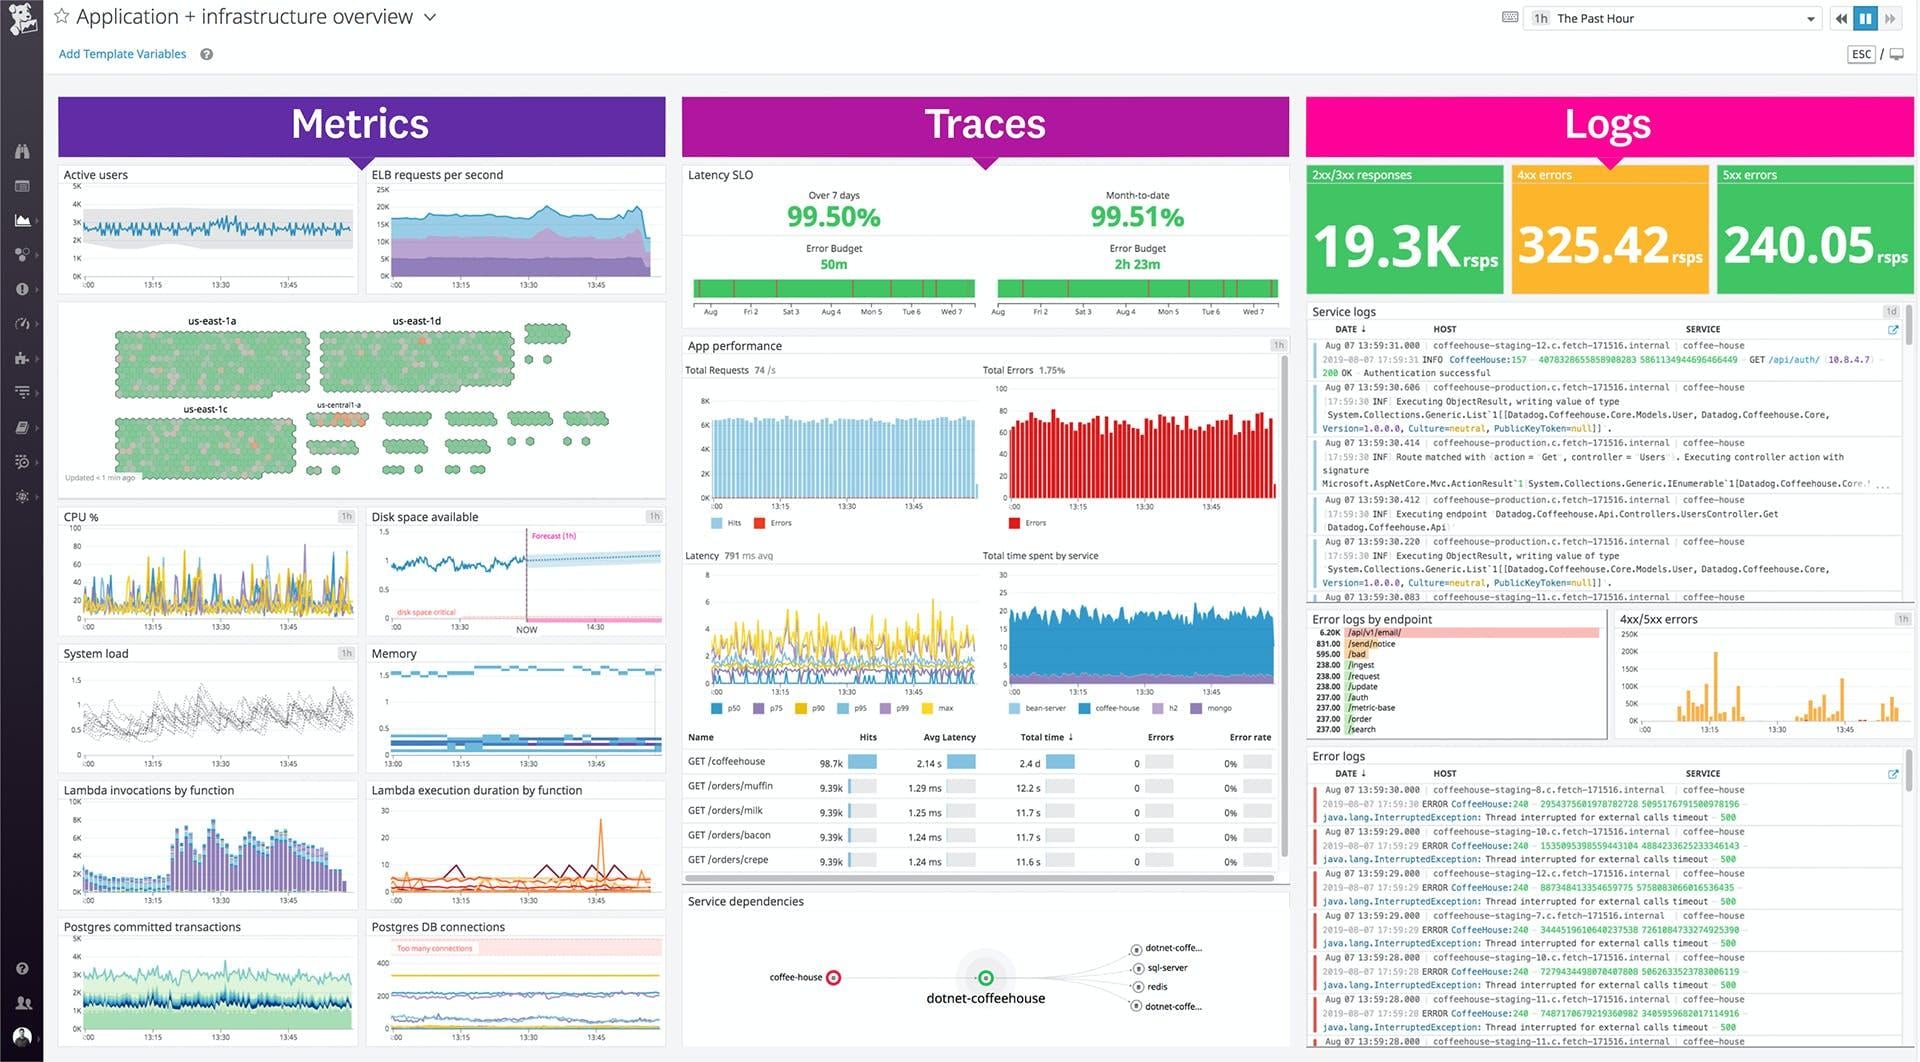
The Datadog APM platform offers trace functionality for PostgreSQL and monitors metrics at the system level. You can use it to monitor application performance and enable end-to-end tracing with your database queries and other service calls. You can also use it to analyze application performance. You will have visibility down to the code level, and a quick root-cause analysis function is included.
The Datadog APM is a fantastic tool that can be integrated with your programs to monitor connections that are opened with your databases. You will be provided with end-to-end tracing capabilities, which will enable you to identify the application or microservice that is responsible for conducting inefficient queries. After that, you can correct them as necessary. Additionally, Datadog provides an agent that can be quickly installed for PostgreSQL. This agent receives data from PostgreSQL and sends it to the Datadog control plane so that it may be seen.
You can optimize database performance using Datadog, thereby reducing Mean Time to Repair (MTTR), preventing outages, and eventually increasing corporate income. You can gather metrics from each of your databases and save them in a centralized location using Datadog Database Monitoring. After that, you will be able to delve further into the data to discover patterns that are related to performance.
You are required to already be using Datadog’s Infrastructure Monitoring package to get access to their Database monitoring.
Who is it recommended for?
Datadog provides the Infrastructure package for monitoring a range of services and there is now also a Database Monitoring unit that can be used to track activities on PostgreSQL, SQL Server, and MySQL databases. There is a free edition of the Infrastructure unit but that doesn’t include the PostgreSQL extension.
Pros:
- Offers numerous real user monitors via templates and widgets
- Can monitor both internally and externally giving network admins a holistic view of network performance and accessibility
- Changes made to the network are reflected in near real-time
- Allows businesses to scale their monitoring efforts reliably through flexible pricing options
Cons:
- Would like to see a longer trial period for testing
Datadog is a monitoring software package that is hosted in the cloud that monitors the performance of all resources, ranging from the physical attributes of the server to the user-facing software. An integration that is included in this package provides additional capabilities to interface with and monitor PostgreSQL databases. These features include specific displays and the ability to exchange data.
5. AppDynamics
It is a monitoring tool with a primary focus on the monitoring of application performance in addition to infrastructure monitoring. It does this by collecting a large number of metrics from both your infrastructure and your system and then providing you with insights, dashboards, and performance-enhancing recommendations. AppDynamics provides support for PostgreSQL, which enables users to do in-depth investigations into the utilization of PostgreSQL system resources, drill into queries and examine the database instance objects that are impacted by those queries, and troubleshoot problems in real-time.
Key Features:
- Conducts in-depth analysis of each database transaction
- Infrastructure monitoring
- A correlation between the monitoring metrics and the database metrics regarding the performance of the application
- Metrics at the system level as well as the database level are supported.
- Suggestions for performance enhancement and drill-down reports about queries
- Anomaly detection and alarms enabled by artificial intelligence
- Analyses based on AI technology
Why do we recommend it?
AppDynamics uses AI to construct an application dependency map that includes server resources and cloud platform services. This system predicts resource requirements for interdependent applications to spot potential shortages that could create application performance problems. The tool tracks activity in PostgreSQL instances, identifying peaks in demand and possible resource locking.
AppDynamics presents PostgreSQL instance objects as a solution to the visibility problem it faces. When viewing objects from this perspective, it helps you to have a lot better understanding of the configurations that you now have. You can take a deeper look at a variety of features, like Table Details and Index Information, to name just two examples.
The AppDynamics alerts system derives its functionality from baselines. AppDynamics can collect data on performance and generate baselines so that it can identify abnormal patterns of behavior. Because the alerts and baselines in the program are so advanced, it can reduce the number of false warnings and ensure that you only get important notifications.
Who is it recommended for?
This is a cloud-based system and it can track activity on your servers and on cloud platforms. The tool doesn’t just watch over PostgreSQL databases – it can track activities on many other DBMSs. You need to install a collector in each database instance to extract metrics on database transactions.
Pros:
- Tailored for large-scale enterprise use
- Excellent dependency mapping and visualizations to help troubleshoot complex application systems
- Includes a fully functional free version
- Offers a variety of enterprise features, integrations, and levels of support
Cons:
- Can have a steeper learning curve than similar tools
The majority of monitoring options, including warnings, are available out of the box. However, this is not an exhaustive list. One of the unique features is called application flow mapping, and it involves AppDynamics learning the behavior of your application and establishing baselines automatically. This then leads to intelligent warnings on the identification of anomalies.
6. Pganalyze
It provides a solution that is both complex and easy to use for monitoring Postgres. Pganalyze will automatically group query plans that are quite similar to one another and call attention to any plans that greatly deviate from one another. The importance of the role of explaining the output is emphasized via visualization. You can discover specific concerns, such as slowdowns for queries over time, I/O versus CPU time for each query, or buffer cache hit ratio, with the use of per-query statistics and query drill-downs.
Key Features:
- A retention period for historic statistics that can be modified
- Insights into the detailed performance of queries
- Compilation of explained plans in an automated fashion
- Describe the visualization, as well as any Insights
- Metrics updated in real-time
Why do we recommend it?
Pganalyze is a database analyzer for PostgreSQL database instances. It watches over queries as they execute in the database. The system will also record execution time statistics for each query, indemnifying those that have problems. The tool can generate an explain plan so that you can see which indexes are being hit by a slow query.
Pganalyze provides several different pricing options. Starting with the Production package, which costs $149 per month, you get automated health checks, team collaboration, Pganalyze Index Advisor, and monitoring for one database server. You also get 14 days of past statistics. The Following Scale package costs $349 per month and includes query plans that use auto explain, 30 days’ worth of historical statistics and preset log event filters. Additionally, the package protects personally identifiable information (PII). Enterprise solution is also available and requires a custom quote.
This tool can be used to assist in determining the cause of a query’s sluggish performance. To accomplish this, you can examine statistics like the I/O CVS CPU time ratio and the buffer cache hit ratio to assist in locating the underlying cause.
Who is it recommended for?
This package is a DBA tool and could also be useful for a programmer who is developing a new application that accesses a PostgreSQL database. This system also provides a collaboration feature that supports group discussions about how to fix problems with the database structures or queries.
Pros:
- Lightweight tool – uses little resources
- Designed for additional visibility into PostgreSQL queries – a good option if you only manage PostgreSQL
- Supports storage of performance data
Cons:
- The trial is only 14 days long
- On-premise version is only available in the Enterprise package
Pganalyze is a tool that can help you enhance performance by determining whether or not a query requires an index to improve performance. You may uncover the underlying cause of a problem more quickly and take steps to avoid it in the future with the assistance of intelligent explaining and highlighting.
In addition to this, you get unrestricted visibility into the performance history of your database. To locate troublesome queries, you can search through queries and view the Query, Role, AVG TIME (MS), CALLS/MIN, I/O percent, CACHED percent, and percent of All Runtime.
7. ClusterControl
It is a sophisticated monitoring software for databases that is compatible with PostgreSQL. ClusterControl is a database monitoring tool that assists users in monitoring their databases by combining performance monitoring with database automation. You will be able to manage PostgreSQL instances thanks to the software’s database automation capabilities, which automatically install and configure the databases for you. You can configure new or existing replication slaves with the help of PostgreSQL streaming replication.
Key Features:
- Allows for the automated construction of databases
- Right-sizes resource requirements
- Replication of databases to ensure availability at all times
- Ideal for larger PostgreSQL settings
- Facilitates automatic replication and data restoration between clusters
- A new cluster may be up and operating with a simple deployment in less than fifteen minutes
Why do we recommend it?
Several9s ClusterControl, as the name suggests, manages multiple database instances simultaneously. The service tracks activity on PostgreSQL databases and it can also watch over SQL Server, MySQL, MariaDB, and MongoDB databases, among others. This system is focused on database instance management with tasks such as replication and backup rather than query analysis.
When it comes to managing PostgreSQL, one of the most challenging difficulties to overcome is visibility. By providing a topology viewer, ClusterControl takes a direct approach to address this problem. The topology viewer gives you a bird’s-eye view of how your database is put together and how it’s performing its functions.
Your database will be more protected thanks to the feature that allows for automatic failover and recovery. When a failure occurs, the product will instantly promote a new master node to the position it previously held. In the aftermath of a database event, you also can recover your databases to a point in time before the incident occurred. These features help to ensure that your service will continue to be accessible at all times, regardless of what may occur.
There is a free version of ClusterControl available to the public, in addition to two premium versions. The Community edition is offered at no cost and comes with both real-time monitoring and support from the community.
Who is it recommended for?
This system is much stronger on database management tasks than the other tools on this list. It does include query analysis and database performance monitoring but those are not the main reason anyone would buy the ClusterControl package. System services supervision, such as load balancing, are bigger reasons to get ClusterControl.
Pros:
- Ideal for larger PostgreSQL environments
- Supports automatic replication and recovery across clusters
- Simple deployment takes under 15 minutes to get a new cluster running
- Simple yet intuitive interface
Cons:
- Would like to see paid features included in the free licensing for testing
In the Advanced version, there are capabilities for detecting failure and recovering from it. In addition, reporting and control over access based on roles are included in the Enterprise edition of the software. You will need to make direct contact with the company to view the pricing information about the product.
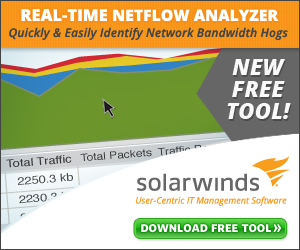
8. SolarWinds Server & Application Monitor
SolarWinds Server & Application Monitor is one of the most significant tools in the monitoring industry. The functionality of SolarWinds’ solutions frequently overlaps, which means that for a given task, such as Database Monitoring, you have the option of selecting from numerous solutions and making your choice depending on the other capabilities available.
Key Features:
- Keeps an eye on a variety of applications
- Monitoring of databases as well as hardware resources
- An investigation into queries
- Has the ability to automatically detect in real-time databases, server hardware, and other devices
Why do we recommend it?
SolarWinds Server & Application Monitor is able to track all services and applications, not just databases. This package doesn’t include distributed tracing, however, so it isn’t suitable for monitoring Web applications. The system will link together the monitoring of applications that interact with each other.
Over two hundred monitoring templates are included in SolarWinds Server & Application Monitor. These templates are compatible with providers such as PostgreSQL, MySQL, MongoDB, Apache, Tomcat, and Cassandra. There are also over 800 monitoring templates that users have produced and shared on Thwack, which is SolarWinds’ online user community. These monitoring templates can be found on Thwack.
Intelligent alerts keep you abreast of any changes to the performance of PostgreSQL. An alert will be issued to you if the consumption of the CPU is significantly higher than usual. A performance baseline is set, and alerts are given out when there is a divergence from that baseline. Alerts are configured based on criteria, and they are sent out when there is a deviation. The software was developed in a way that reduces the number of false positives.
The PostgreSQL monitoring solution that SolarWinds offers is delivered via SaaS and gathers data through the use of agents. You may use it to monitor your databases in real-time and analyze data from the past. Additionally, you can use it to collect system and core PostgreSQL metrics, get an overview of performance over time, and visualize data in dashboards and notebooks that you can personalize.
Performance monitor, in contrast to another product called Database Performance Analyzer, does not include ML-powered anomaly detection, VM monitoring, or even analytics.
Who is it recommended for?
This is an on-premises package but it can monitor systems that are hosted on cloud platforms as well as those on your site. It is able to monitor many DBMSs, not just Postgres and you can get it to monitor multiple instances from different DBMSs simultaneously. The software runs on Windows Server.
Pros:
- Offers “done for you” dashboards, monitors, and templates designed for your environment
- Provides live monitoring through its agentless architecture
- Supports auto-discovery that builds network topology maps and inventory lists in real-time based on devices that enter the network
- Can map applications, networks, and infrastructure as well as highlight bottlenecks and dependencies
- Uses drag and drop widgets to customize the look and feel of the dashboard
Cons:
- SolarWinds SAM is a feature-rich enterprise tool that can take time to fully explore
PostgreSQL Monitoring Tools FAQs
What are some common metrics to monitor in PostgreSQL?
Some common metrics to monitor in PostgreSQL include CPU usage, memory usage, disk I/O, query performance, and database connections.
What tools can I use to monitor PostgreSQL?
There are several tools available to monitor PostgreSQL, including open-source tools like Nagios and Zabbix, as well as commercial tools like SolarWinds Database Performance Analyzer and Datadog.
What are some best practices for PostgreSQL monitoring?
Some best practices for PostgreSQL monitoring include setting up regular backups, monitoring disk space usage, configuring database connection limits, and regularly reviewing performance metrics to identify potential issues.
How can I optimize the performance of my PostgreSQL database?
To optimize the performance of your PostgreSQL database, you can use tools like pgTune or Solarwind SAM to generate optimized configuration settings, optimize your queries, use indexes to speed up queries, and regularly review performance metrics to identify areas for improvement.