One of the biggest challenges of network administrators is ensuring a fast and smooth connection with as few packet losses as possible.
Here is our list of the best network latency tools:
- ManageEngine OpManager – EDITOR’S CHOICE This network device and server status monitoring service also include troubleshooting tools for network performance. An example of these is the WAN monitor, which provides a Ping-style latency test. Available for Windows Server, Linux, AWS, and Azure. Get a 30-day free trial.
- Paessler PRTG Network Monitor – FREE TRIAL A very comprehensive networking monitor that can give you a detailed analysis of your network. Start a 30-day free trial.
- Site24x7 – FREE TRIAL Offers a network latency tool for assessing the delay in data transmission across a network, helping organizations identify and address performance issues. Start a 30-day free trial.
- ManageEngine OpManager Nexus – FREE TRIAL An enterprise network monitoring tool that offers deep network layer observability and identifies latency and its root causes. Download a 30-day free trial.
- ManageEngine Free Ping Tool Offers a few essential utilities to diagnose issues, unlike other software that provides comprehensive reports quickly.
- SolarWinds Engineer’s Toolset Highly feature-packed software with more than 60 utilities measuring a broad range of metrics.
- SolarWinds NetFlow Traffic Analyzer Offers users a very simplified view of concise information related to network traffic and bandwidth utilization.
Networks in organizations depend on reliable connectivity. Therefore, it is essential to maintain smooth networking operations, especially in this technological age, where connectivity is the backbone of modern infrastructures. Network administrators must optimize networks to ensure proper distribution of speeds and quality of service (QoS) between different users based on priority lists. However, it is not always easy. One of the most significant issues that hinder the operations of a network is latency. Network latency manifests in every network around the world. Latency can never be eliminated; however, latency can be minimized. This article will guide you about the various ways you can ensure that your network is free from latency as much as possible.
What is Network Latency
It is expedient to understand what network latency is. In simple terms, network latency measures the speed of a network or the traffic on a single network. It is measured in milliseconds. It is a way of measuring the time it takes for a packet of data to reach its end destination. Each network has a limited amount of circuits through which data can travel throughout the network. The circuits are analogous to highways. If too much data is present on a single circuit, it will cause congestion, and users would end with high latency.
Several factors dictate network latency. Network latency does not only vary from one network to another but also varies from application to application. Each application has a different acceptable latency. Some applications are not significantly affected by latency, while others may stop functioning altogether. Applications like video playback and VoIP calls require higher bandwidth and speeds than sending emails.
Another factor that affects latency is propagation time, the distance separating the two communicating devices. Even though data travels at the speed of light, there is always a delay due to the enormous distances packets cover. Therefore, the farther the end device is from the medium, the more latency in the network.
Transmission delay might also affect latency, but it is more related to the medium than the network. For example, if a device is sending a large packet, it would have a higher latency due to the greater upload size of the data. Conveniently, devices can send small packets of data quicker than larger ones.
The third factor that affects latency is the router’s capabilities. If you are using an outdated router, it might cause latency issues because of the congestion of its bands. Nowadays, most routers have a dual-band configuration allowing users to cut down latency issues by a large margin.
Why should you minimize network latency?
Network latency should be reduced because it hinders productivity and efficiency since organizations depend on high delivery speeds. Slow internet speeds are frustrating for everyone and would distract employees from adding value to the organization. Therefore, network administrators have to optimize networks so that high-priority users experience as little latency as possible. At the same time, those undertaking low bandwidth tasks don’t end up worse off as well.
How can you measure latency?
There are many ways to measure latency. However, there are two common ways to measure network latency: RTT and TTFB. RTT refers to “Round-Trip Time,” which measures the time for a packet of data to travel from one point of a network to another and for a response to return to the source. RTT is generally the preferred way of measuring latency since it does not require installing any software. TTFB refers to “Time to First Byte,” which measures the time it takes for a data packet to travel from one point on a network to another. TTFB does not require a response, unlike RTT. However, TTFB requires data collection software to be installed on the end device.
Apart from these two methods, a wide variety of tools automate measuring latency at home. In addition to measuring latency, some tools can extensively analyze bandwidth utilization on a network. The tools can also measure other metrics and provide you clear indications of a network’s choke points.
Measuring Latency with Ping
One of the easiest ways to measure network latency is through software called Ping. Ping is a great and free latency-testing tool built into the operating system and does not require sophisticated applications. Network administrators often use Ping for diagnosing internet connectivity issues due to its ease of use. It is based on the Internet Control Message Protocol (ICMP) and is easy and practical. It provides a detailed report of the network to the computer that runs Ping.
Ping is an example of round-trip time (RTT), also known as round-trip delay. When you run the ping command, it would send a data packet to a specific location within the network and measure the time, in milliseconds, it took for the response signal to be received by the host. It measures the travel time for both the data packet sent and the response packet received. The results will also include the number of packets sent, number of packets received and number of packets lost, allowing you to diagnose latency fluctuations thoroughly.
It is an excellent and easy-to-use tool for diagnosing latency-related issues; however, it cannot solve the problems independently. It is also not capable of analyzing multiple network paths in a single command. For extensive troubleshooting of network problems, the use of the below tools mentioned is recommended.
How to Solve latency issues
Even though Ping is an excellent tool for diagnosing latency issues, its failure is its inability to solve detected problems. There are multiple ways to address latency issues. One particular way is by using queuing algorithms. Quality of Service (QoS) is a methodology for establishing priorities and deciding which data types will be given precedence over others. In QoS, most urgent cases are prioritized, and most of the bandwidth is allocated to them. In contrast, low bandwidth tasks are put on hold until sufficient bandwidth is available. This can cause transmission delays in specific less time-sensitive traffic. However, the tradeoff is worth it in the end.
The Best Network Latency Tools
1. ManageEngine OpManager – FREE TRIAL
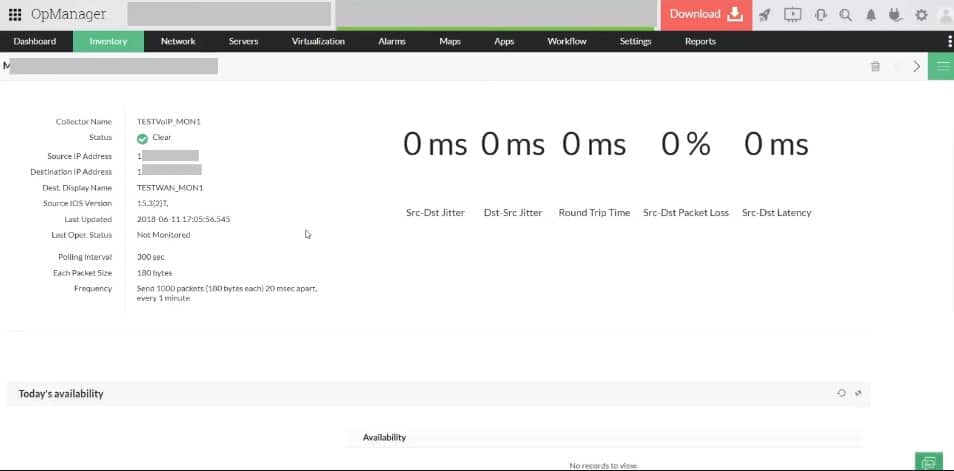
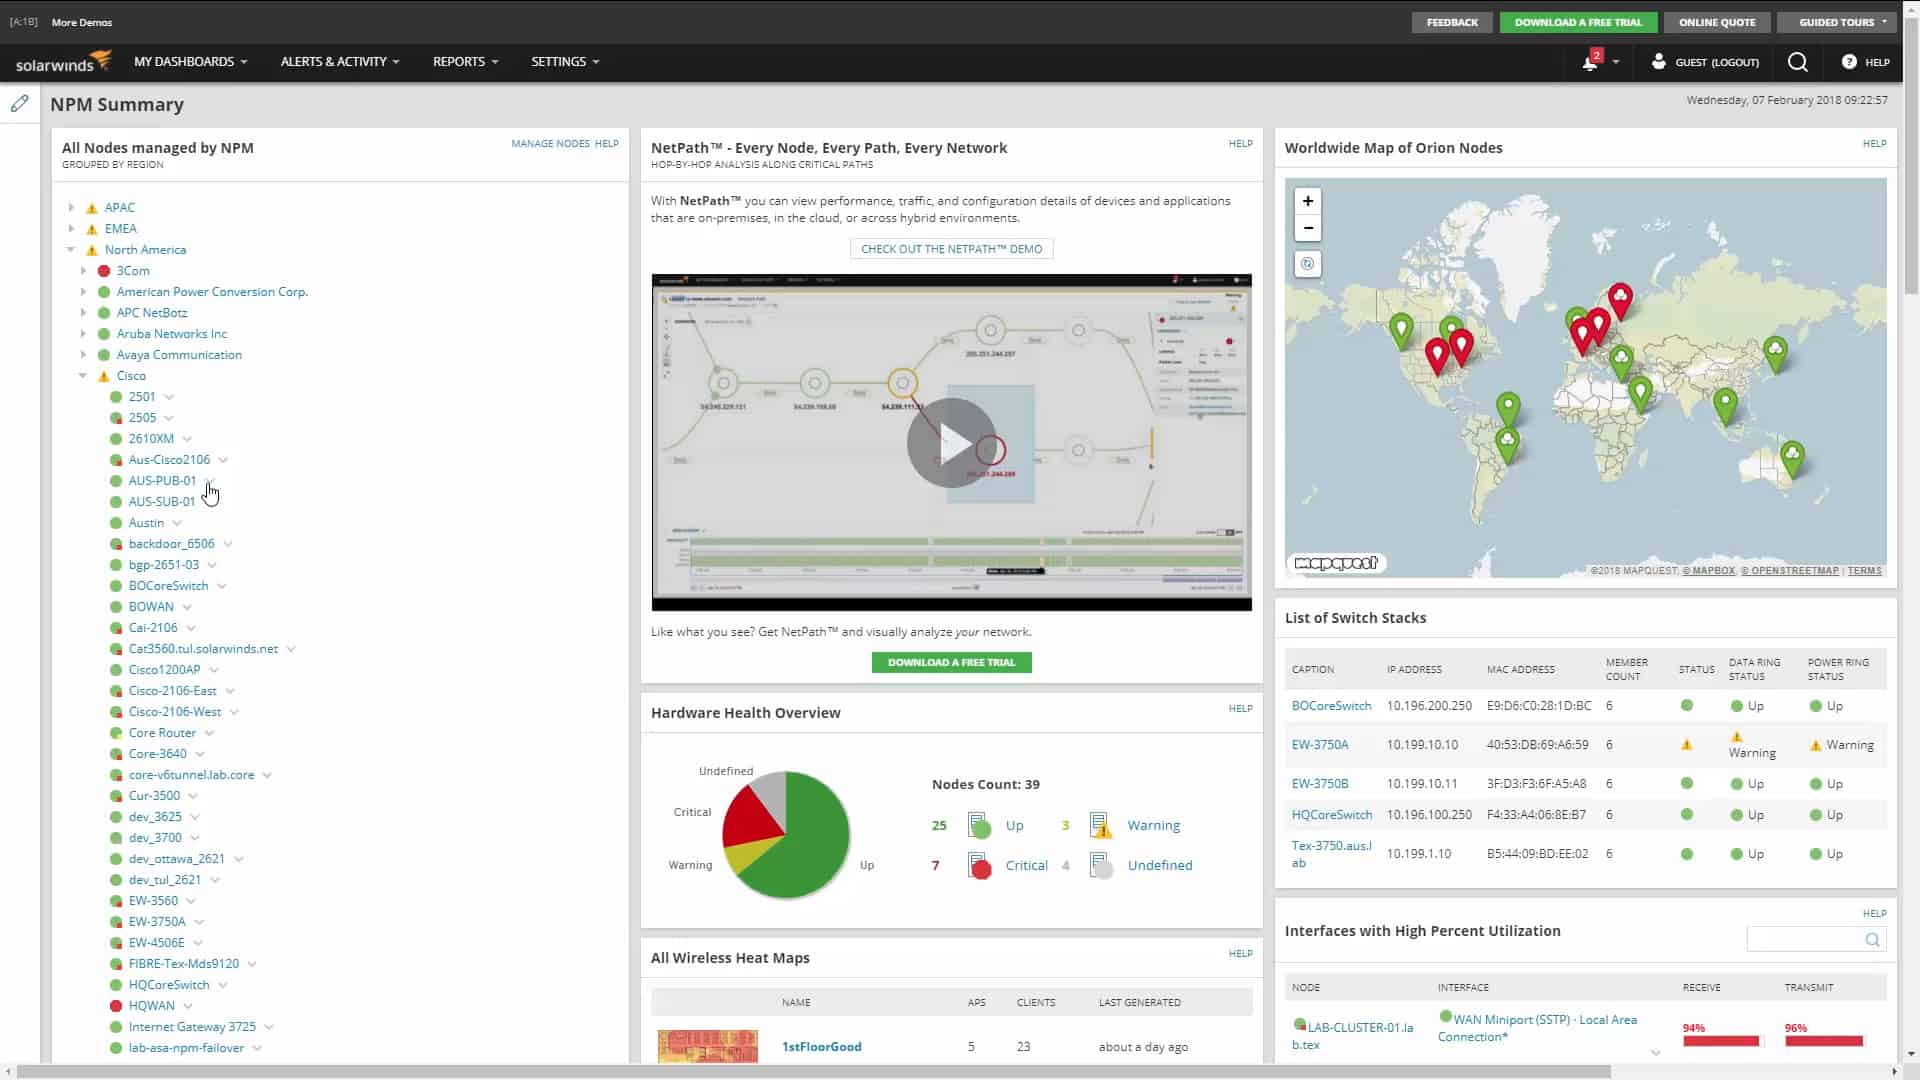
ManageEngine OpManager is a performance monitor that examines the statuses of network devices and servers. It includes tests for network latency that are based on PIng. The two main latency measuring services in the package are found in the WAN Monitoring screen and the VoIP performance monitoring service, which is shown above.
Businesses don’t need to actually be using VoIP in order to look at the VoIP performance screen. These tests operate on the network and not within any VoIP package. Effectively, the tests examine the network’s suitability for a VoIP system rather than the performance of actual VoIP traffic.
This makes the VoIP monitoring page a more interesting source of information because not every business operates a WAN. You do actually need to be operating multiple sites in order to use the WAN monitoring service. Effectively, the difference between the two services is that the VoIP monitor tests a path between two points on the same network and the WAN monitoring system tests a path from an endpoint on one LAN to an endpoint on another LAN. Thus, the WAN monitor tests the performance of both LANs and the internet between the two sites.
The main purpose of OpManager is to discover and document a network. This involves generating an inventory of all hardware on the network and then creating a network topology map. The tool then uses the Simple Network Monitoring Protocol (SNMP) to scan all devices for status reports. These reports are interpreted into stats, charts, and graphs in the OpManager console.
Pros:
- Tests for LAN performance
- Tests for links to remote sites
- Discovers and documents a network
- Polls network devices for status reports
- Scans servers for resource availability
Cons:
- Not a SaaS package
There are three paid editions for OpManager and multi-site monitoring for WAN monitoring is only available in the top plan, which is called the Enterprise Edition. ManageEngine also provides a Free edition. This is limited to monitoring three devices and has limited functionality. The software for all versions is available for hosting on Windows and Linux. You can also access the package on the marketplaces of AWS and Azure. A 30-day free trial is offered for all platforms.
EDITOR'S CHOICE
ManageEngine OpManager is our top pick for a network latency tool because the system has specific features to test the latency of a LAN and on connections between sites. However, the package has an ongoing network performance monitor at its heart. This service discovers and maps a network, so it is easy to see what route would be taken for data to pass from one endpoint on the network to another. This provides instant knowledge of the network’s complexity. It is possible to set up an alert on the VoIP performance monitor that will notify you if latency drops below a given level.
Download: Access 30-day FREE Trial
Official Site: https://www.manageengine.com/network-monitoring/download.html
OS: Windows server, Linux, AWS, and Azure
2. Paessler PRTG Network Monitor – FREE TRIAL
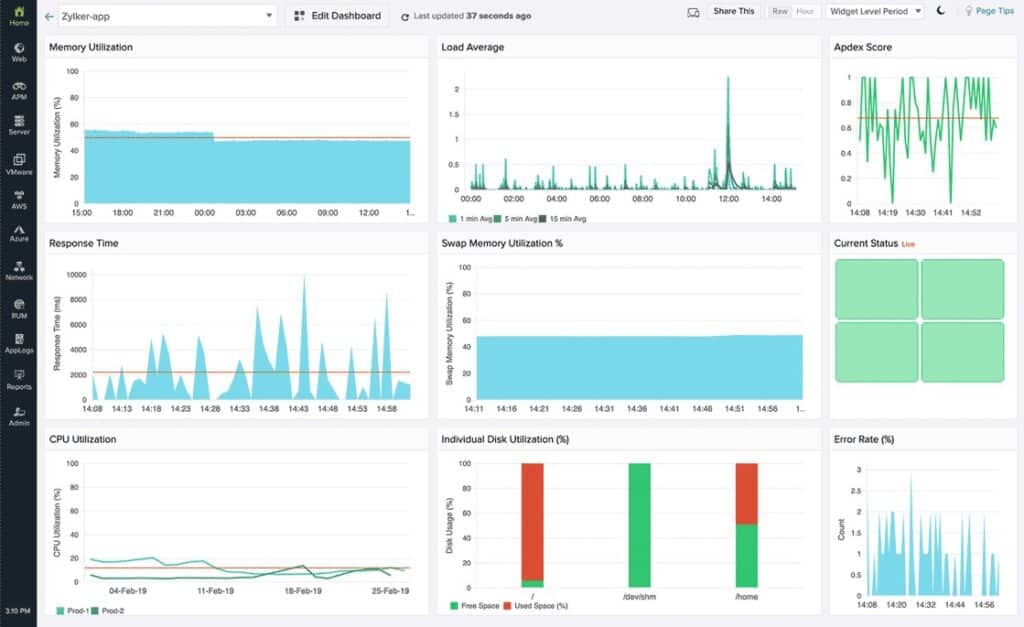
Paessler’s PRTG Network Monitor is a very comprehensive networking monitor that can give you a detailed analysis of your network. It has broad coverage and will monitor networks, servers, and applications. Thereby, it is an excellent solution for medium or large businesses that rely on many servers, switches, and firewalls. The best thing about PRTG is its centralized nature, allowing you to monitor the entire network from a single platform. Having access to all your networking records from a single location can help you thoroughly assess the network. PRTG also features an auto-discovery feature that would automatically gather monitoring data of all recently connected devices.
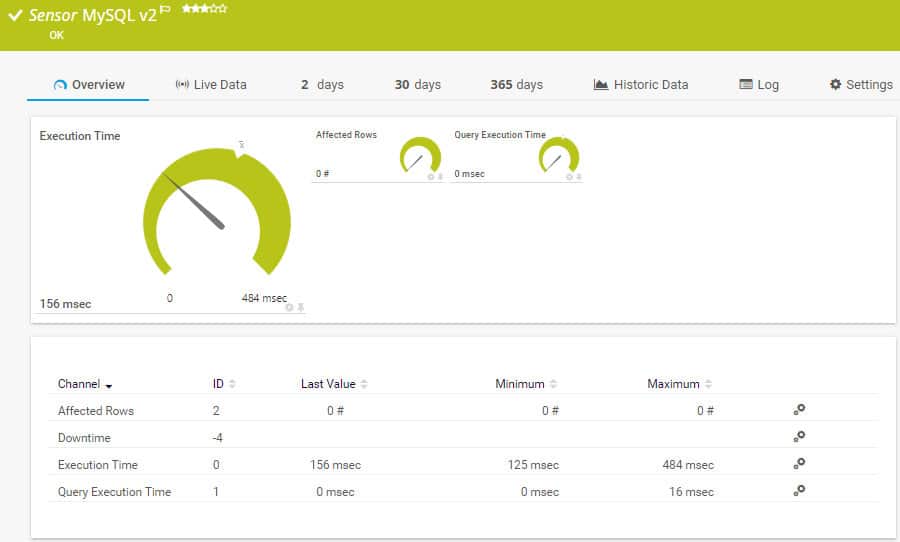
PRTG features a wide variety of utilities known as sensors. For example, the Ping jitter sensor can provide information about the RTT of various packets and help you locate the cause of latency. Also, PRTG can monitor disk usage, connected IoT devices, cloud services, and network bandwidth. PRTg can also monitor and report packet loss, jitter, and packet arrival sequence. PRTG offers a customizable dashboard providing detailed macro and micro analyses of various metrics. It can also record historical data allowing you to compare the metrics at different time intervals. A color-coded map on the dashboard can help you visually locate network performance issues. The various sensors on the dashboard allow you to assess multiple servers’ different bandwidth requirements and optimize the network expediently.
However, PRTG uses its proprietary database instead of the commonly employed MySQL and Microsoft SQL, which can cause compatibility issues and prevent the admin from writing their SQL queries. Also, it is a very detailed monitoring tool and requires time to explore fully.
Pros:
- Uses a combination of packet sniffing, WMI, and SNMP to report network performance as well as discover new devices
- Autodiscovery reflects the latest inventory changes almost instantaneously
- Drag and drop editor makes it easy to build custom views and reports
- Supports a wide range of alert mediums such as SMS, email, and third-party integration
- Supports a freeware version
Cons:
- Is a very comprehensive platform with many features and moving parts that require time to learn
PRTG has a variety of pricing plans allowing you to pick the one which would be most suitable for your networking needs and ensuring you get the best experience. Start a 30-day free trial.
3. Site24x7 – FREE TRIAL
Site24x7 Network Monitoring Tool is available in two parts, i.e., the bandwidth analyzer and SNMP-based monitoring performance device. It uses a wide range of protocols and technologies like sFlow, NetFlow, NetStream, and more to extract traffic data and monitor network devices. The traffic analyzer also shows the traffic flow volumes per connection.
Key Features:
- Monitors routers and switches
- Secures gateway with firewall monitoring
- VPN Latency tracking
- Monitoring sensors and VoIP service quality
- Monitors multi vendor devices
Why do we recommend it?
Using the cloud-based tool, organizations can monitor the live traffic pattern graphs and perform QoS testing on specific links. It even triggers an alert as the series of performance thresholds exceed the set limit and sends an instant messaging post, email, or SMS to the technical team.
Organizations and network administrators can view all the top interfaces depending on the error, usage, traffic, response time, or packet loss from a single dashboard. It even helps track different metrics (apart from performance metrics) like latency, packet loss, and jitter to access VoIP service quality.
Who is it recommended for?
Site24x7 offers access to multiple modules and users can choose the subscription plan based on their capacity level. For instance, large businesses that demand more capacity might need to pay a higher fee to gain benefits.
Pros:
- Allow tracking bandwidth usage, performance issues, peaks in traffic volumes, and latency all from a single console
- Discover devices and draw maps for better visibility and understanding of networks and their connections
- It has a user-friendly interface, out-of-the-box device templates, and supports multi-vendor devices
- Monitors and provides actionable insights into the traffic, packets, and errors
Cons:
- The tool comes with a wide range of features and exploring them demands more time.
Access the 30-day free trial.
4. ManageEngine OpManager Nexus – FREE TRIAL

ManageEngine OpManager Nexus, formerly OpManager Plus, provides in-depth control and visibility into your network infrastructure. Specifically, it monitors latency across your network and helps fix issues before they impact your operations.
It provides insights about your latency by tracking response times and packet losses in real time. It uses SNMP, ICMP, and TCP protocols for comprehensive coverage. Data from these protocols is correlated to identify the location and root cause of latency. It also analyzes historical performance and current trends to dynamically adapt the baselines to ensure accurate alerts. Based on the insights, OpManager Nexus sends notifications through multiple channels, so you can address them quickly.
Another salient aspect of this tool is its visualizations. It displays data through dashboards, reports, graphs, color-coded timelines, and network paths.
Pros:
- Reduces false alarms.
- Displays data in a way that anyone can understand.
- Provides real-time information.
- Monitors latency across LAN, WAN, and wireless environments.
Cons:
- The features are extensive and go beyond just latency monitoring
OpManager Nexus costs $1,233 for the Professional edition and $19,995 for the Enterprise edition. Start a 30-day free trial.
5. ManageEngine Free Ping Tool
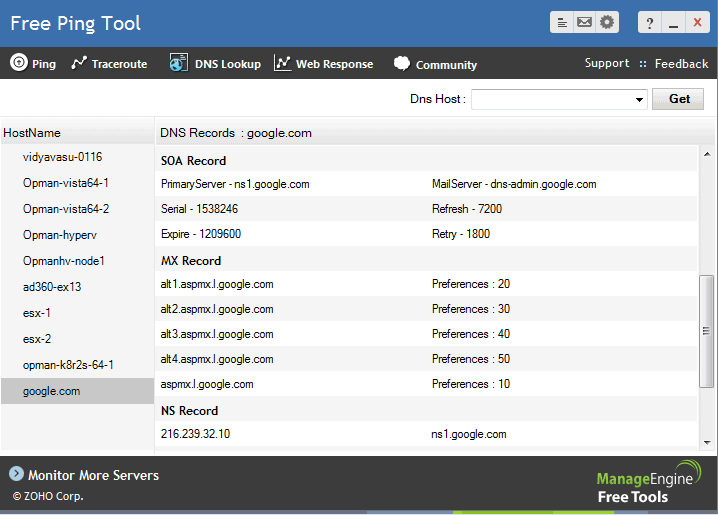
ManageEngine Free Ping Tool is an excellent utility for quick on-site troubleshooting. It offers a few essential utilities to diagnose issues, unlike other software that provides comprehensive reports quickly. In addition, ManageEngine provides Ping and Traceroute tools and a utility to measure website response time.
Ping and traceroute are two methods of identifying latency in networks. The ping tool monitors the time it takes for a packet data to reach its destination and records the time the response packet takes. Generally, it measures RTT of all connected IP addresses and refreshes the readings in real-time. Ping results are plotted on a time-series graph providing valuable information of any developing trends.
Traceroute utility keeps track of all round trip times of different hops along the circuit in the form of a bar. The Graphical illustration simplifies pinpointing the longest hop since the length of the bar visually represents it.
Web response app keeps track of response times to web servers and presents them in the form of a graph to quickly assess webpages that take the longest to respond. The graph also updates redirection times and web response times in real-time.
Pros:
- Excellent interface – easy-to-execute tests
- Can specify multiple hostnames
- Great for one-off tests and SMB networks
- Completely free
Cons:
- Lacks automated continuous monitoring
However, you will have to manually enter individual IP addresses since it does not feature an automatic network discovery feature like the previously mentioned tools. But, once an IP address is entered, it does not get removed until manually done so. Thus, it is an easy tool for quick network testing but is not recommended for long-term enterprise use.
6. SolarWinds Engineer’s Toolset
SolarWinds Engineer’s Toolset is yet another software from SolarWinds. It is a highly feature-packed software with more than 60 utilities measuring a broad range of metrics. Engineer toolset is designed to help you keep your network in top shape with its wide range of functionalities, including real-time monitoring, automated network discovery, device health monitoring, and many more.
The response time monitor tracks devices in real-time and presents latency and bandwidth usage information in the form of a table that is easier to compare. The response time monitor and automated network discovery ensure that all new connected devices are also monitored. CPU monitor tracks the load on the CPU in real-time and allows you to set limits for each device and notifying you when the limit is exceeded. A memory monitor can detect available memory and memory utilization in real-time. Interface monitors provide real-time information about connected routers. Furthermore, the traceroute utility lets you analyze the performance and latency of hops across specific paths. ETS also helps in the verification of DNS and DHCP functionalities for various devices.
Pros:
- Easy to use, tools are self-explanatory and designed to get the job done quickly
- Includes a suite of other helpful tools, specifically designed for network administrators and on-site technicians
- Aids in device discovery and testing
- Can help verify DNS and DHCP functionality for different devices
- Can easily export or import results from previous scans
Cons:
- Would like to see a longer 30-day trial time
Get started with a 14-day free trial.
7. SolarWinds NetFlow Traffic Analyzer
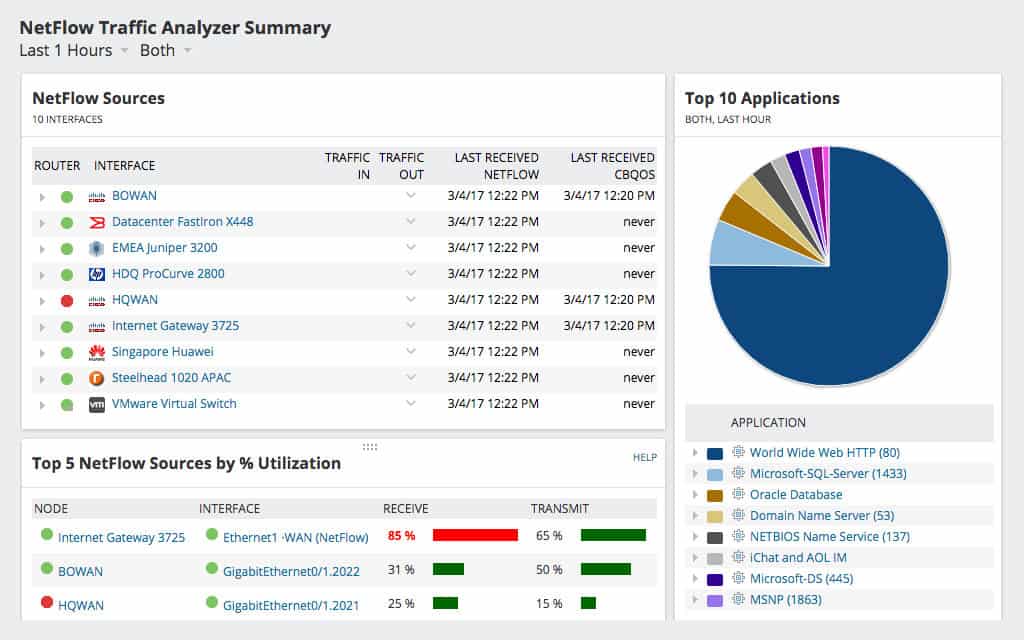
SolarWinds NetFlow Traffic Analyzer is yet another utility-packed tool from SolarWinds. NTA offers users a very simplified view of concise information related to network traffic and bandwidth utilization. The information can then be correlated with the connected devices and the applications used to identify the areas across the network that may be causing latency issues. Finally, the problem can be traced back to the device causing it.
NTA can help users identify the users or applications using the most bandwidth and plot the information in time-series graphs through data transmission patterns. The graphical representation of data can aid you in identifying trends both in the short term and long term. Like Network Performance Monitor, NTA can help you compare metrics side by side. NTA also keeps a record of historical data to help you analyze the effectiveness of network policies and the implementation of new methodologies. The performance review can help you make an effective decision for the smooth operation of the network in the long term.
Pros:
- Great interface that balances visualizations and key insights well
- Highly customizable reports, dashboards, and monitoring tools
- Uses simple QoS rules for quick traffic shaping
- Built with large networks in mind, can scale to 50,000 flows
- Available for both Linux and Windows
Cons:
- Is a highly specialized suite of tools designed for network professionals, not designed for non-technical users
You can register for a 30-day free trial.
Conclusion
Networks are a necessity in the modern world of data communications. Therefore, organizations need to ensure all networks operate on the lowest latency channels to avoid disruptions. Various measures and tools can be used to achieve optimum network performance. However, specialized network monitoring tools are crucial for network administrators since they provide an in-depth network analysis, resulting in more efficient networks.
Network Latency Tools FAQs
How can network latency be reduced?
Network latency can be reduced by optimizing network infrastructure, such as reducing network congestion and improving network routing. Additionally, implementing a content delivery network (CDN) can improve performance by caching content closer to end users.
How can network latency be tested?
Network latency can be tested using tools such as ping, traceroute, and network performance monitoring software.
How does network latency impact cloud computing?
Network latency can impact cloud computing by slowing down data transmission and increasing response times, which can lead to slower application performance and decreased productivity.
How can businesses improve network latency?
Businesses can improve network latency by optimizing network infrastructure, implementing a content delivery network (CDN), and using network performance monitoring software to identify and resolve issues.
What are some common causes of network latency in a business environment?
Some common causes of network latency in a business environment include network congestion, outdated network equipment, and network routing issues.
How can businesses prevent network latency from impacting business operations?
Businesses can prevent network latency from impacting business operations by implementing network optimization strategies, such as reducing network congestion and improving network routing, and by using network performance monitoring software to proactively identify and address issues.