The JBoss application server is a free, cross-platform Java server that was made in Java EE. Use it to make, deploy, and host Java applications, services, and business elements that are very, very transactional. In this case, it’s based on the Enterprise JavaBeans specification, but it wants to make sure that all e-business applications can run on high-quality platforms and that they always work well.
There are many features in the JBoss application server that help keep applications running smoothly at all times. These include security, resource management, transaction support, load balancing, clustering, and clustering to keep applications running smoothly even when they’re not. The JBoss application server, infrastructure, and hosted components all need to be kept an eye on at all times in this regard.
The Best Monitoring Tools for JBoss
1. Site24x7 Application Performance Monitor – FREE TRIAL
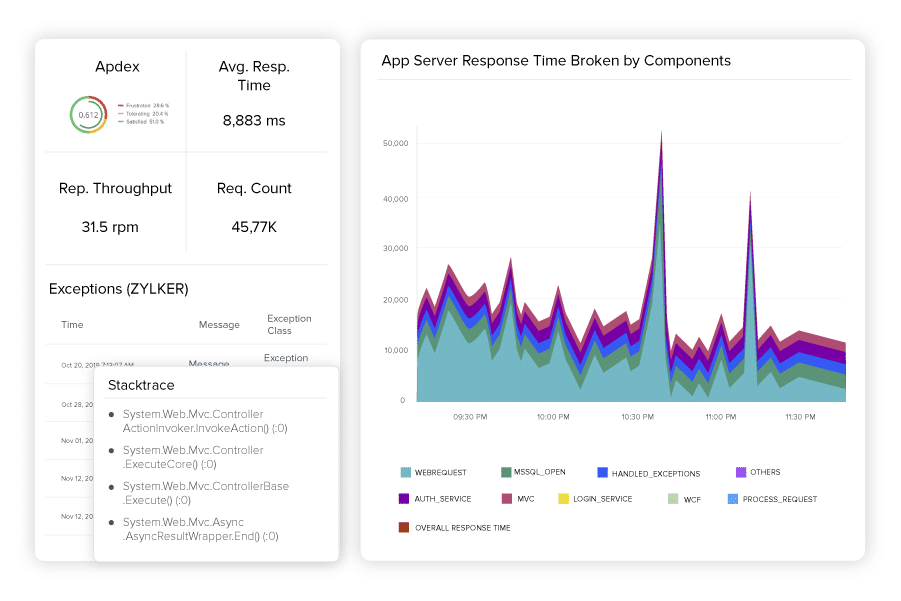
One of the most popular cloud-based systems monitoring platforms is called Site24x7. Using the Site24x7 Application Performance Monitor (APM), Java-based applications may be analyzed and their processes linked together. As a result, APM can determine which Java programs are executing over which JBoss services, as well as which additional apps or server resources are supporting the process that the Java program and JBoss start.
There’s no need for a separate server to run the monitoring software since all of the processing power is included in the pricing. Because this monitoring tool is a subscription service, there are no significant out-of-pocket expenses to begin using it. The system requires the installation of an agent on the server hosting the application to function. The Site24x7 server receives the data from this agent over an encrypted connection.
Cloud-based system consoles may be accessible using any regular Web browser. The tool’s displays may be rearranged using a drag-and-drop feature. The Site24x7 APM’s other features, such as performance tracking, may be enhanced. Synthetic transaction monitoring and real-user tracking in the APM are two of the most common examples of this problem. Incorporating a Java monitor and activity logs from a website allows you to track down the server’s operating system. You can start a 30-day free trial.
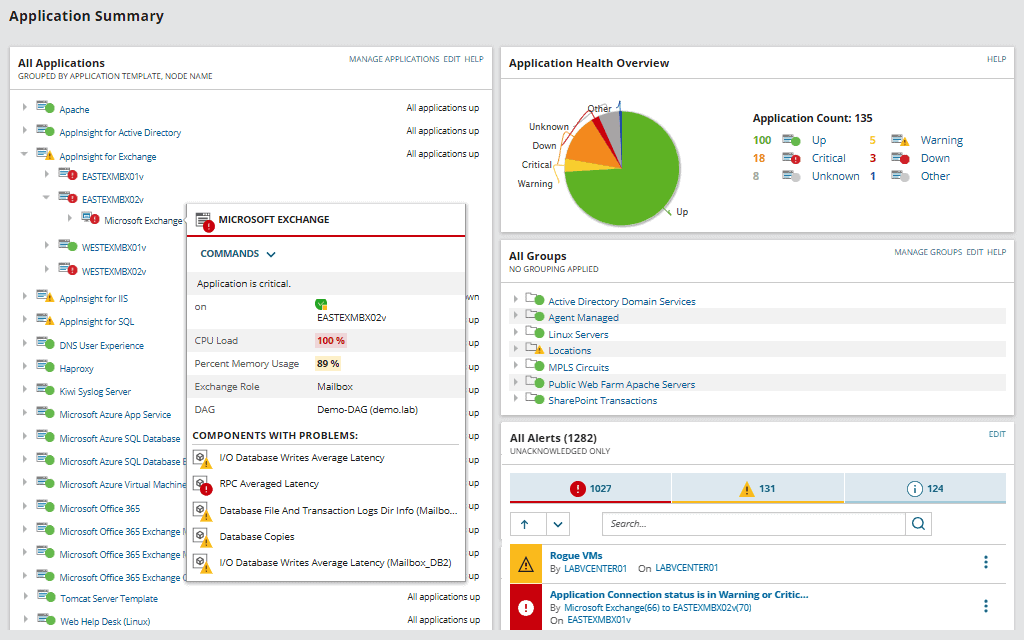
2. ManageEngine Application Manager – FREE TRIAL
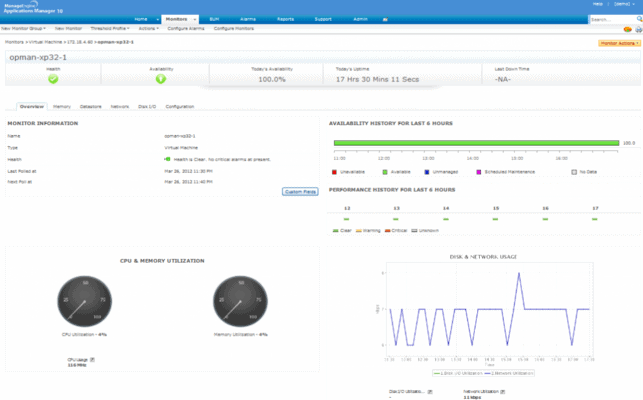
With its comprehensive performance measurements, effective troubleshooting, and broad reporting capabilities, JBoss Monitoring with ManageEngine Applications Manager achieves this accomplishment. It gives real-time, extensive insight into the JBoss server’s performance, including service response time, web applications spread across the server, and various components.
Enterprise Java Beans, Java Virtual Machine, Java Database Connection Pools, and servlets are examples of these. ManageEngine Applications Manager enables the automation of restarting the JBoss server if memory utilization exceeds set thresholds through the execution of custom scripts, to eliminate repetitious chores. Alternatively, you can utilize the JMX bean to expand the database connection pool size.
When troubleshooting, ManageEngine Applications Manager keeps track of both Java heap and non-heap memory and generates a heap dump to help identify potential issues.
The monitoring of the JBoss server’s key performance metrics, as well as databases, guarantees that file growth and CPU/disk consumption remain below acceptable limits.
With its mobile web client and native iPhone app, ManageEngine Applications Manager allows you to keep track of the performance of JBoss servers to take quick and effective corrective action. This functionality allows you to troubleshoot and handle any potential performance issues while on the move, without having to return to the office, ensuring that end-user happiness is maintained.
3. SolarWinds Server & Application Monitor
In addition to monitoring the JBoss application server and apps, the SolarWinds Server & Application Monitor includes a JBoss monitoring tool. As a result, users will experience less downtime and less frustration with delayed servers or apps.
It does this by automatically finding applications and keeping an eye on servers. The SolarWinds Server and Application Monitor deliver excellent insight into health parameters.
Using the built-in AppStack dashboard, administrators can quickly and easily monitor the availability, performance, and critical components of their servers. Using the JMX protocol, SolarWinds Server and Application Monitor collect important performance indicators, such as packet loss, response time, and latency, as well as intelligent baseline alarms.
These alerts provide for rapid and proactive troubleshooting, with comprehensive performance visibility that aids in the separation of issues, allowing for a more accurate diagnosis. The ability to remotely stop, start, or restart JBoss application server processes and services while they’re running in real-time makes debugging much faster. The monitoring features of SolarWinds Server and Application Monitor may be extended to any bespoke or home-grown JBoss applications.
The program uses an out-of-the-box monitoring framework to watch critical memory statistics, to find and fix memory leaks in the Java environment. Here, you can see how much memory the JBoss application server has in both its heap and non-heap areas. This includes pending and pool memory as well as total memory, garbage collection, and more. People who use SolarWinds Server and Application Monitor also keep an eye on things like fans, temperature, and power supplies. This helps them figure out what could go wrong, as well as what has already happened.
4. GroundWork Monitor
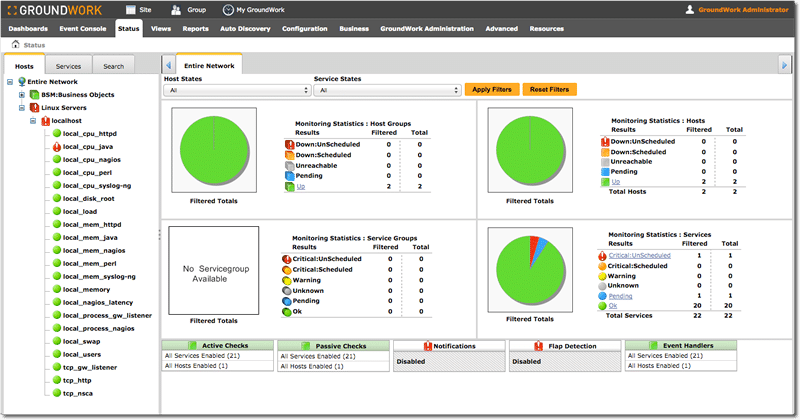
Groundwork Monitor is a comprehensive IT infrastructure monitoring system that integrates open source and proprietary technologies into a single web services platform.
It has a flexible architecture that supports custom reporting and setup to give high-quality network, system, cloud, and application monitoring. It’s possible to publish, manage, and customize hosted content using JBoss Portal Platform 6, an open-source, standards-based environment that acts as a portal’s Web interface.
Administrators may further tailor GroundWork Monitor’s basic and bespoke dashboards to meet their specific needs. As a tool for troubleshooting, dashboards give a rapid, effective, and thorough overview, with the ability to dive down into individual sub-applications when necessary.
Full-scalability, it presents all acquired data using its NagVis presentation tool for simpler understanding. The dashboard’s inclusion of web metrics makes it feasible to monitor web performance. All visible devices on your local subnet are immediately discovered by GroundWork Monitor’s auto-discovery function, which then performs a series of service checks on all devices with appropriately defined criteria. Adding and coordinating network resources is made easier by the database’s ability to close events, clean up devices and services, and clean up externals.
GroundWork Monitor keeps track of host and service groups, as well as downtimes, and the configuration reports it generates define all of the included commands and the host groups and services they support. Create, update, and distribute customized monitoring reports with the help of GroundWorks BIRT Report Designer.
Reports on availability, events, performance, and status, as well as insights into performance view, notifications, and alerts, as well as outages that have happened or are currently happening, are just some of the many tools available for this purpose. To warn you of difficulties, GroundWork Monitor utilizes a sophisticated notification and alerts manager, and its auditing features enable you to keep track of system configuration as well as run-time modifications in an audit trail.
While its Hybrid Cloud Monitoring focuses on API-to-API connections, its business service monitoring capabilities concentrate on monitoring business groups, processes, and applications. Administrators may also access product documentation and a support portal via GroundWork monitor.
5. Nagios
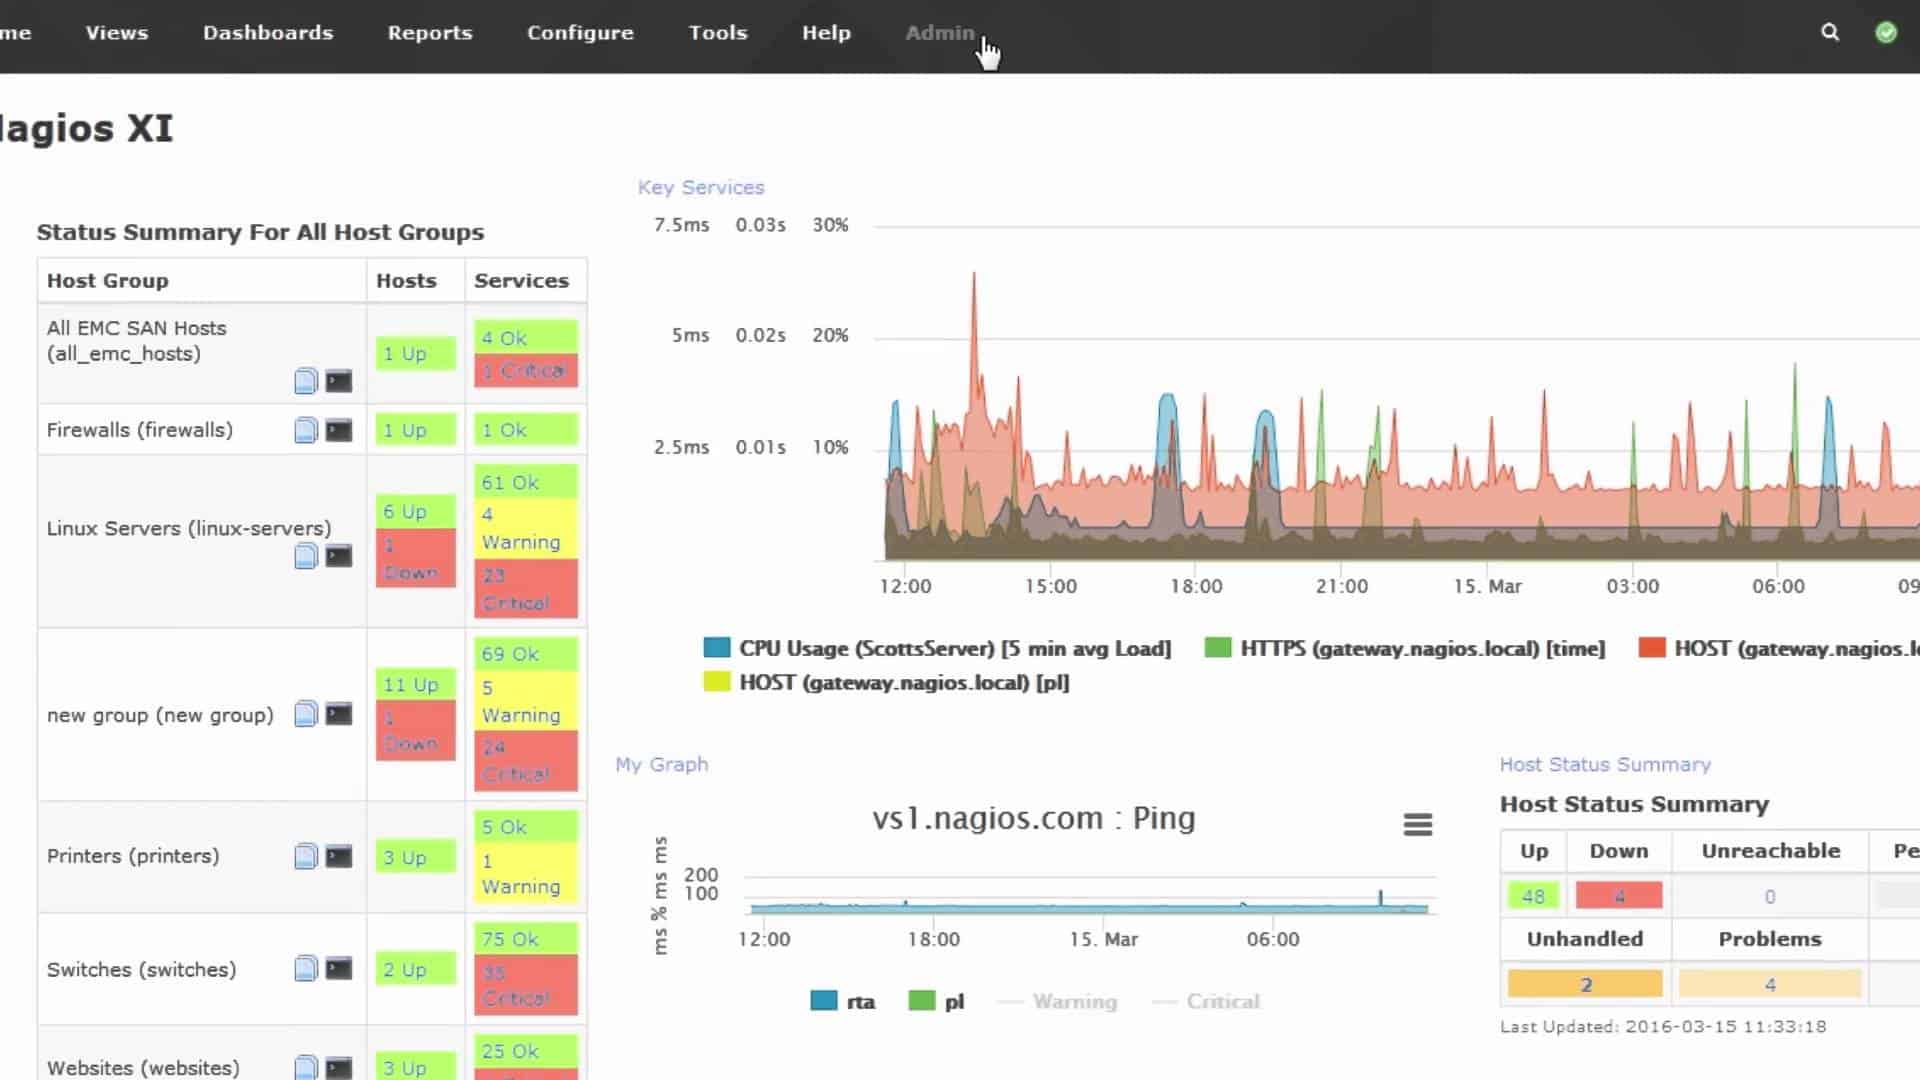
Nagios supports intensive monitoring of JBoss application servers to deploy its monitoring features more effectively. As a result, application servers, services, and applications are more likely to be available, and administrators can rectify problems before they harm performance.
As soon as an issue is discovered or corrected, Nagios notifies you through email or a pop-up window on your computer’s desktop. This makes it easier to monitor the overall health and performance of the JBoss application server.
Several features in Nagios may help you monitor JBoss application servers, such as the threat status, memory utilization, and more. This plugin offers a monitoring framework for JBoss ESB and JBoss application servers, with rudimentary support for JBoss ESB.
With the Perl Nagios plugin and an in-depth JBoss Java EE server plug-in, it is possible to do extensive checks on all parts of the server. Many JMX properties may be checked with the Perl Nagios plugin, which employs a straightforward protocol to pull data from the MBean archive on the JBoss application server.
6. eG Enterprise
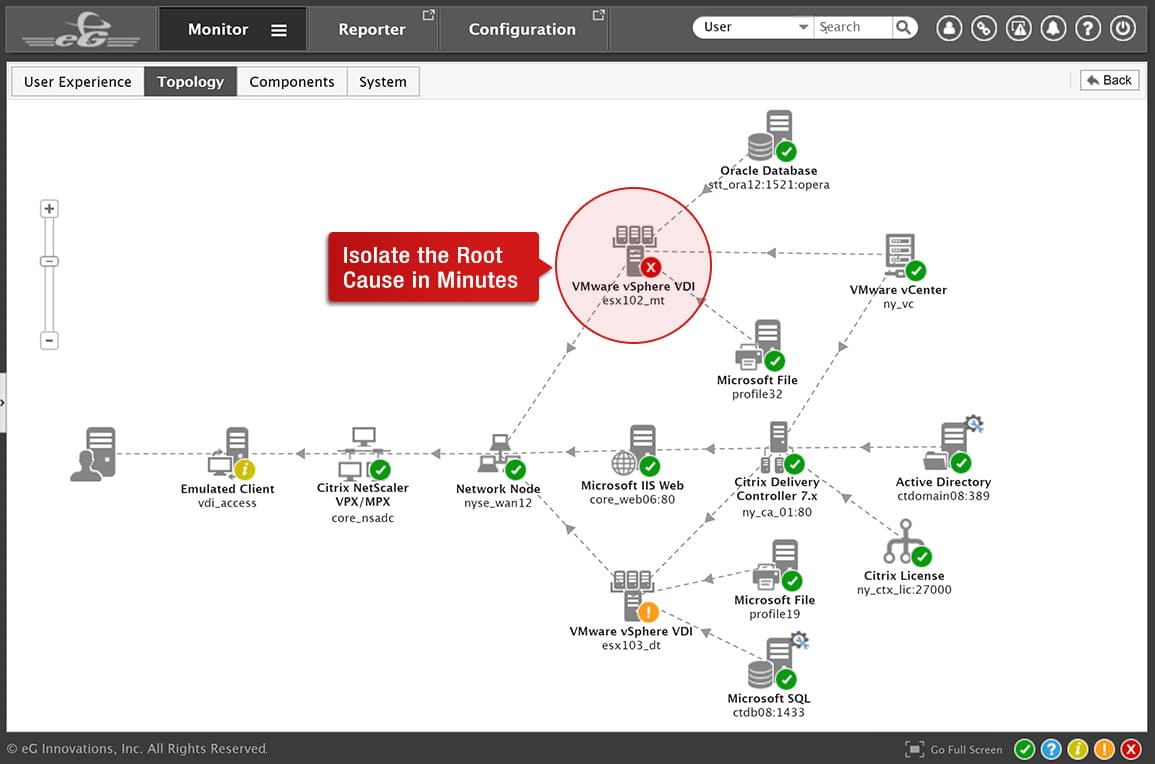
eG Enterprise is a comprehensive IT infrastructure performance monitor with auto-diagnostic capabilities that gives you a single view of your whole JBoss architecture. From a simple interface, it provides a comprehensive insight into the JBoss application server and all Java applications.
eG Enterprise monitors several elements of the JBoss application server using purpose-built monitoring models, to ensure optimum user satisfaction and uptime. Application code, database connections, sluggish queries, JVM, web and EJB containers, external service calls, and more are all examples of these. Its proactive alerting mechanism aids in the early detection of problems, enabling administrators to identify and rectify issues before they harm application or system availability. Deep diagnostics for all aspects of JBoss performance are also supported by eG Enterprise.
Java transactions, DataSource connection pool connections, amount of incoming requests by each connector, JMS message queues, EJB thread pool size, JPA, and JSP are all examples of these. eG Enterprise also provides deep insight by isolating business transactions impacted by the JBoss application server performance issues and detecting memory leaks and out-of-memory problems in the JVM. When paired with the other factors discussed, monitoring the time for each servlet to run and measuring the execution, creation, invocation, and removal metrics for each EJB greatly enhances debugging.
When combined with eG Enterprise’s deep diagnostic capabilities, the automated approach for finding underlying causes of performance problems removes the idea of finger-pointing and considerably speeds up the resolution of issues discovered. With its capacity to discover code-level errors, eG Enterprise takes this work a step further. This enables managers to delve deep into the application code to determine the exact reasons for sluggish business processes, as well as isolate wasteful code and mistakes. For this reason, you may additionally segregate Java heap memory settings and long-running database queries.
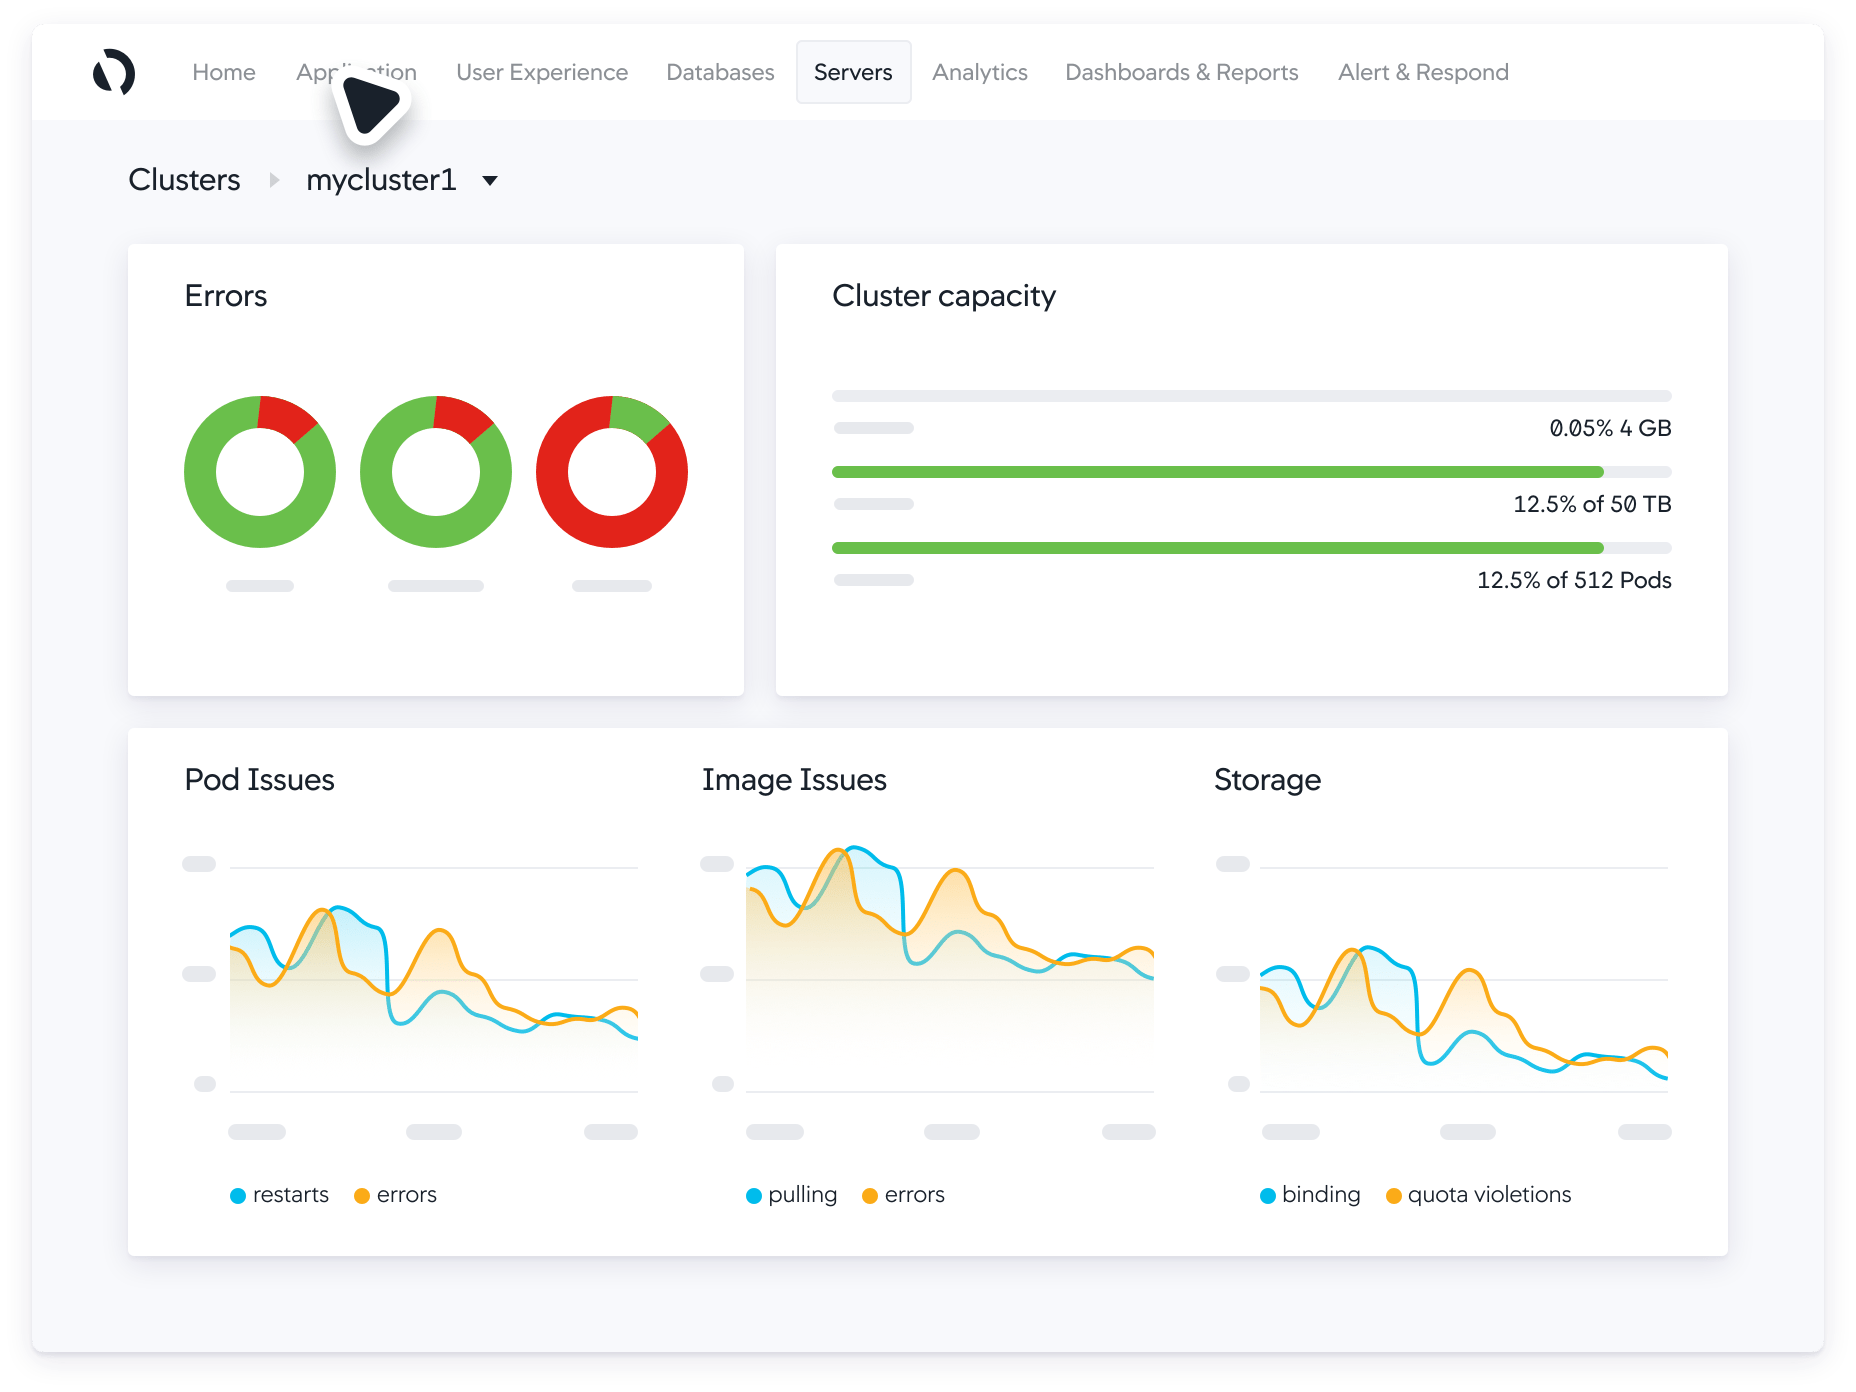
7. Dynatrace
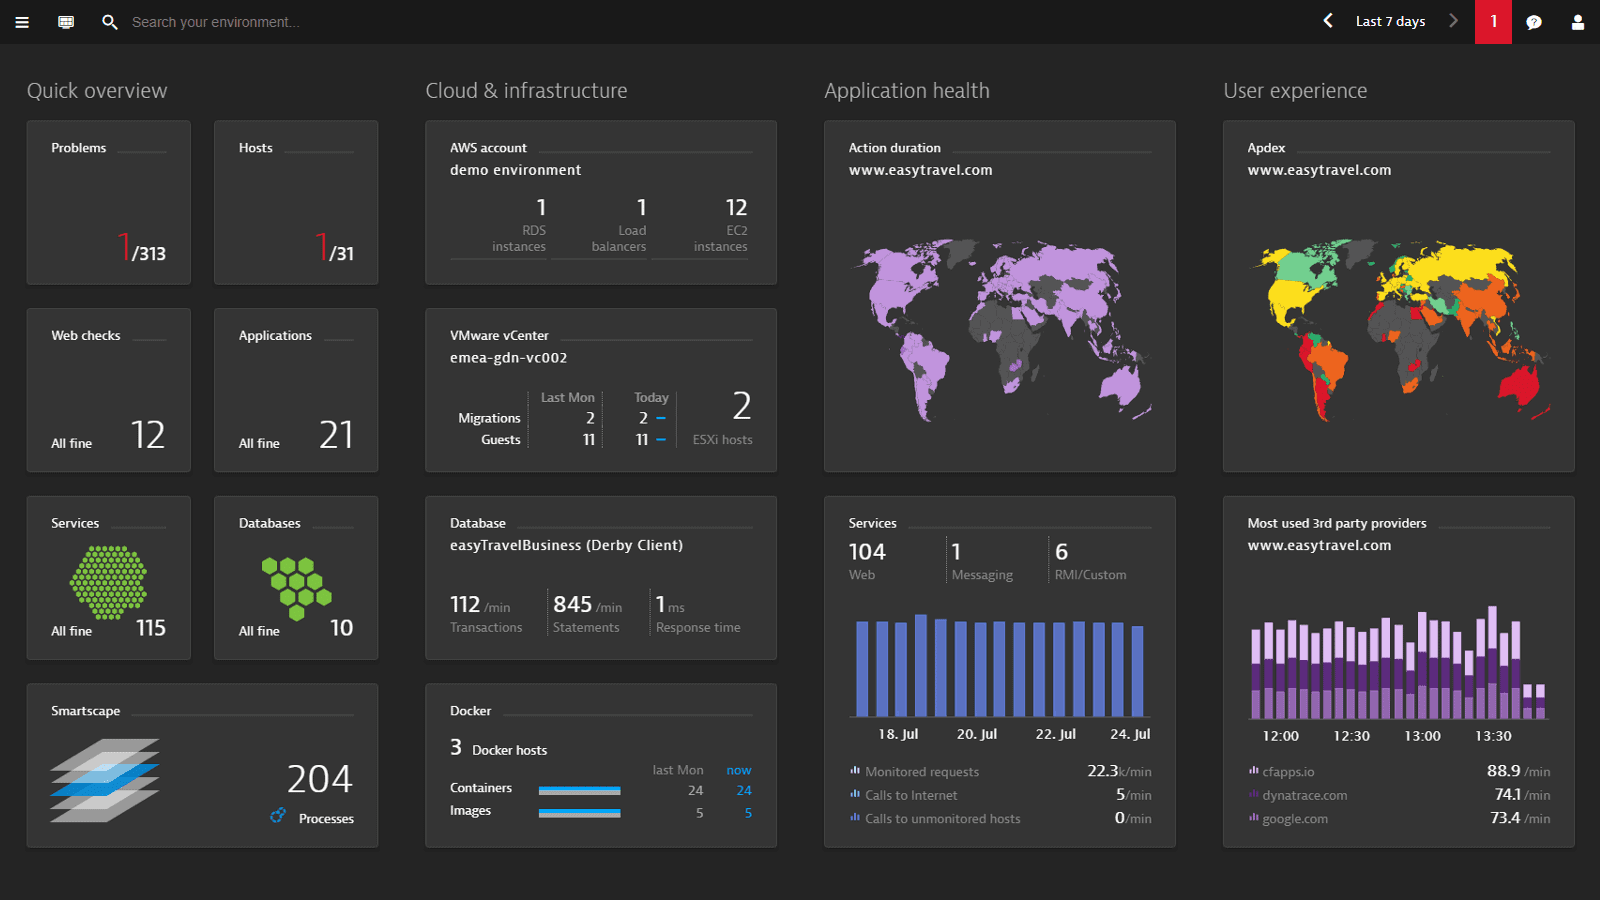
JBoss application servers may be monitored by Dynatrace, which learns the full architecture of JBoss in minutes and provides visibility from browsers to specific database statements using its artificial intelligence.
This enables Dynatrace to detect the JBoss environment’s dependencies and investigate availability and performance issues throughout the whole JBoss application server. ‘In addition to monitoring JVM metrics and custom JMX metrics, Dynatrace additionally examines the database activity of all apps running on JBoss throughout the monitoring process. Dynatrace conceptualizes the development and effect on the user experience of errors, performance, or application problems via root cause analysis. Admins may utilize this information to identify areas that may be influencing users badly, which might result in a loss of money or a poor reputation.
As a large-scale solution, Dynatrace includes support for all major Java frameworks, as well as metrics such as trash collection, database accesses, and suspension rate. Preventative detection and troubleshooting are both assisted by this method. Detailed information on the health of JBoss’s CPU, memory, and network resources helps in this endeavor. Deployment eliminates the need for manual setup since auto-detection kicks in right away. If you’re using Dynatrace, you can see exactly where your programs are using CPU resources, whether they’re in the background or other proprietary or scheduling services.
Additionally, Dynatrace keeps track of and understands the execution of every service and service request in the system, end-to-end.
In addition, if administrators are using service flow, it gives them a service or service-request type’s point of view. The JBoss application server’s general structure may be seen using Smarts cape.
8. AppDynamics JBoss Application Monitor Tool
AppDynamics monitors the JBoss application server and apps to bridge the gap between application administration and business product consumption efficiently.
Traceability and broad visibility into infrastructure, performance, and the production environment are how it does this. When JBoss visibility is vital for business operations, this is a must-have for your team’s overall monitoring capabilities.
Another feature offered by AppDynamics is the ability to keep track of JBoss application code running on it, together with the execution and accessibility of the server itself.
Administrators can build better digital experiences for end users by monitoring performance in real-time, and the information acquired helps to discover and fix problems immediately.
JBoss application server and JVM processes are automatically discovered by AppDynamics, which employs machine learning to automatically identify irregularities in these processes. A combination of these features, together with AppDynamics’s extensive diagnostic capabilities, enables administrators to investigate and resolve any issues.
AppDynamics warns administrators of performance problems before they affect the JBoss application server or the availability of applications using dynamic SLA base-lining and its extra proactive alerting capability.
To mitigate the possible reduction in end-user service levels due to poor performance, administrators might utilize this tool. AppDynamics’ collection and reporting of each application’s run-time exceptions give extra insight into stack traces, such as user requests that fail or time out, and business operations. It also keeps an eye out for memory leaks, automatically locating them inside the JVM.
For the identification of these memory leaks, there is no need for a lot of analysis from the end-user. AppDynamics does this over time by making use of heap use and crucial memory pools.
Conclusion
Since the JBoss application server and its applications are always in demand, the server must be monitored and managed successfully and continuously. As a result of its complexity, the necessity for additional monitoring tools and software has become imperative.
A wide range of additional tools and software is used to help in the early identification of possible performance issues and the subsequent troubleshooting of problems discovered. As a result, they guarantee that service-level agreements are met, minimizing interruptions to end-users and preventing financial losses or reputational damage as a result of downtime. According to the size and nature of the business, as well as the prices, there are a variety of software options available.
All of these solutions should be able to provide you with a better idea of the functionality available to meet your individual monitoring needs. We hope that the information collected here will assist you in making an informed decision on the best solution for your situation.