Hardware monitoring software helps in the tracking and monitoring of how the hardware performs generally. This allows users to discover potential issues with their performance and then can resolve them. This visibility also helps users track changes that may arise over time from the operational capacity of the hardware. In addition, monitory elements such as the voltages, the CPU and the GPU temperature, etc., can be used as a standard to compare the performance benchmarks ideal for the hardware itself.
Here is our list of the best hardware monitoring tools:
- NinjaOne RMM – EDITOR’S CHOICE This remote monitoring and management service implements continuous monitoring of networks and endpoints, maintaining a hardware inventory and alerting for status issues. This is a cloud-based system. Get a 14-day free trial.
- Paessler PRTG Network Monitor – FREE TRIAL A hardware monitoring tool that can monitor all of your network devices’ CPU, RAM, and hard drives. Download a 30-day free trial.
- Progress WhatsUp Gold – FREE TRIAL An advanced hardware monitoring tool that checks more than 60 parameters to provide accurate information about your hardware’s health and performance. Start a 30-day free trial.
- Atera – FREE TRIAL A system monitoring platform that delivers services from the cloud; it eliminates all hardware standards from the MSP’s site. Access a 30-day free trial.
- ManageEngine OpManager Nexus – FREE TRIAL Offers robust hardware monitoring with real-time data and customizable dashboards, making it a versatile and comprehensive tool for IT management. Start a 30-day free trial.
- Site24x7 – FREE TRIAL Hardware monitoring tool that tracks and analyzes the performance, health, and status of various hardware components within an IT infrastructure. Start a 30-day free trial.
- ManageEngine OpManager – FREE TRIAL This network monitoring tool also monitors the health and availability of your hardware components and provides real-time status information. Download a 30-day free trial.
- Datadog Infrastructure Monitoring Used both to monitor hardware and also service performance. It is put together into modules that achieve better visibility with your IT resources when jointly put together.
- FirstWave Open-AudIT This inventory management and auditing tool will carry out a general sweep of your entire system and do discovering auditing for your hardware, software, and operating system.
- Checkmk An IT monitoring system that is comprehensive and gives IT managers, DevOps team, and system administrators to recognize problems across their IT infrastructure and resolve them as fast as possible.
- Zabbix A network monitoring tool that automatically discovers devices and identifies when any devices have been connected to or disconnected during setup.
- SolarWinds Server & Application Monitor One of the most dominant tools for monitoring and averting performance problems that arise from hardware malfunctions and failures.
- Splunk Infrastructure Monitoring This cloud-based system is available on the Splunk Observability Cloud platform and provides monitoring for hardware and software on premises and on the cloud.
- AIDA64 Features a perfect incorporated stress testing utility that helps you ensure that your system is very stable.
- Intel XTU or Extreme Tuning Utility A tool designed solely for systems that make use of Intel CPUs.
- HWiNFO A hardware-monitoring utility that is free. It can monitor the voltages, temperatures, and frequencies of each piece of hardware, but most importantly, HWiNFO can go deeper by revealing in detail information about each of these components.
Why hardware-monitoring tools? Some of the reasons why development administrators use these hardware-monitoring tools, IT experts assist in the maintenance of computational performance and bring out problems to help avert downtime and change parts. The foundation of the failure of the hardware most at times ranges from old age to malware. Therefore, these Hardware-monitoring tools will sometimes join forces with other software like the log analysis software, IT alerting software, etc., to help carry out the maintenance of the entire system.
Our methodology for selecting a hardware monitoring tool
We reviewed the market for hardware monitoring systems and analyzed the options based on the following criteria:
- Automated device discovery
- Inventory tracking
- Hardware status scanning
- The ability to track physical statuses such as temperature
- Alerts for hardware problem
- A free trial or a demo option for an opportunity to assess the monitor before paying
- Value for money, provided by a competent hardware monitor that is offered at a fair price or free
The Best Hardware Monitoring Tools
1. NinjaOne RMM – FREE TRIAL
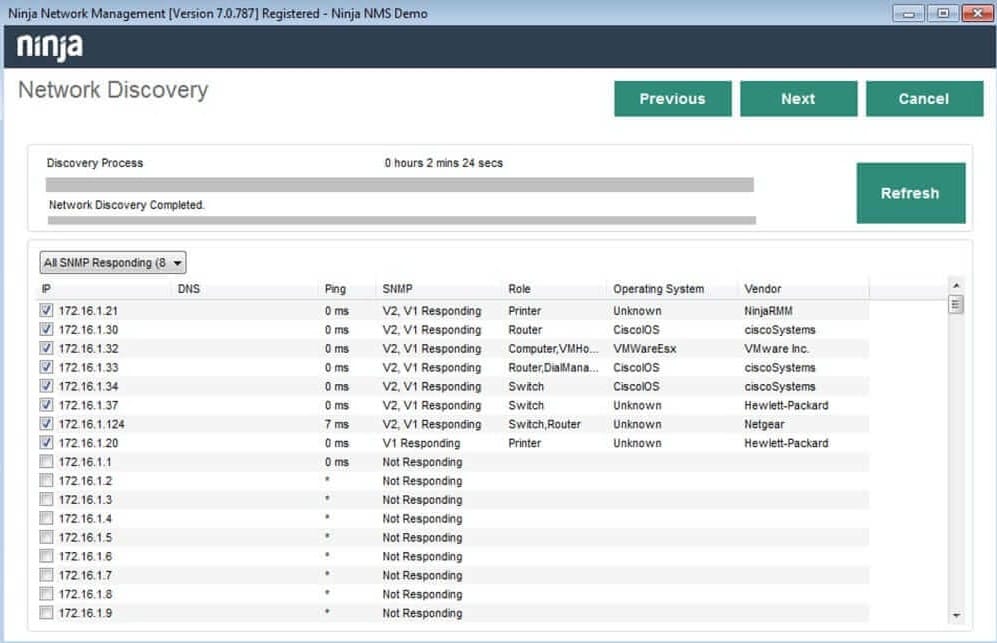
NinjaOne RMM is a remote monitoring and management package that looks after an entire site. This is a cloud-based package and each subscriber can get it to monitor multiple sites. The package installs an agent on a server that is connected to the agent that is going to be monitored. This acts as an SNMP Manager, which is a key component of the Simple Network Management Protocol. Device agents, which are already present on every network device and computer, send status reports to the NinjaOne data collector.
Key Features:
- Inventory creation and management
- Asset management details, such as device age
- Alert notifications by Slack, Teams, SMS, or email
- Also monitors software
- System performance troubleshooting tools
Why do we recommend it?
NinjaOneRMM can monitor any site in the world as long as it is connected to the internet. This means that a subscriber can watch over networks remotely through a Web-based NinjaOne console. The monitoring and management system documents all the hardware on a site and then polls them continuously for status reports. If an agent reports a problem, the NinjaOne console raises an alert.
Operating systems include an SNMP agent, so, as long as it is turned on, the SNMP polling process of the NinjaOne system. The package includes a remote access system so, if SNMP is not active on an endpoint, technicians can get to each device and turn it on. The remote access tool is just one of the endpoint management services in the RMM package. They are essential facilitators of the hardware monitoring service because they enable endpoints to be put in such a state that makes them easier to watch over.
The NinjaOne package includes a Help Desk ticketing system. When the system monitor raises an alert, that notification can be channeled to technicians as a ticket. The Help Desk system simultaneously receives support requests from users. This workload can be prioritized and distributed by the ticketing system algorithm and managers get to see the turnover of each team member and track when tasks are taking too long.
Who is it recommended for?
This system is able to monitor multiple sites simultaneously for each account holder, so it is a suitable service for central IT departments. The account system on NinjaOne allows the creation of sub-accounts and that makes the package a good choice for managed service providers because they will be able to keep the data of their clients separate.
Pros:
- Multi-tenant architecture for managed service providers
- Network discovery and hardware inventory creation
- Continuous status polling with SNMP
- Remote access
- Alerts for performance issues
Cons:
- No price list
NinjaOne doesn’t publish a price list but you pay for the service on a subscription, which is calculated per endpoint. You can get started with your assessment of NinjaOne RMM by requesting a 14-day free trial.
EDITOR'S CHOICE
NinjaOne RMM is our top pick for a hardware monitoring tool because it is able to monitor multiple sites simultaneously wherever they may be. You could monitor a worldwide company from one location with this package, however, smaller businesses can use the tool to monitor one site without support technicians needing to leave their desks and visit endpoints physically. So, all sizes and types of businesses would find this package a cost and time saver. The multi-tenant architecture of the NinjaOne account system enables subscribers to set up sub-accounts. This is needed by managed service providers to keep the data for clients separate. Alerts and an automated ticketing system make scheduling technician tasks and prioritizing work very easy. The NinjaOne RMM also provides a remote access utility and a software management system that includes a patching service.
Download: Start a 14-day FREE Trial
Official Site: https://www.ninjaone.com/freetrialform/
OS: Cloud-based
2. Paessler PRTG Network Monitor – FREE TRIAL
Paessler PRTG Network Monitor is a hardware monitoring tool that can monitor all of your network devices’ CPU, RAM, and hard drives. This particular hardware-monitoring software supports other products like Dell, Cisco, Synology, IBM, and Linksys. The process for setting up this hardware-monitoring tool is very straightforward.
Key Features:
- Autodiscovery
- Full-stack observability
- Available as a software package for Windows Server or a SaaS platform on the cloud
Why do we recommend it?
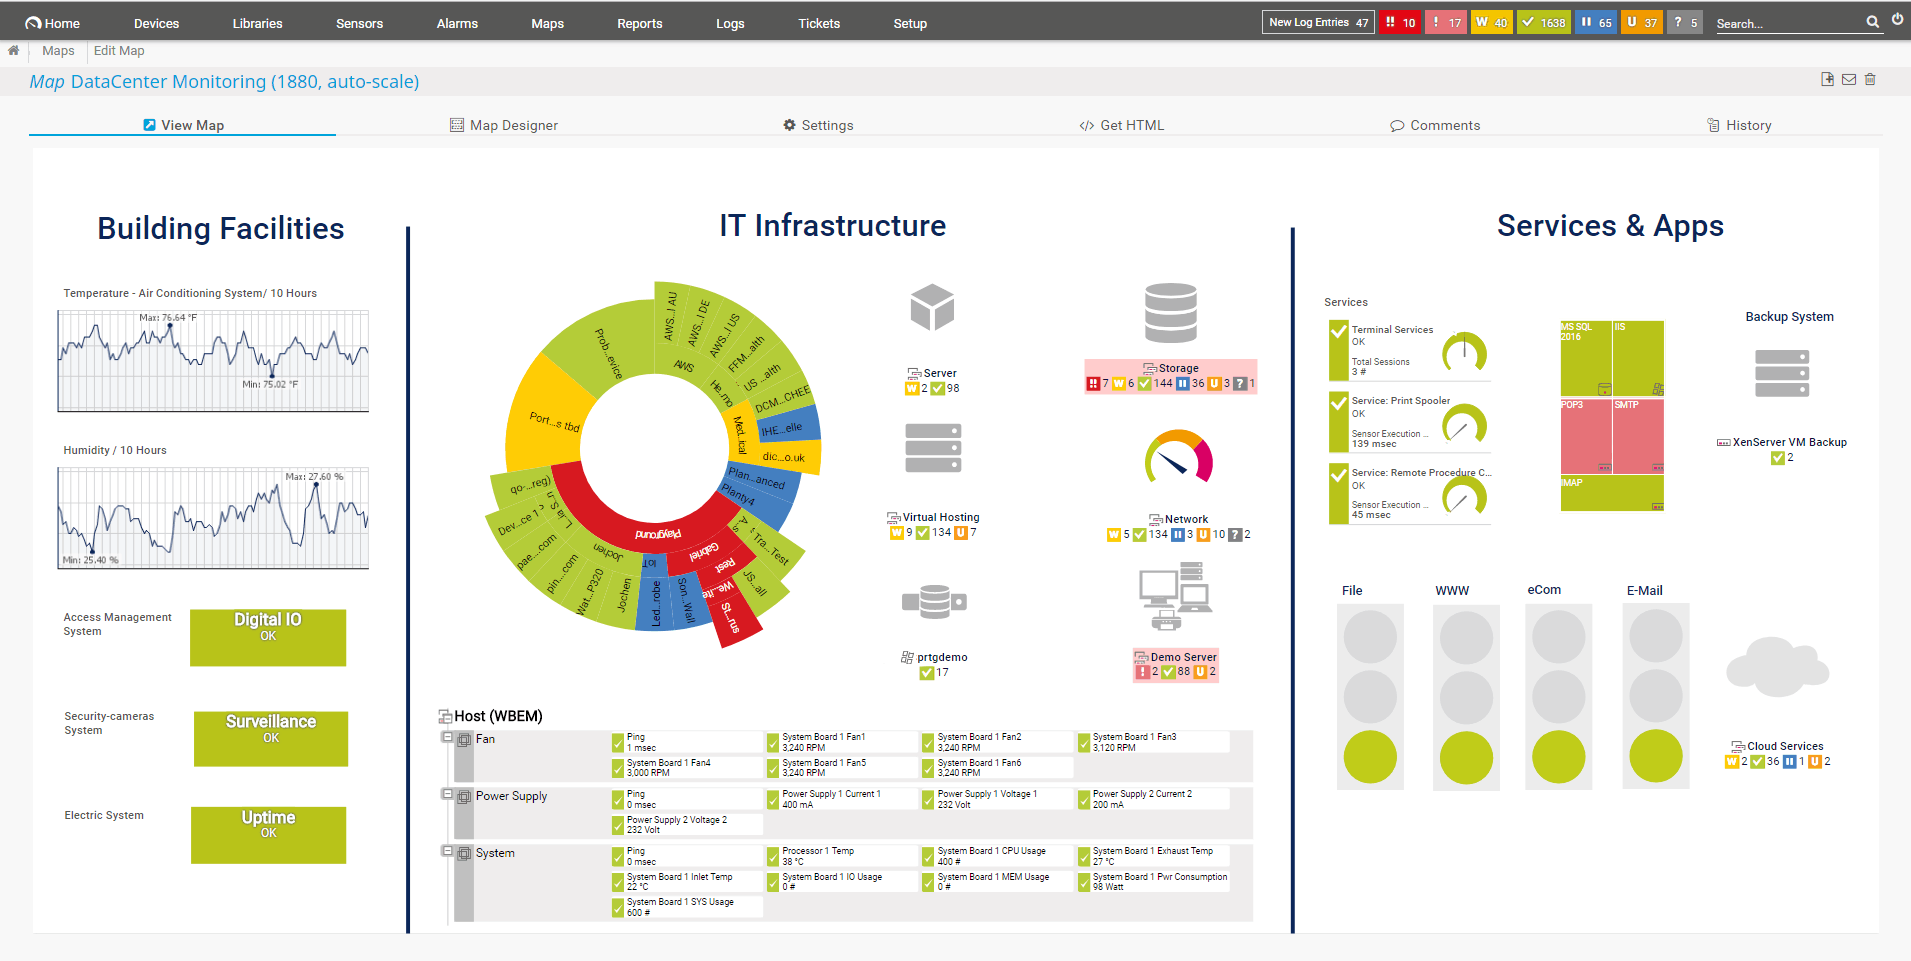
Paessler PRTG Network Monitor is a full stack monitoring system that covers networks, servers, and applications. It can extract data about network device components using the Simple Network Management Protocol and about server hardware using WMI. The package can also track equipment, such as printers.
You can discover devices that are connected to your network if you set the program to ping IP. With a drag-and-drop editor, you can create maps of your network to troubleshoot from a geographical perspective.
Who is it recommended for?
The PRTG package is suitable for any size or type of business because buyers pay for an allowance of sensors and then decide which to activate. The minimum quantity you can buy is 500 and you can use 100 for free, which is great for small businesses. The system is available as a software package for Windows Server or as a SaaS platform.
Pros:
- Uses a combination of packet sniffing, WMI, and SNMP to report network performance as well as discover new devices
- Autodiscovery reflects the latest inventory changes almost instantaneously
- Drag and drop editor makes it easy to build custom views and reports
- Supports a wide range of alert mediums such as SMS, email, and third-party integration
- Supports a freeware version
Cons:
- Is a very comprehensive platform with many features and moving parts that require time to learn
- Custom sensors can sometimes be challenging to manually configure
PRTG Network Monitor lets you use up to 100 sensors for free. After that it has a 30-day free trial to figure out your network requirements before you decide on one of the various payment plans. The number of hardware sensors determines the price you will pay.
3. Progress WhatsUp Gold – FREE TRIAL
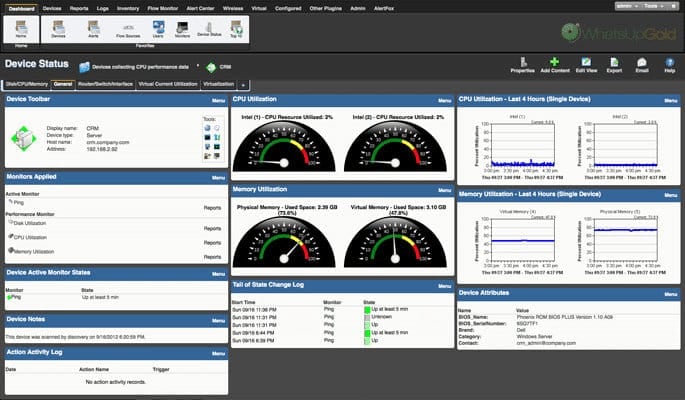
WhatsUp Gold is an advanced tool that provides visibility into the physical health of IT equipment to ensure that it works well for a long time. It gathers metrics in real-time and analyzes them to better understand the health and performance of every device. Using this information, you can take proactive and reactive measures to address issues.
Key Features:
- Monitors more than 60 metrics.
- Gathers data from devices of multiple vendors like Cisco, HP, and Dell.
- Displays the results in an intuitive dashboard for better understanding.
- Monitors UPS to gauge output power usage.
Why do we recommend it?
A highlight of WhatsUp Gold is its ability to provide information about the physical environment. Specifically, it can help you better understand the temperature, fan speed, power speed, and 60 other metrics in which your infrastructure operates. It can even provide insights into the ink and toner levels of printers, provided they support the IETF Printer MIB and RFC 3805 protocols.
All this information is further analyzed to provide meaningful insights, using which you can make decisions. The best part is that this analyzed information is displayed on intuitive dashboards for easy understanding.
Who is it recommended for?
WhatsUp Gold is a good choice for network engineers who must maintain the optimal health and performance of networks. It also comes in handy for MSPs who have to manage environments on behalf of their clients.
Pros:
- Detects failures early to reduce downtimes.
- Displays power outage supply in graphs for easy analysis and understanding.
- Supports customizable alerts for proactive maintenance.
- Uses the APC active monitor for staying on the UPS devices’ parameters.
Cons:
- Initial setup requires technical expertise.
WhatsUp Gold offers perpetual and subscription licensing options. If you go for the perpetual model, you can choose from Total Plus and Premium editions. On the other hand, the subscription model offers four editions – Business, Enterprise, Enterprise Plus, and Enterprise Scale. Start a 30-day free trial.
4. Atera – FREE TRIAL
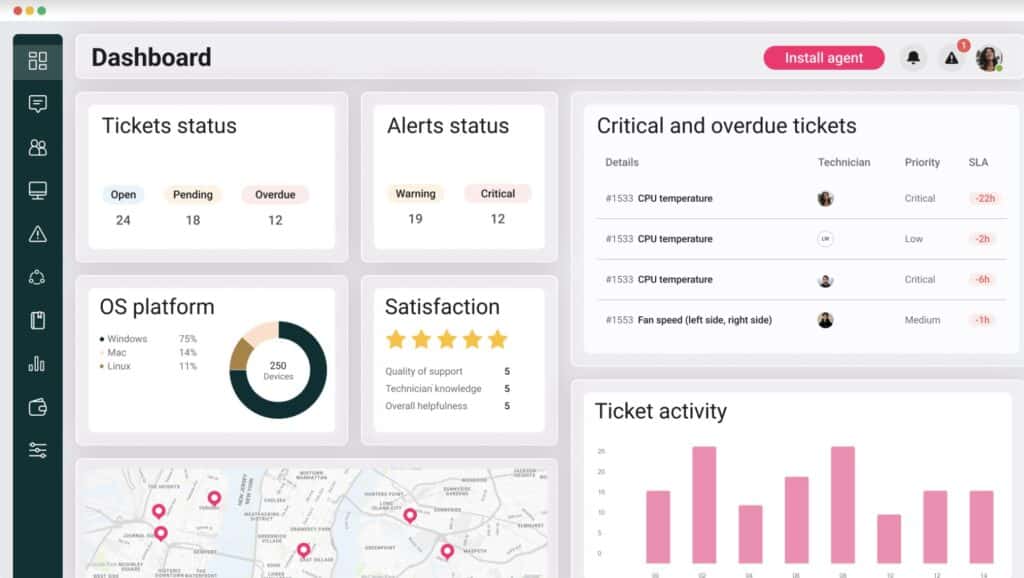
For managed service providers (MSPs), the best solution is Atera, a system monitoring platform that delivers services from the cloud; it eliminates all hardware standards from the MSP’s site. You can access the system from any web browser, both for MSP managers and their technicians, and they also have free apps to allow their customers to reach the system from any mobile device. The service provided by this tool checks on the statuses of network devices, physical or virtual servers, and endpoints.
Key Features:
- Device inventory
- Monitoring for network devices and endpoints
- Web-based console can be accessed through a browser
- Can monitor multiple sites within one account
Why do we recommend it?
Atera is a cloud-based remote monitoring and management system that tracks the activities of networks, servers, and software. The package automatically registers the live statuses of hardware and software simultaneously. The system can monitor servers running Windows Server and Linux and workstations running Windows and macOS.
Outside of hardware monitoring, it can track and also improve applications performance. A help desk portal is attached to this tool, which helps technicians with remote access to endpoints during an investigation and problem solutions. In addition to this, a remote desktop service allows the endpoint used to look out for the technician’s activities.
Who is it recommended for?
Atera is packaged in two versions: one for IT departments and one for managed service providers. Each version has four editions and the services in each edition are slightly different according to the needs of the target market. Each plan is charged per technician. Which makes the system accessible for all sizes of businesses.
Pros:
- Lightweight cloud-based tool
- Built with MSPs in mind, and includes RMM and PSA tools built-in
- The framework is highly customizable, making Atera extremely flexible
- Can scale and support multiple databases in a multi-tenant environment
- Packaged pricing makes Atera accessible to any size business
Cons:
- Atera is MSP focused, smaller organizations may not use all multi-tenant features
Atera is a very cost-effective monitoring tool. Managed service providers only need to pay a subscription fee per technician. Annual packages start at $129 per month for Atera Pro. The subscription also comprises processing power and storage on cloud servers’ fees. You can give a try to the 30-day free trial.
5. ManageEngine OpManager Nexus – FREE TRIAL
ManageEngine OpManager Nexus excels in hardware monitoring by providing comprehensive insights into the health and performance of various hardware components. It offers real-time monitoring capabilities, enabling IT administrators to detect and address potential hardware issues promptly. Customizable dashboards allow users to tailor performance views to specific needs, enhancing the overall monitoring experience.
Automated alerts based on predefined thresholds ensure proactive issue resolution, minimizing the risk of hardware failures and maintaining system reliability. This robust set of features makes ManageEngine OpManager Nexus an essential tool for efficient hardware management across diverse business environments.
Pros:
- Robust Hardware Monitoring: Provides detailed insights into the health and performance of hardware components, ensuring timely issue detection.
- Comprehensive Real-Time Data: Offers real-time monitoring of hardware status, helping to prevent potential failures.
- Customizable Dashboards: Allows for extensive customization of dashboards to tailor hardware performance views to specific needs.
- Automated Alerts: Sends notifications based on predefined hardware performance thresholds to address issues proactively.
- Integration Capabilities: Easily integrates with other IT management tools, enhancing overall system efficiency.
- Scalability: Scales to accommodate the needs of both small and large enterprises, making it versatile for various business sizes.
Cons:
- Resource Intensive: Can be demanding on system resources, potentially affecting performance.
Why do we recommend it?
ManageEngine OpManager Nexus is recommended for its robust hardware monitoring capabilities, providing detailed insights and real-time data on hardware performance. Its ability to detect issues early and send automated alerts ensures that potential hardware failures are addressed proactively, enhancing system reliability.
Who is it recommended for?
This tool is ideal for IT administrators and network managers who need comprehensive monitoring of hardware components. Its scalability and integration capabilities make it suitable for businesses of all sizes, ensuring efficient hardware management and maintenance across various environments.
Start by downloading a 30-day free trial.
6. Site24x7 – FREE TRIAL
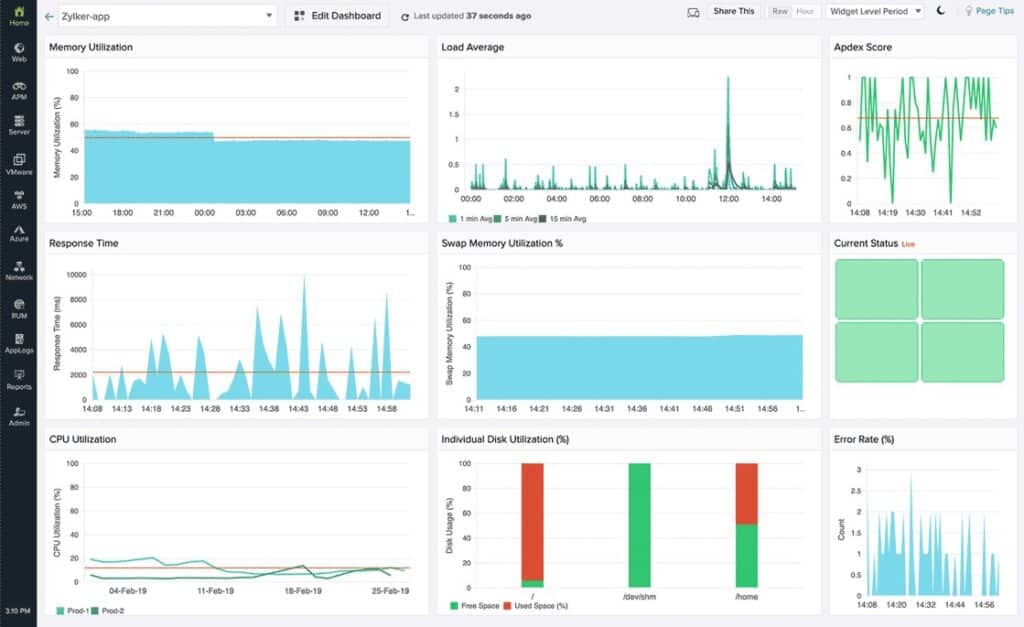
Site24x7 is a cloud platform that offers several packages covering server, application, and network monitoring services. You can choose from the four editions and access the monitoring features as per your choice. When it comes to servers, it makes use of pre-installed SNMP agents to keep track of all the network devices and hardware components. Once you enable these agents, you can track and access all status reports from your endpoints.
Key Features:
- Monitors hardware and endpoints
- Real-time server resources monitoring
- Notifies on detecting performance issues
- Ready-to-install plugin integrations
Why do we recommend it?
The server monitoring tool helps watch over all the hardware components on a network and endpoints. It has an alert option that triggers detecting faults in the system and sends notifications via email or Slack message. You can even customize your dashboard and display both SNMP hardware status and server resource graph in the same window.
This tool plays a crucial role in maintaining the reliability and efficiency of hardware devices, preventing potential issues, and ensuring optimal system performance.
It even sends notifications to administrators if discover that the hardware components on a network are failing or have stopped due to some fault. Using this robust tool, system administrators can even keep an eye on all the applications that run on the endpoints. Overall, it is a great solution for monitoring that helps detect performance issues and removes outages.
Who is it recommended for?
Businesses can choose the subscription plan for different monitoring services as per their need. However, businesses that demand more can expand supplements by paying a higher fee.
Pros:
- Monitors all hardware components and different network device types
- Monitors 80+ performance metrics and detects performance issues in real-time
- Alerts technical teams using Slack messages, email or SMS
- A customizable dashboard that displays both status reports as well as graphs
Cons:
- Server Monitoring solution lacks server room sensors
Access the 30-day free trial.
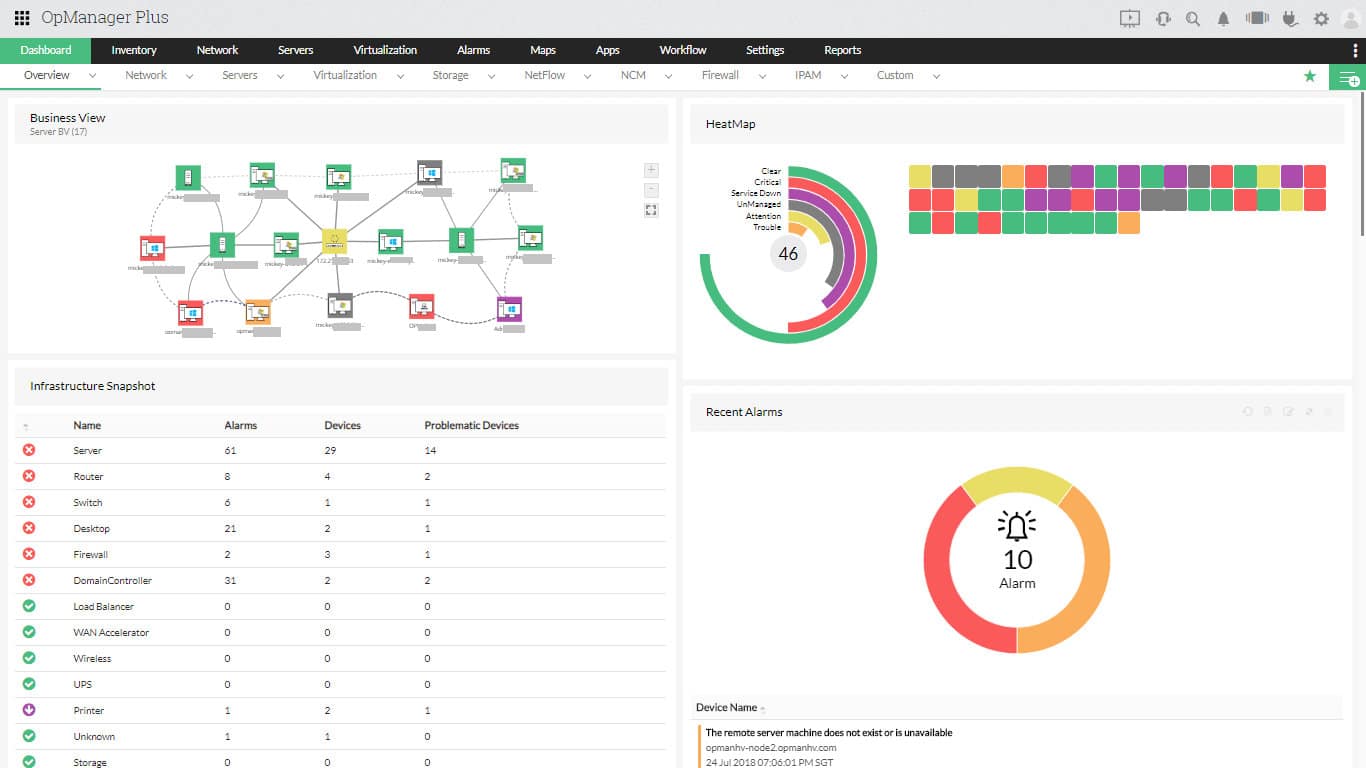
7. ManageEngine OpManager – FREE TRIAL
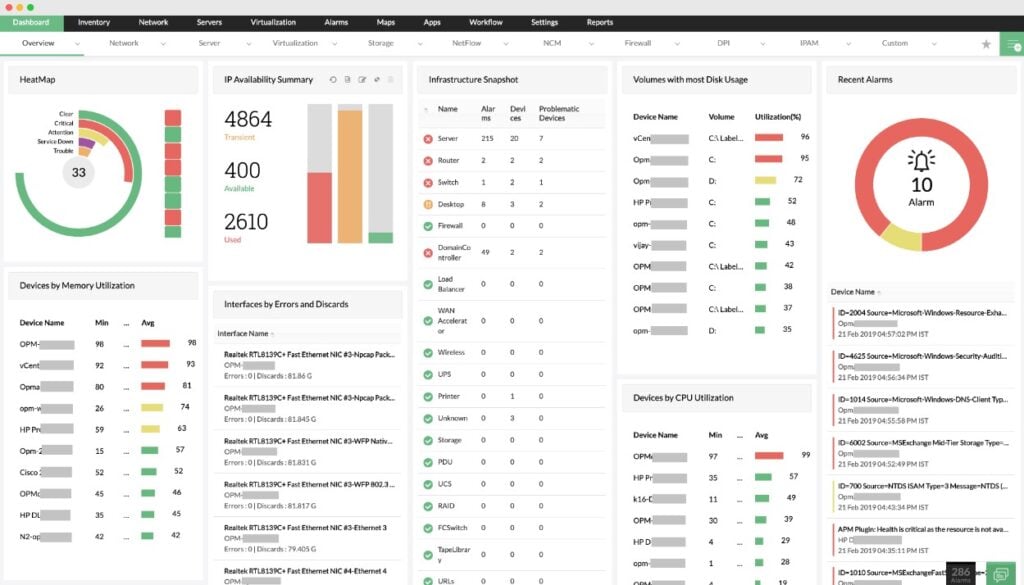
ManageEngine OpManager is a real-time network monitor can track important hardware metrics related to your servers, routers, switches, firewalls, storage devices, and more. All the real-time data pertaining to these devices is displayed on intuitive dashboards to support easy understanding and troubleshooting.
Key Features:
- Uses tables and graphs to display all relevant metrics.
- Supports devices from multiple vendors.
- Employs a reliable and secure probe-central architecture.
- Tracks more than 25 metrics related to performance.
- Sends instant alerts on hardware issues.
Why do we recommend it?
We recommend OpManager for its troubleshooting capabilities. It correlates multiple metrics and provides real-time insights to reduce your MTTR. It even sends instant alerts through email, SMS, and sound notifications to ensure you are always on top of issues.
Another key feature of this tool is its hardware reports that provide information about the various aspects of your hardware components, like temperature, fan speed, power supply, clock speed, and more. With such detailed information, you can quickly isolate the root cause and fix it.
It can handle hardware components from a wide range of vendors. It comes with out-of-the-box monitoring templates for all popular manufacturers. You can even create custom device templates.
Who is it recommended for?
OpManager works well for system administrators, SREs, and IT managers of organizations with extensive hardware components across multiple vendors.
Pros:
- Monitors important metrics in real-time.
- Displays the correlated data on graphs and charts to support troubleshooting.
- Supports devices from multiple vendors.
- Makes it easy to monitor across different locations.
Cons:
- The features can be too much for small organizations.
There are three pricing editions to choose from. The Standard edition starts at $245 for 25 devices, the Professional edition at $345 for 25 devices, and the Enterprise edition at $4,595 for 250 devices. Start a 30-day free trial.
8. Datadog Infrastructure Monitoring
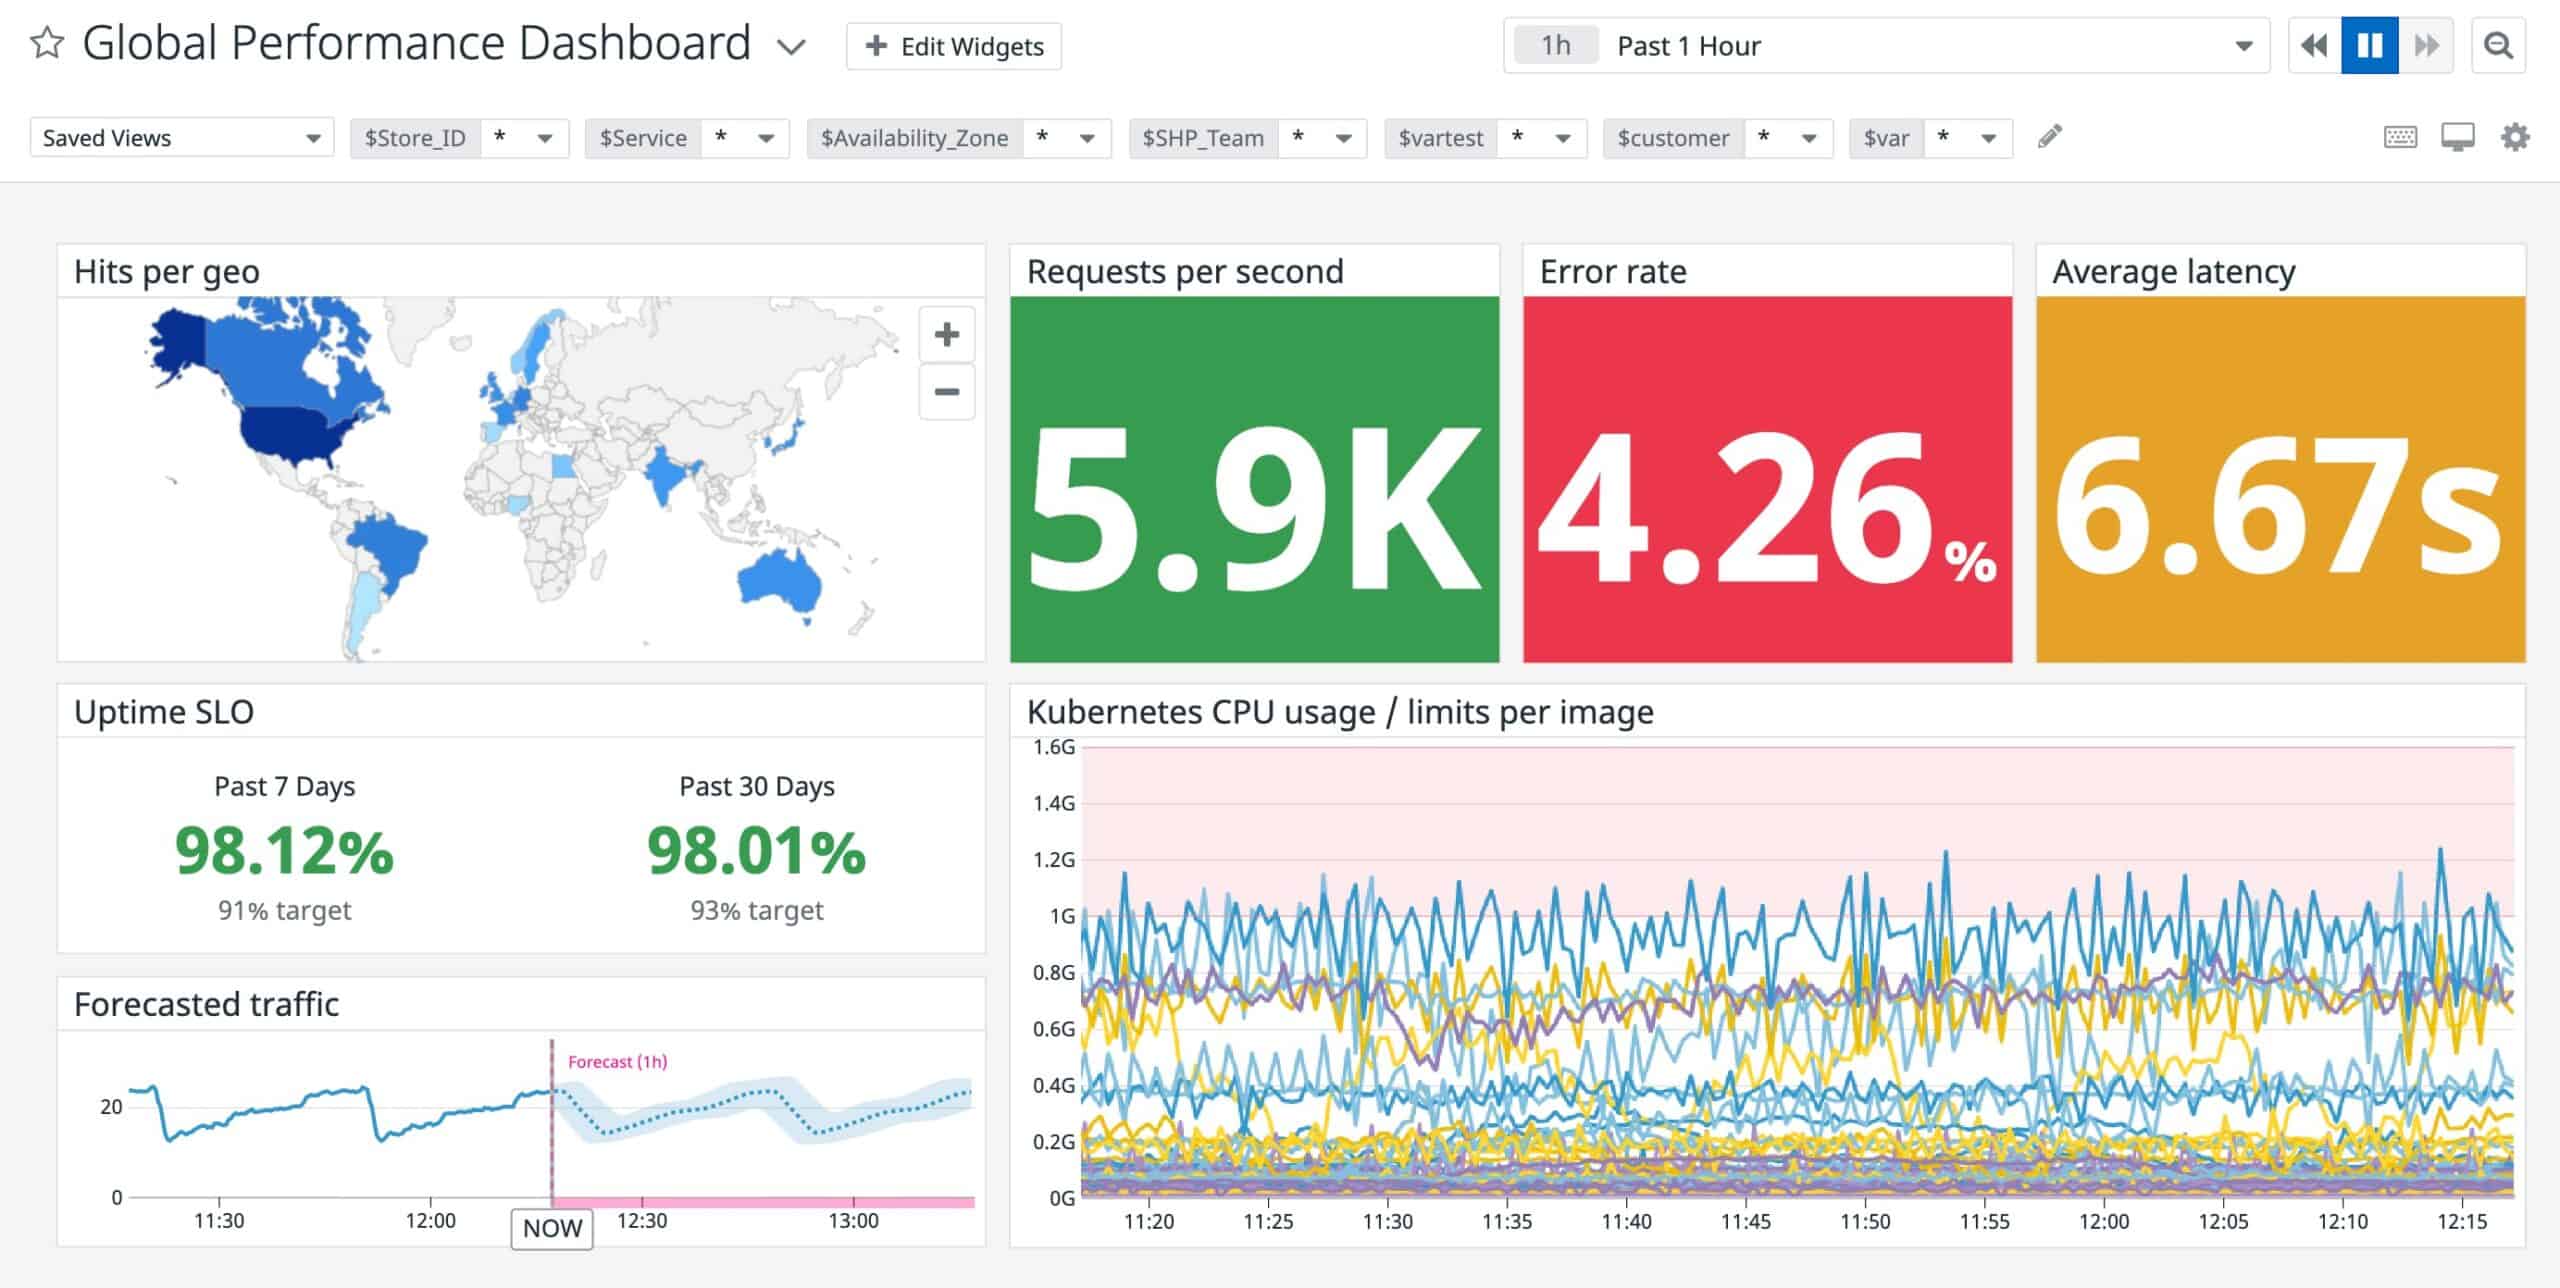
Datadog is used both to monitor hardware and also service performance. It is put together into modules that achieve better visibility with your IT resources when jointly put together. One of the significant added logging ability characteristics of the Datadog Infrastructural module is the autodiscovery which gives you the chance to quickly set up the monitor with a list of your hardware.
Key Features:
- Modular cloud-based platform
- Network device and infrastructure monitoring
- Security monitoring as well as performance tracking
This tool will also assist you in monitoring the performance of your system, giving you the chance to make better use of your available hardware by reorienting your resources.
Why do we recommend it?
Datadog Infrastructure Monitoring is the core module on the Datadog cloud platform of monitoring tools. The system includes hardware statuses for servers and also operating metrics such as CPU usage and disk space. The package can be expanded by integrations that add on probes and screens for specific technologies.
Who is it recommended for?
This module is run from the cloud and reaches out to your on-premises systems by installing an agent. It can also monitor cloud platforms and SaaS systems. Datadog provides a Free edition of Infrastructure Monitoring that will monitor up to five hosts, which is a good choice for small businesses. The paid plans are charged per host.
Pros:
- Offers numerous real user monitors via templates and widgets
- Can monitor both internally and externally giving network admins a holistic view of network performance and accessibility
- Changes made to the network are reflected in near real-time
- Allows businesses to scale their monitoring efforts reliably through flexible pricing options
Cons:
- Would like to see a longer trial period for testing
There is an infrastructure module in Datadog. It includes features like auto-discovery. The auto-discovery feature sets up the monitor with a required list of monitors, so you don’t have to. The Datadog tool monitors the ability characteristics overall performance of the system. It enables remapping the complete resource to use the existing hardware much more efficiently. Talking about the pricing, The Datadog Infrastructure module has a free plan, a Pro plan, and an Enterprise plan, of which the free plan is the least of them. A15-days free trial is available for the free plan and the pro plan. The Enterprise plan is more advanced with more features.
9. FirstWave Open-AudIT
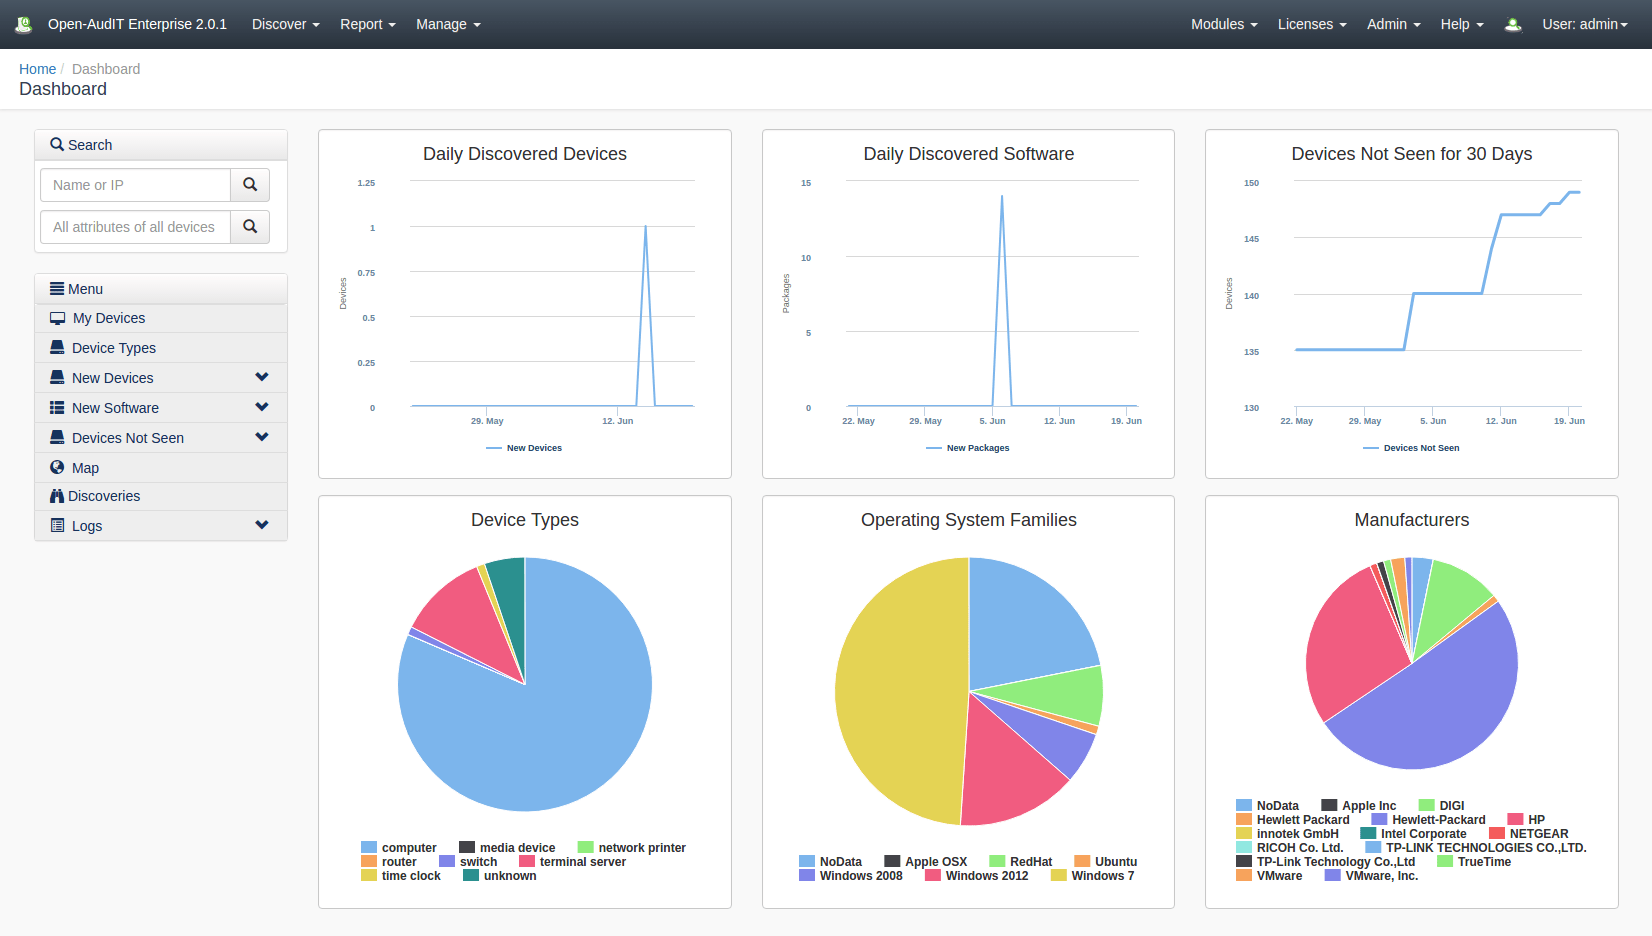
FirstWave is well known for the production of monitoring tools and management tools, of which the FirstWave Open-AudIT is one of them. This inventory management and auditing tool will carry out a general sweep of your entire system and do discovering auditing for your hardware, software, and operating system.
Key Features:
- Runs on Windows Server or Linux
- System discovery and documentation
- Constant hardware status monitoring
One essential key feature of this Open-AudIT service is the fact that it functions as a configuration manager. It will assume the image of the settings of your device and then go ahead to store it. Another feature of Open-AudIT is that it can discover unauthorized devices that may be connected to your network.
Why do we recommend it?
FirstWave Open-AudIT discovers all devices on a network, creates an inventory detailing capacity and warranty conditions then implements live activity monitoring. The discovery cycle repeats continuously, providing regular updates for the device inventory. The monitor records resource utilization and system statuses. The package also includes software monitoring and management services.
Who is it recommended for?
Small businesses would be interested in the Community edition, which includes device discovery and inventory creation. This system’s top edition can also scan cloud platforms and document their services and software. Managed service providers can get a multi-site license for either of the two paid editions.
Pros:
- Completely open source and transparent project
- A simple interface is easy to use and filter through
- Supports a variety of export options (PDF, CSV, HTML)
- Better suited for smaller environments
Cons:
- Free version only includes 20 nodes
A database saves the scans of all the system results, which can be referred to at any point in time. On the dashboard is displayed scan results and also a display of historical data analysis tools. In addition to all of the features mentioned above, the Open-AudIT system regularly brings up scheduled audit reports. Annually, FirstWave Runs the sales for Open-AudIT software. Open- AudIT has the free package, the professional package, and the Enterprise package. The node numbers that are to be scanned determines the package you choose. The free package manages 20 nodes, and this is appropriate for any product evaluation.
10. Checkmk
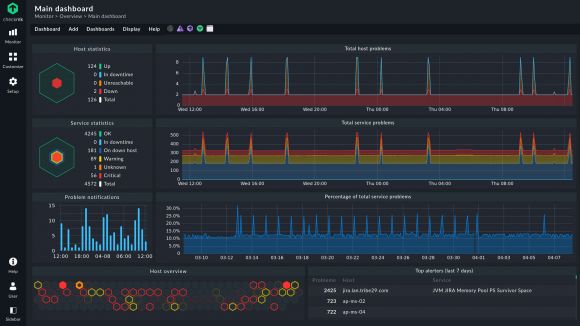
Checkmk is an IT monitoring system that is comprehensive and gives IT managers, DevOps team, and system administrators to recognize problems across their IT infrastructure and resolve them as fast as possible. Checkmk has millions of services in one monitoring.
Key Features:
- System discovery and inventory creation
- Asset status tracking
- Performance graphs
Why do we recommend it?
Checkmk implements a discovery routine to scan a network and create an inventory. This includes details of the capacities of the components of each device. Each device is scanned for details, including its software inventory. The system keeps the inventory up to date with repeated scans. The package also provides live activity reporting.
Due to its high availability and performance, well over 2,000 users worldwide make use of Checkmk daily. Some of the critical features of this product include having very flexible notifications and automated alert handling.
Who is it recommended for?
Checkmk is available in three editions, which gives it a wide audience. The system was created from a fork of Nagios, which is a free open source monitoring package and there is a free Community edition of Checkmk as well, which will appeal to small businesses. Larger businesses can choose between paid plans for installation on Linux or a SaaS option.
Pros:
- Operates as a full-fledged infrastructure monitoring system, good for companies looking for more diversity in their SQL monitoring tool
- Dark mode is easy on the eyes, great for long-term monitoring and NOC teams
- Sleek and simple interface that is easy to learn
- Installs in on Linux or managed in the cloud
Cons:
- Like most infrastructure monitoring tools, Checkmk is designed for system administrators and not home users
Also, it has a great Log and event-based monitoring with Hardware and software inventory. In addition to this, it has a high degree of automation that gives a broad monitoring scope and a high degree of automation of agent threshold installation, including settings for configuration and updating. Checkmk also automatically creates configuration files and supports more than five server operating systems. It has as part of its characteristics a shallow usage of resources by the CPU. Due to the RAM storage, the memory performance for live data is superb and superior. It also has a highly optimized I/O performance.
11. Zabbix
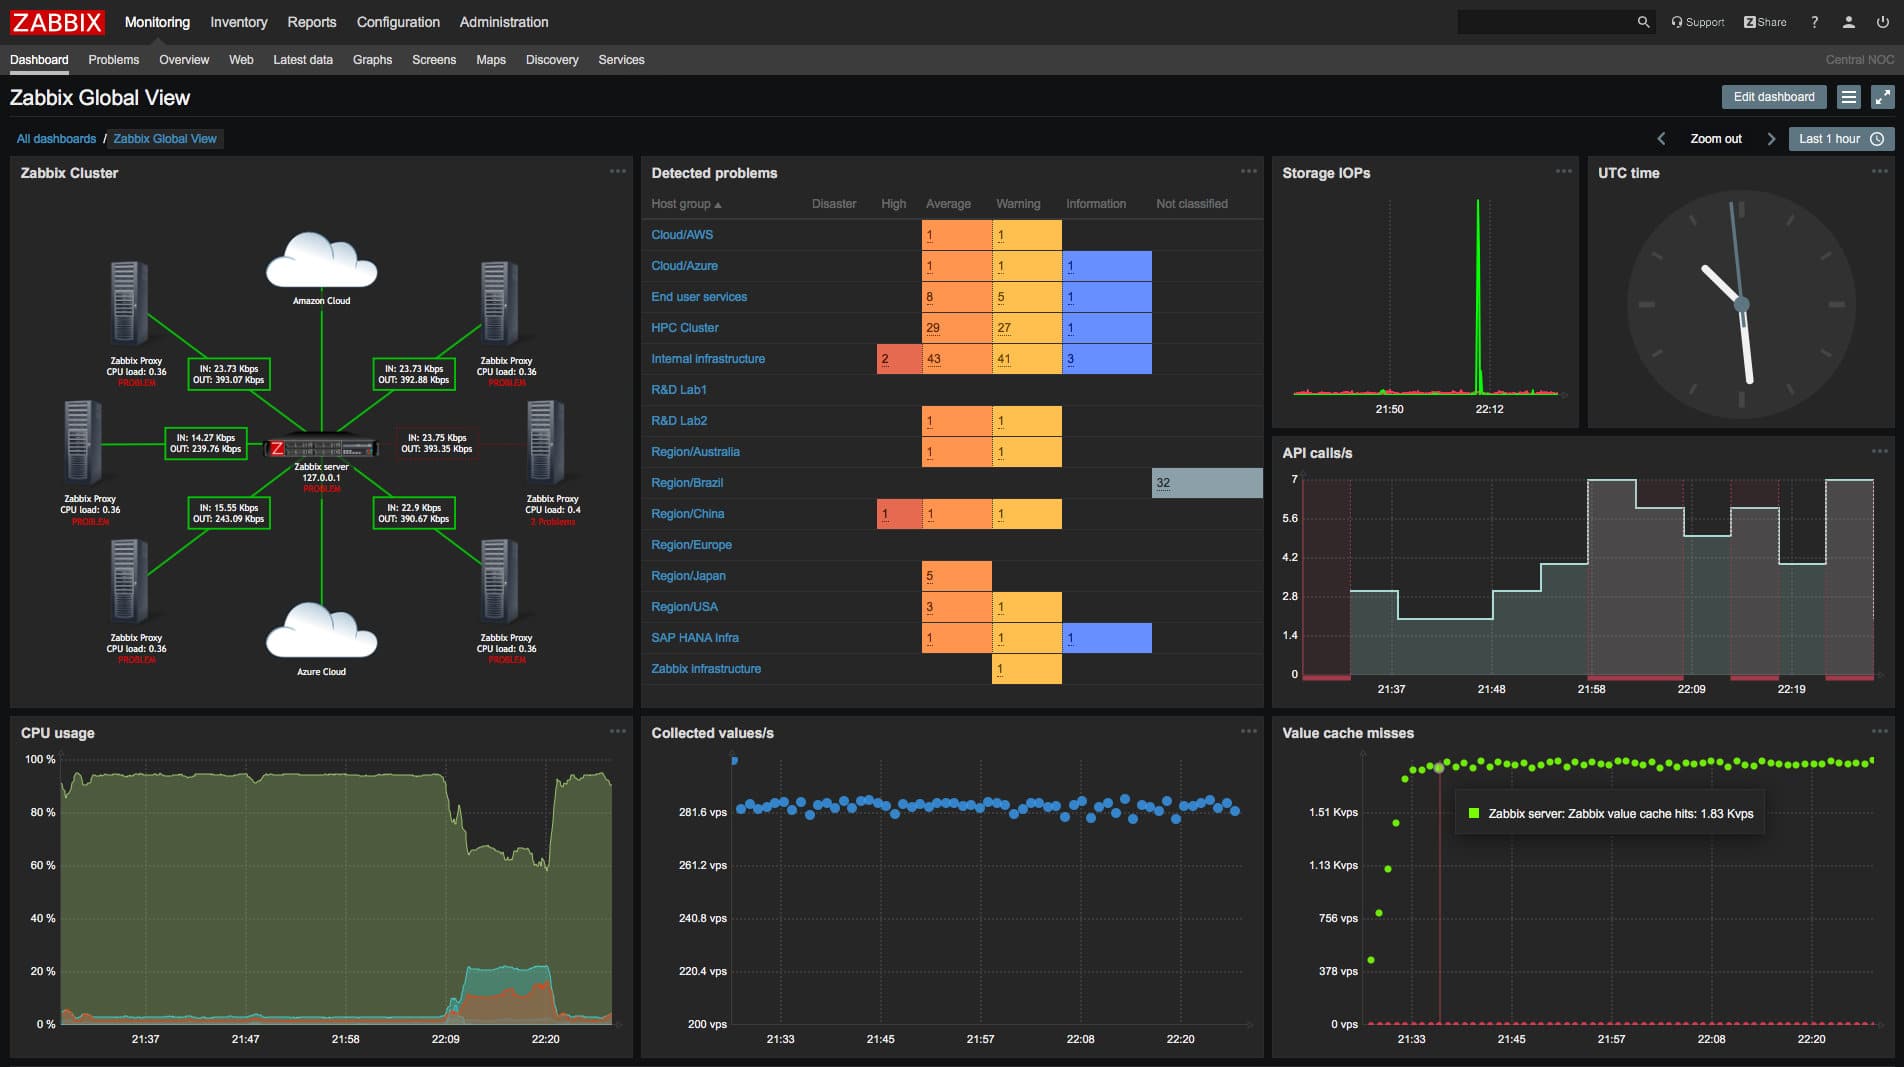
Tracking hardware availability Zabbix is your best deal. Zabbix is a network monitoring tool that automatically discovers devices and identifies when any devices have been connected to or disconnected during setup. After getting associated with the tool, it will start monitoring different components of the hardware. It can monitor power supply, device temperature, disk space, fan speed, system status, etc.
Key Features:
- Automatically creates an asset inventory and network map
- Completely free to use
- Support contracts available for a fee
Why do we recommend it?
Zabbix is a full stack monitoring package and it is free to use. This system includes a discovery service and inventory creation routine that repeats continuously. The service also implements live monitoring, which includes hardware monitoring for endpoints and network devices. This is a software package that runs on Linux or Docker.
Who is it recommended for?
Despite being free, Zabbix is a very sophisticated tool. Its interface is very high quality and doesn’t need any technical skills to set up. This tool is ideal for small businesses. Larger companies that require professional support can subscribe to a support package from the Zabbix team.
Pros:
- Open-source transparent tool
- Uses both SNMP and ICMP for a broader monitoring range
- Can detect new devices and configuration changes immediately
- Offers useful templates for quick insights
- Robust notification system supports SMS, email, custom script, and webhook
Cons:
- The interface isn’t as intuitive as similar solutions
You can check alerts through SMS, email, custom scripts, or messenger to be well updated. Based on the recipient, alert messages can be personalized. The imagery offered in Zabbix is also fantastic. You can check out graphs of hardware that do refresh automatically. For instance, you can check out the charts of the alert system of CPU load to discover how your devices are performing. You can also cause availability reports to display other associates of your team.
12. SolarWinds Server & Application Monitor
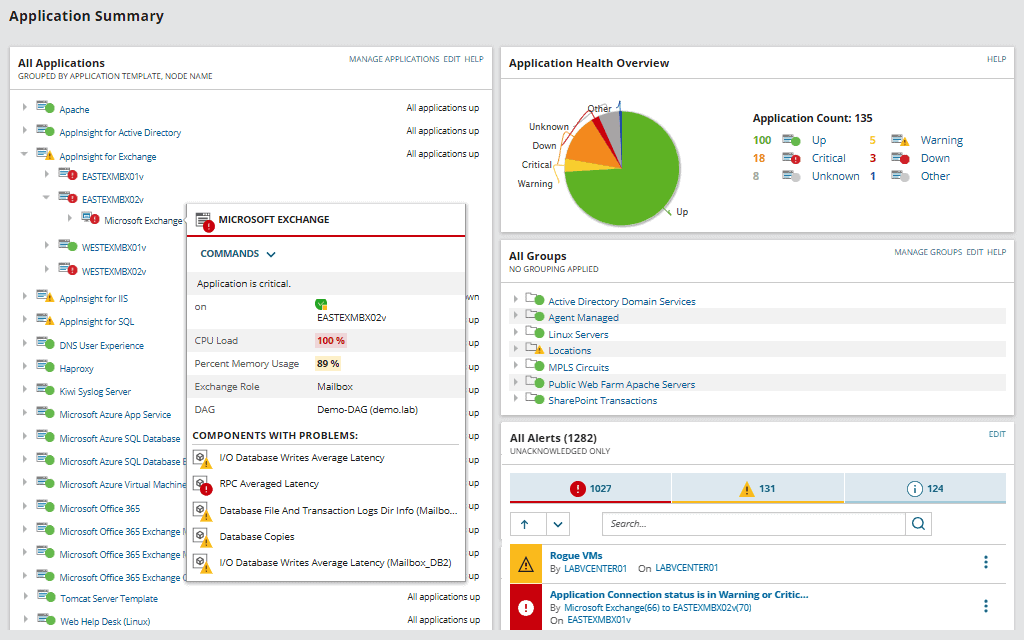
SolarWinds Server & Application Monitor is one of the most dominant tools for monitoring and averting performance problems that arise from hardware malfunctions and failures. This tool is known to discover problems with your network performance. It monitors your power supply, CPU, fan speed, physical disk space, and memory.
Key Features:
- Server resource monitoring
- Application dependency mapping
- Predictive alerts
Why do we recommend it?
SolarWinds Server & Application Monitor records all levels of server activity from the demand placed on resources by software down to hardware statuses, such as temperature, fan speed, and power supply. The tool simultaneously examines CPU and disk activity along with software performance. This provides root cause analysis in the case of performance issues arising.
On a dashboard, you can see all of this information with your network status visibility. Some of the key features are the alert system being enjoyed, the beautiful data graphs, and integration with network management modules. The lightweight installation process being enjoyed is another excellent feature of this tool. You can commence the installation and, after that, discover devices that are connected to the network automatically. Immediately after the installation has been carried out, you can begin managing your environment by customizing the monitors.
To assist you in selecting the application or service you want to monitor, the Component monitor Wizard can be deployed. With this, you have total visibility throughout your hardware hoard.
Who is it recommended for?
This package runs on Windows Server and it focuses on the performance of on-premises servers. So, the tool is going to be of interest to businesses that rely on their own servers to host software rather than cloud services. The service has a great deal of capacity, which makes it suitable for use by large organizations.
Pros:
- Takes a holistic approach to server performance and health monitoring
- Supports auto-discovery that builds network topology maps and inventory lists in real-time based on devices that enter the network
- Supports both SNMP monitoring as well as packet analysis, giving you more control over monitoring than similar tools
- Uses drag and drop widgets to customize the look and feel of the dashboard
- Robust reporting system with pre-configured compliance templates
Cons:
- Designed for IT professionals, not the best option for non-technical users
SolarWinds Server & Application Monitor is an excellent option for those looking out for very highly effective hardware-monitoring software with low maintenance. The price tag begins from $2,995 (£2,368). Download a fully functional 30-day free trial.
13. Splunk Infrastructure Monitoring
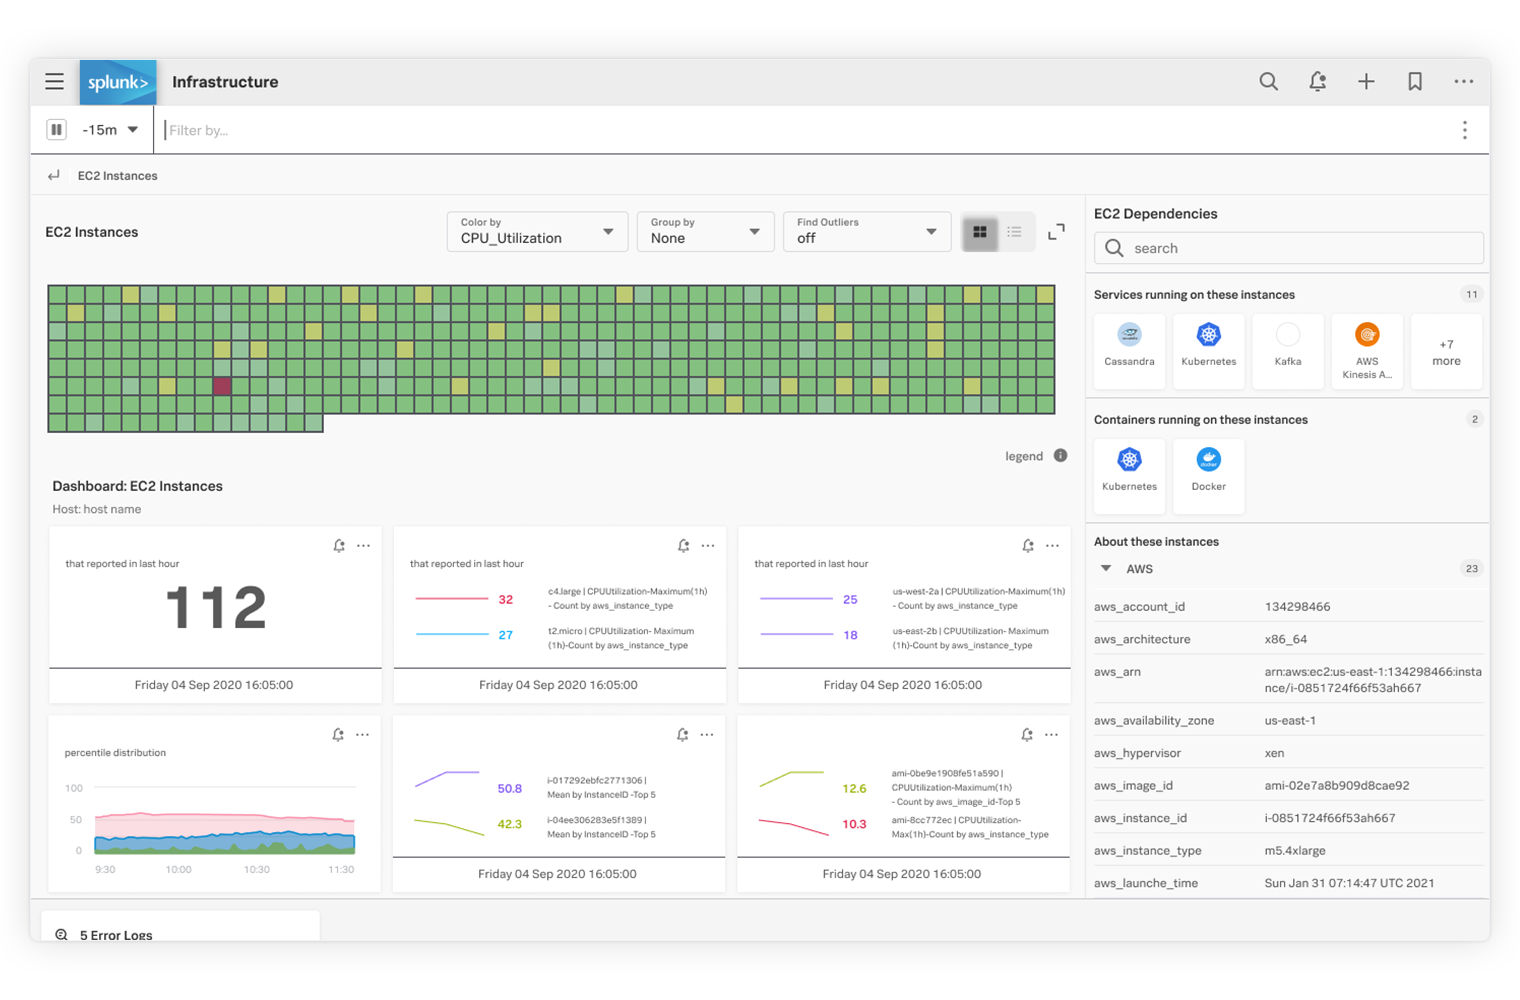
Splunk Infrastructure Monitoring is a service on the Splunk cloud platform. Splunk is well known as a data analysis platform and it also offers a security monitoring package. The Infrastructure Monitoring service collects data from networks and servers on sites and also from cloud platforms, which makes it ideal for monitoring hybrid systems.
Key Features:
- Part of Splunk Observability
- Autodiscovery
- Performance graphs
Why do we recommend it?
Splunk Infrastructure Monitoring discovers and documents a site and also any registered cloud accounts. The tool is able to track the activities of software and microservices as well as hardware. This package will log the total capacity of each piece of hardware and then record utilization levels with each data scan.
Splunk looks at how much of each available resource on a server is being used. If utilization goes above a safety margin, the tool will raise an alert. This warns technicians that resources might soon run out, resulting in performance failure.
Who is it recommended for?
Splunk is a highly respected monitoring system. It used to have a free version, but that has gone, so it probably won’t appeal to small businesses. The platform is a good choice for mid-sized and large organizations. This is a cloud platform, so host operating system isn’t an issue.
Pros:
- Monitors site-hosted hardware and software
- Monitors cloud platforms and the systems that run on them
- Tracks capacity and utilization for system hardware
Cons:
- No free version for small businesses
You can try Splunk Infrastructure Monitoring as part of the Splunk Observability Cloud platform on a 14-day free trial.
14. AIDA64
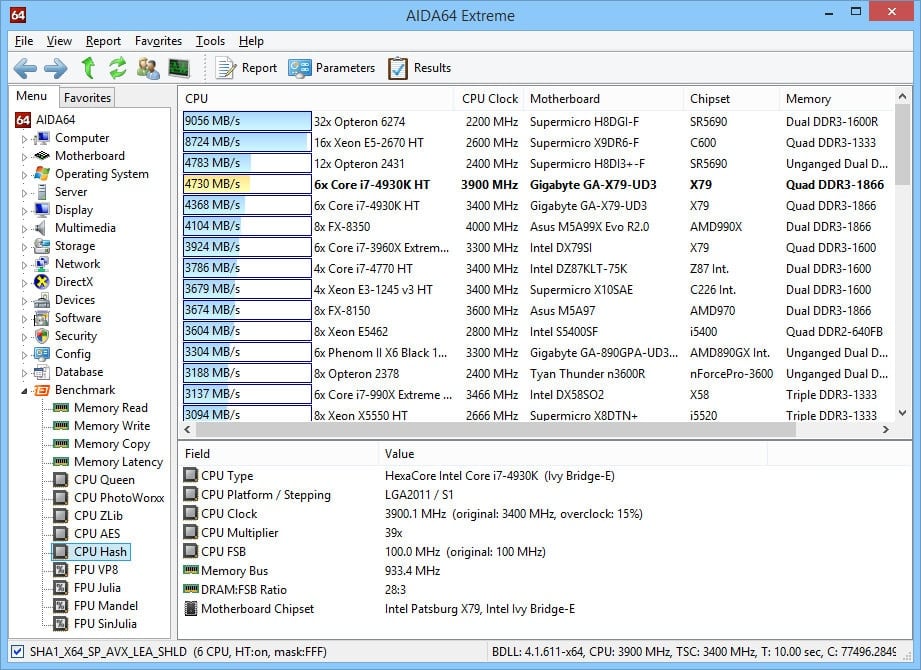
AIDA64 has a lot more diagnostic requirements and hardware-monitoring features than many free monitoring software tools. It can offer all the information free monitoring software tools can provide and do even more like benchmark testing utilities. AIDA64 has a perfect incorporated stress testing utility that helps you ensure that your system is very stable.
Key Features:
- Computer hardware monitoring
- Gets right down to the motherboard
- Includes temperature tracking
Why do we recommend it?
AIDA64 is a chip monitoring tool for AMD and Intel CPUs and Intel, AMD, and Nvidia GPUs. The AIDA64 name is actually a brand with six products within it. The most relevant package for hardware monitoring is the AIDA64 Business system. This scans PCs to create hardware and software inventories. The package also performs ongoing hardware status and performance monitoring.
Who is it recommended for?
AIDA64 runs on Windows and scans other computers running Windows. The tool can monitor multiple endpoints simultaneously across the network. This means that it is suitable for use by all sizes of businesses. The minimum order quantity is a 10 license pack, so very small businesses might not have enough endpoints to justify a purchase.
Pros:
- Designed to detect and monitor devices at scale, good for large companies and enterprises
- Can save collected information in database format
- A simple alert system is easy to use
- Acts as a lightweight RMM with options to restart machines remotely
Cons:
- Less intuitive than leading products
- Interface could use improvements, graphs can be hard to read
AIDA64 is not free, but they offer a 30-day free trial.
15. Intel XTU
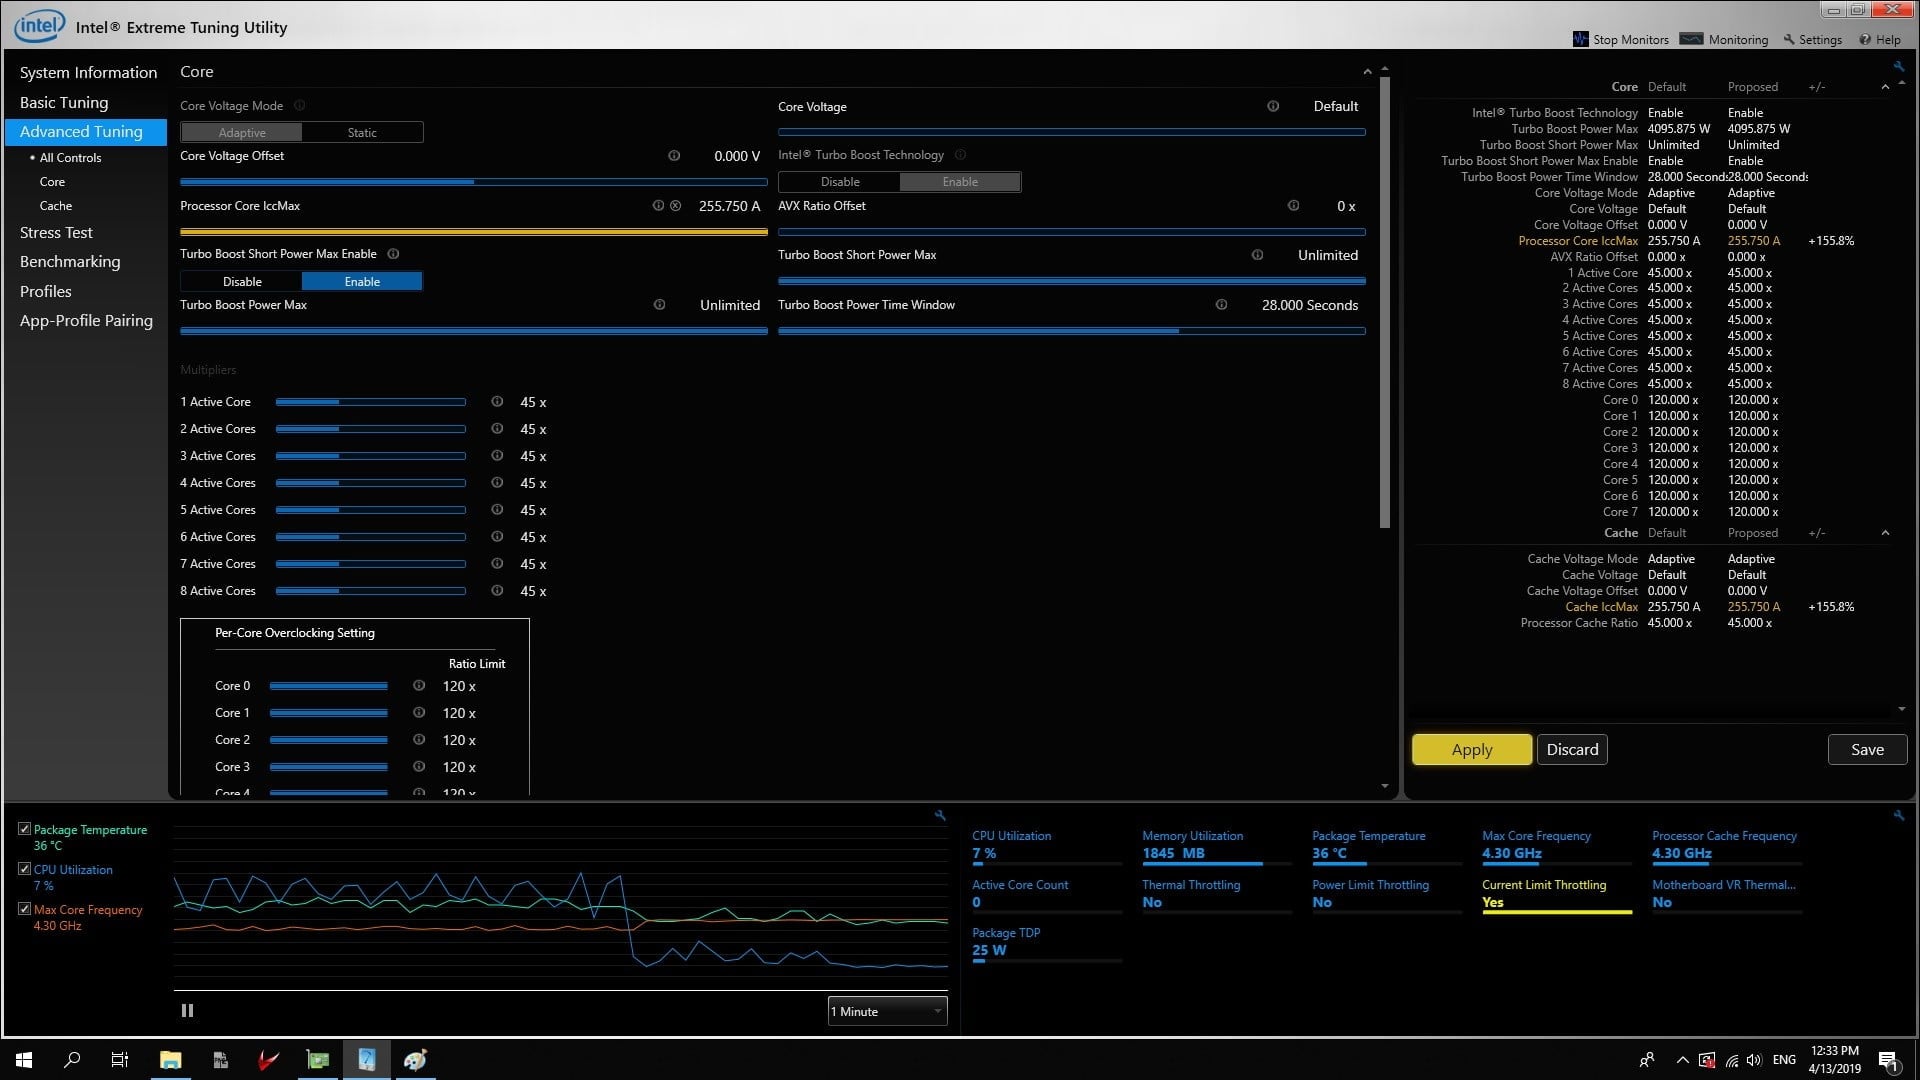
Intel XTU or Extreme Tuning Utility is a tool designed solely for systems that make use of Intel CPUs. This tool integrates all-inclusive CPU monitoring skills such as frequency monitoring, voltage monitoring, and temperature monitoring to adjust and regulate the frequency, voltages, and other aspects of the CPU. In addition to this is a stress testing tool that can stress test the CPU, the GPU, and the memory.
Key Features:
- Runs on Windows
- On-device component monitor
- Supports overclocking
Why do we recommend it?
Intel XTU helps system administrators monitor and manage Intel CPUs. You could use this tool to adjust the clock on a CPU to improve performance with overclocking. The tool also provides feedback for CPU statuses, such as activity per core. The tool also includes benchmarking and stress testing utilities.
Who is it recommended for?
This is a free software package that runs on Windows. The software can’t be networked, so a system administrator using it would have to visit each PC. this wouldn’t be suitable for large businesses or MSPs that need to be able to perform all monitoring and management functions remotely.
Pros:
- Designed specifically for Intel processors, providing highly accurate hardware details
- Features overclocking templates and stress tests
- Great for both novices and enthusiasts
Cons:
- Not the best solution for system administrators looking to manage hardware at scale
16. HWiNFO
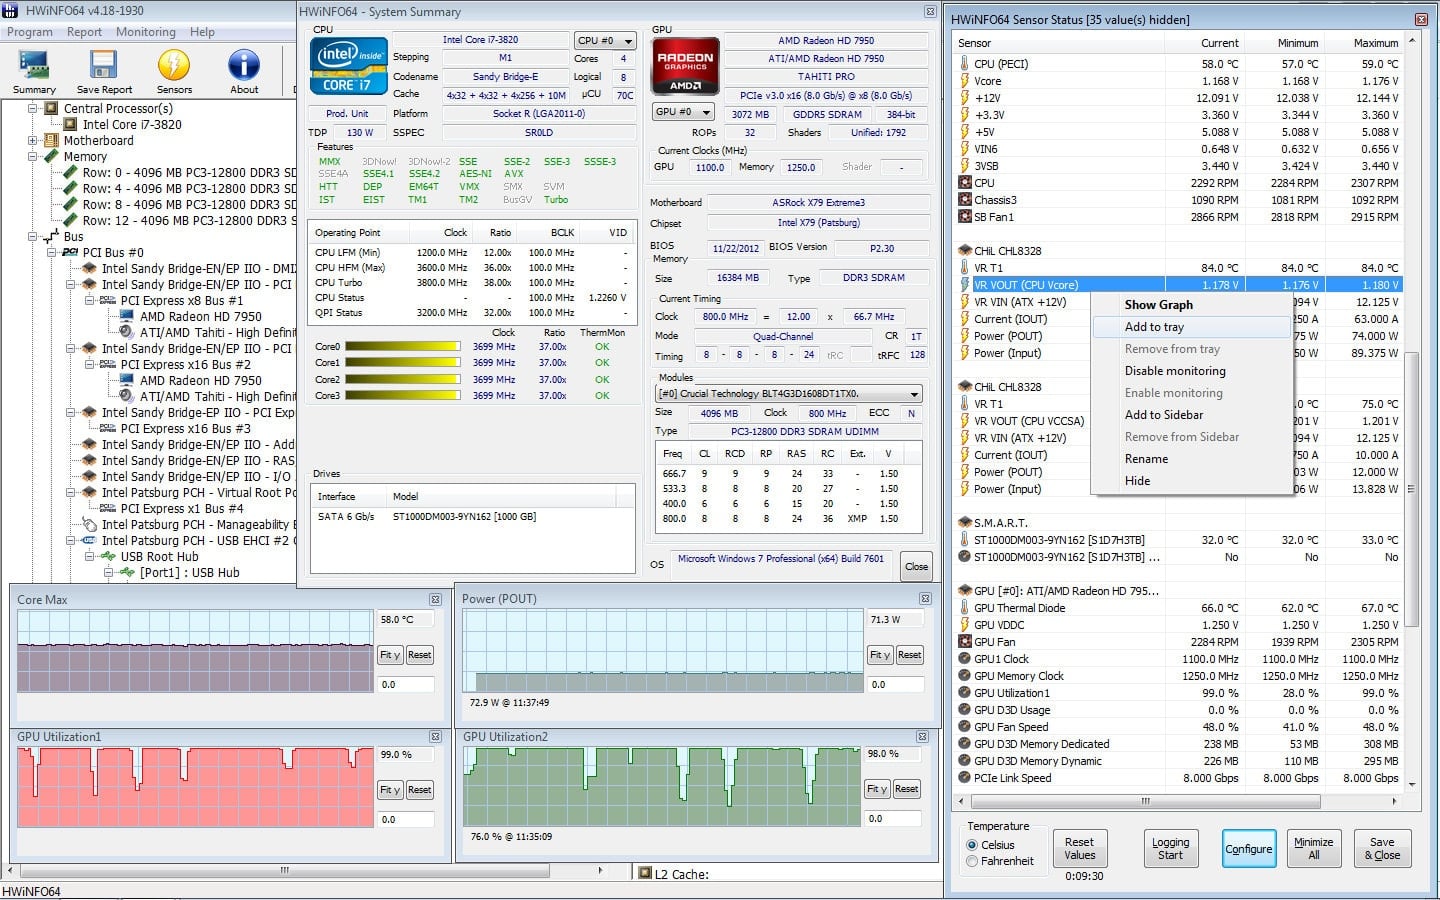
HWiNFO happens to be another good hardware-monitoring utility that is free. It can monitor the voltages, temperatures, and frequencies of each piece of hardware, but most importantly, HWiNFO can go deeper by revealing in detail information about each of these components.
Key Features:
- Measure computer components
- Free to use
- Graphs for system throughput
Why do we recommend it?
HWiNFO provides hardware monitoring for PCs running Windows. The tool watches over CPU, memory, and disk activity, noting total capacity and current utilization. The system shows live readouts in its interface but you can minimize it and leave it running. The tool will raise an alert if resources run short.
Who is it recommended for?
This is an on-device tool and it is free for personal use. Those who work from home could also get away without paying. Businesses have the option to buy a perpetual license or a yearly subscription. The system doesn’t provide centralized reporting for multiple computers, so it would be of interest to mid-sized and large businesses.
Pros:
- Extremely detailed, includes metrics not found in other tools like cache sizes, ratio, clocks speed per core, and timing information
- Can track other metrics such as GPU and disk utilization
- Is fully customizable
- Offers built-in visualizations
Cons:
- Lack of proactive features like robust alerting options and inventory management
It can reveal the memory bus width of your graphics card and the timings your RAM is rated for at 2133MHz. Most importantly, it is available for free, so anyone can download and install it on their PC and start monitoring without paying anything.
Conclusion
We cannot dispute that hardware monitoring is the best way to safeguard your devices against failures. Making use of solutions as mentioned above can become handy. These tools come with their dashboards to view different metrics. Don’t get stuck again. What do you think about our list of best hardware monitoring and your tools?
Hardware Monitoring Tools FAQs
Why is hardware monitoring important?
Hardware monitoring is important because it allows organizations to identify and address potential hardware issues and bottlenecks, optimize system performance, and ensure system availability and uptime.
What types of hardware can be monitored?
A wide range of hardware components can be monitored, including CPUs, memory, hard drives, solid-state drives, power supplies, and cooling systems.
What types of metrics can be monitored with hardware monitoring tools?
Hardware monitoring tools can monitor a wide range of metrics, including CPU temperature, fan speeds, power usage, memory usage, and disk health.
How does hardware monitoring differ from software monitoring?
Hardware monitoring focuses specifically on the performance and health of hardware components, while software monitoring involves monitoring the performance and availability of software applications and services.
Can hardware monitoring tools be used for virtualized environments?
Yes, hardware monitoring tools can be used for virtualized environments, such as those using virtual machines or containers, by tracking hardware performance and health in these environments.
What are some challenges of hardware monitoring?
Some challenges of hardware monitoring can include dealing with large amounts of data, ensuring accurate and consistent monitoring across multiple hardware components.