A monitoring system helps the DevOps team to detect and find the solution to any performance issue conveniently. With Kubernetes and Docker on a steady rise, it’s essential to get log management and container monitoring right from the beginning.
This is no easy work. Monitoring Docker containers is a highly complex task, as you need first to develop a strategy and then build a proper monitoring system. In this post, we will discuss intensely what container monitoring is about and why it is needed. We will also compare the best container monitoring tools of the market.
Here is our list of the ten best Docker Monitoring Tools:
- ManageEngine Applications Manager – FREE TRIAL Αn APM feature with native help for Docker Monitoring. It lets you quickly find and resolve performance issues across your whole application stack, from the link to the code link. Start 30-day free trial.
- Site24x7 Docker Monitoring – FREE TRIAL This package provides Docker container monitoring as part of a full-stack monitoring platform that is delivered from the cloud. Get a 30-day free trial.
- Sematext An excellent solution for Docker Monitoring. Sematext Monitoring is a full-stack detectable solution with the ability of Docker monitoring.
- Datadog Comes with a robust monitoring system for your applications, infrastructure, network, and logs. It also offers support for Docker containers.
- SolarWinds Server & Application Monitor Enables you to monitor Docker containers. Depending on the environment you choose, it gives you a complete understanding of the Docker metrics and the Linux and Windows metrics.
- Sysdig Lets you enhance the performance and availability of your infrastructure, applications, and services.
- Dynatrace Α complete observability solution that gives you a user-friendly approach to Docker monitoring of your container’s metrics and logs.
- cAdvisor Αn open-source metrics collector built by Google to examine and expose usage and performance data of your resources from running containers.
- Sumo Logic Integrates containers that enable you to troubleshoot and do the root cause analysis of problems from distributed container-based apps and the Docker containers.
- Splunk Helps you with Docker Monitoring from host to container to application on just a single dashboard.
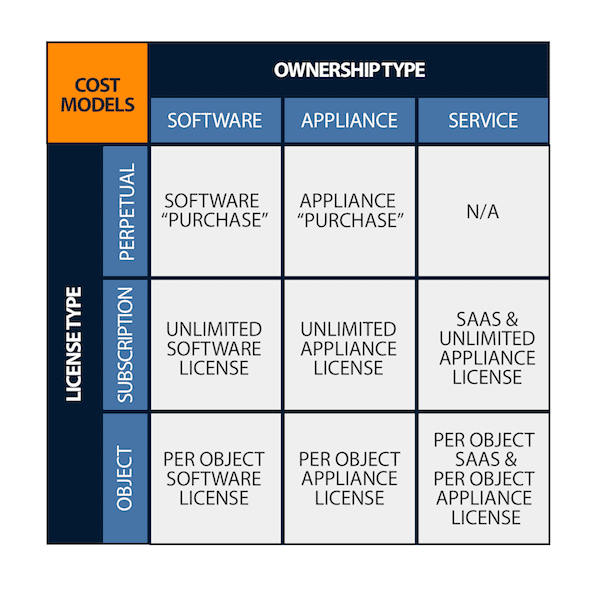
We are here to talk about the tradeoffs between using SaaS tools and CNCF products so you can make a proper estimate of your expenses and needs.
But before that, let us quickly give you an overview of the basics of Docker Monitoring.
What is Container Monitoring?
Container Monitoring is a straightforward process of checking the performance of your apps built on Microservice-architectures by collecting and analyzing the performance metrics of your application. Due to their temporary nature, the containers are tough to monitor as compared to the old apps.
In simple words, containers are temporary, which means stateless. Therefore, you must collect the metrics and logs and then immediately send them to some centralized location to keep them safe. Or else, they’ll be deleted when you delete the container. This is precisely why it’s more complicated and challenging than regular servers.
Why do you need to monitor Docker Containers?
Container Monitoring in the flesh is essential to make sure your app’s performance is at its peak. But when it’s about Docker containers, here is what monitoring helps you with:
- Discover and solve problems proactively, so you don’t face any risks in production.
- Make changes timely and safely while the entire environment gets monitored.
- Optimize resource allotment.
- Acceptable applications to deliver better performance and user experience.
How does Container Monitoring work?
Container Monitoring is not different from monitoring other old deployments as you need metrics, logs, health checks, and service discovery in both of them.
Still, container monitoring is more complicated because of its multi-layered and dynamic nature. But a friendly solution of container monitoring can help you through all its layers quickly. You just have to choose the best tool that fits your case precisely.
Here is the list of the ten best Docker Monitoring tools you should know about.
The Best Docker Container Monitoring Tools
1. ManageEngine Applications Manager – FREE TRIAL
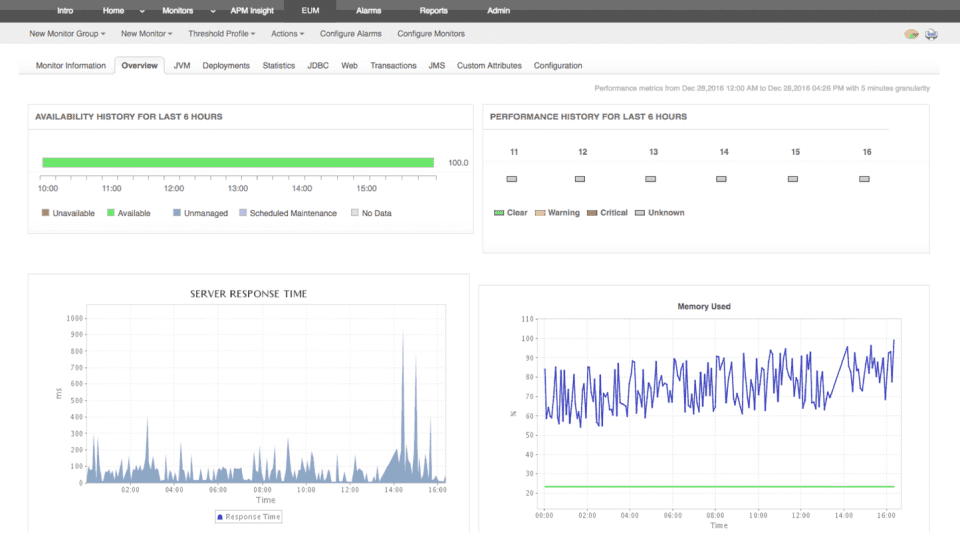
ManageEngine Applications Manager is an APM feature with native help for Docker Monitoring. It lets you quickly find and resolve performance issues across your whole application stack, from the link to the code link. You get access to VMs, servers, and databases, on-premises and in the cloud as well.
This tool is the best one for all your monitoring and server requirements. It offers proactive and quick application docker monitoring services to measure the performance statistics for monitoring your infrastructure in real-time.
Unlike other monitoring tools, ManageEngine Applications Manager supports a wide range of over 100 famous technologies across different VMs, servers, application servers, containers, middleware and messaging components, web servers, and services, databases, etc.
Key Features:
- Application dependency mapping
- Docker and Kubernetes monitoring
- Distributed tracing
Why do we recommend it?
ManageEngine Applications Manager is our top choice as it goes a little further than its competitors by implementing distributed tracing for microservices. The package also provides code profiling for Web applications. This package also monitors services and server resources.
Who is it recommended for?
This bundle is a very large package of monitoring systems that can track just about any application, including those contained by Docker. As it is so comprehensive, it is ideally suited for large organizations with a varied range of applications to monitor. However, ManageEngine offers a Free edition to appeal to small businesses – it is limited to monitoring five assets.
Pros:
- Root cause analysis
- Resource shortage predictions
- Alerts for performance problems
Cons:
- Not a SaaS package, although the software can be run on AWS or Azure
ManageEngine Applications Manager’s monitoring tool can measure up to 10,000 apps with easy setup of the application monitor, without any training or consultation. Get a 30-day free trial.
2. Site24x7 Docker Monitoring – FREE TRIAL
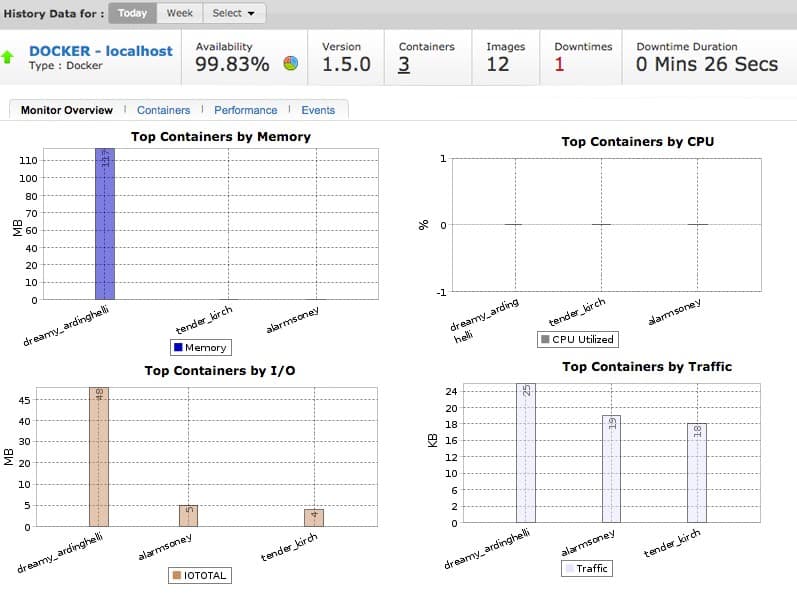
Site24x7 Docker Monitoring is provided from a SaaS platform. The Site24x7 service packages its modules into plans that give you network, server, application, service, and middleware monitoring all tether for one subscription payment.
Docker Monitoring automatically identifies each container as it is created and registers it for performance tracking.
The performance monitoring feature records the resource usage of each container over its lifespan. The service tracks CPU and memory usage and network activity, which includes a byte count for inbound and outbound traffic.
It is possible to issue controls from the Site24x7 console to start and stop each container.
The Site24x7 system is able to track Docker activity on premises and on cloud platforms. While tracking the containers, it also watches the servers and platforms that support them.
Key Features:
- Included in full stack monitoring
- Monitors Kubernetes clusters
- Automatic discovery
Why do we recommend it?
Site24x7 Docker Monitoring will scan your servers and their software to discover your Docker implementations and document them. It then watches each invocation to track its performance, simultaneously monitoring the application within and the server resources beneath. The tool is also able to track Docker implementations on cloud platforms.
Who is it recommended for?
Site24x7 is a cloud-based platform that offers packages of modules rather than standalone units for individual purchase. The plans provide full stack monitoring and include extensions for specific technologies. They are sized and priced for small businesses and capacity expansions are available for larger companies.
Pros:
- Records start/stop actions
- Tracks implementations on premises or on cloud platforms
- Alerts for resource shortages or falling performance
Cons:
- No self-hosting option
The Site24x7 package is available for a 30-day free trial.
3. Sematext
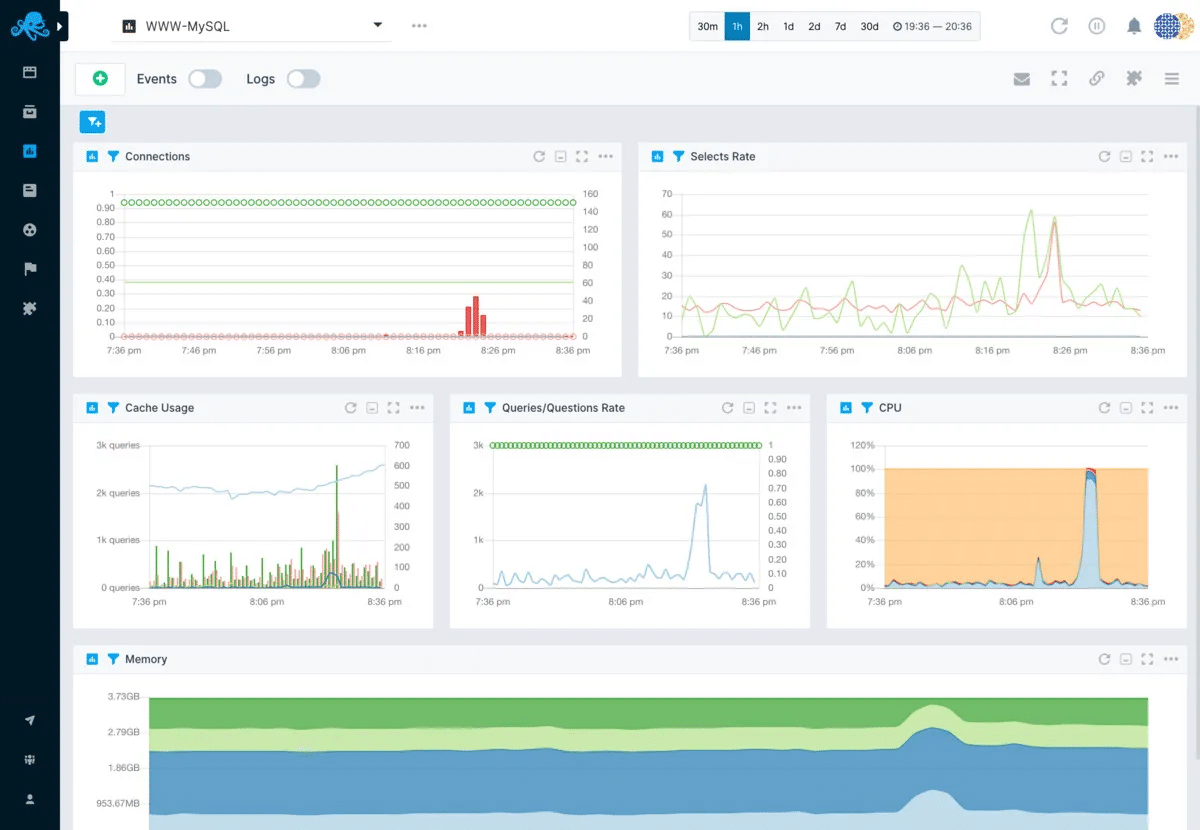
Sematext Monitoring is an excellent solution for Docker Monitoring. Sematext Monitoring is a full-stack detectable solution with the ability of Docker monitoring.
It provides accessible set-up monitoring dashboards for events, logs, and metrics, giving you insights into your containers and the infrastructure.
With anomaly alerting, detecting, and correlations between all the different parts of your infrastructure, containers, and clusters, you have access to everything required in one place for faster and better troubleshooting.
You get full access and insights into your infrastructure. It doesn’t matter what platform you’re using or whether it’s VMs, bare metal, or a container environment like Rancher, Kubernetes, or Docker Swarm.
Mixing these features with alerts and anomaly detection to use different notification destinations provides a complete platform for observability.
Key Features:
- SaaS package
- Hybrid monitoring
- Can run on Docker
Why do we recommend it?
Sematext is a cloud-based SaaS package. However, the company gives you the option to download the software for the monitoring system and run it on Docker. The package will monitor Docker as well and it can track containers whether they are hosted on premises or on the cloud.
Who is it recommended for?
Docker monitoring is part of the Sematext Infrastructure Monitoring package which has three editions. Small businesses will appreciate the Free edition, which is limited to monitoring five hosts and doesn’t have a long data retention period. PAyers get a rate per host and a choice of retention period.
Pros:
- Free edition available
- Pricing per host
- Covers on-premises and cloud-hosted containers
Cons:
- You can’t perform historical analysis with the Free edition
4. Datadog
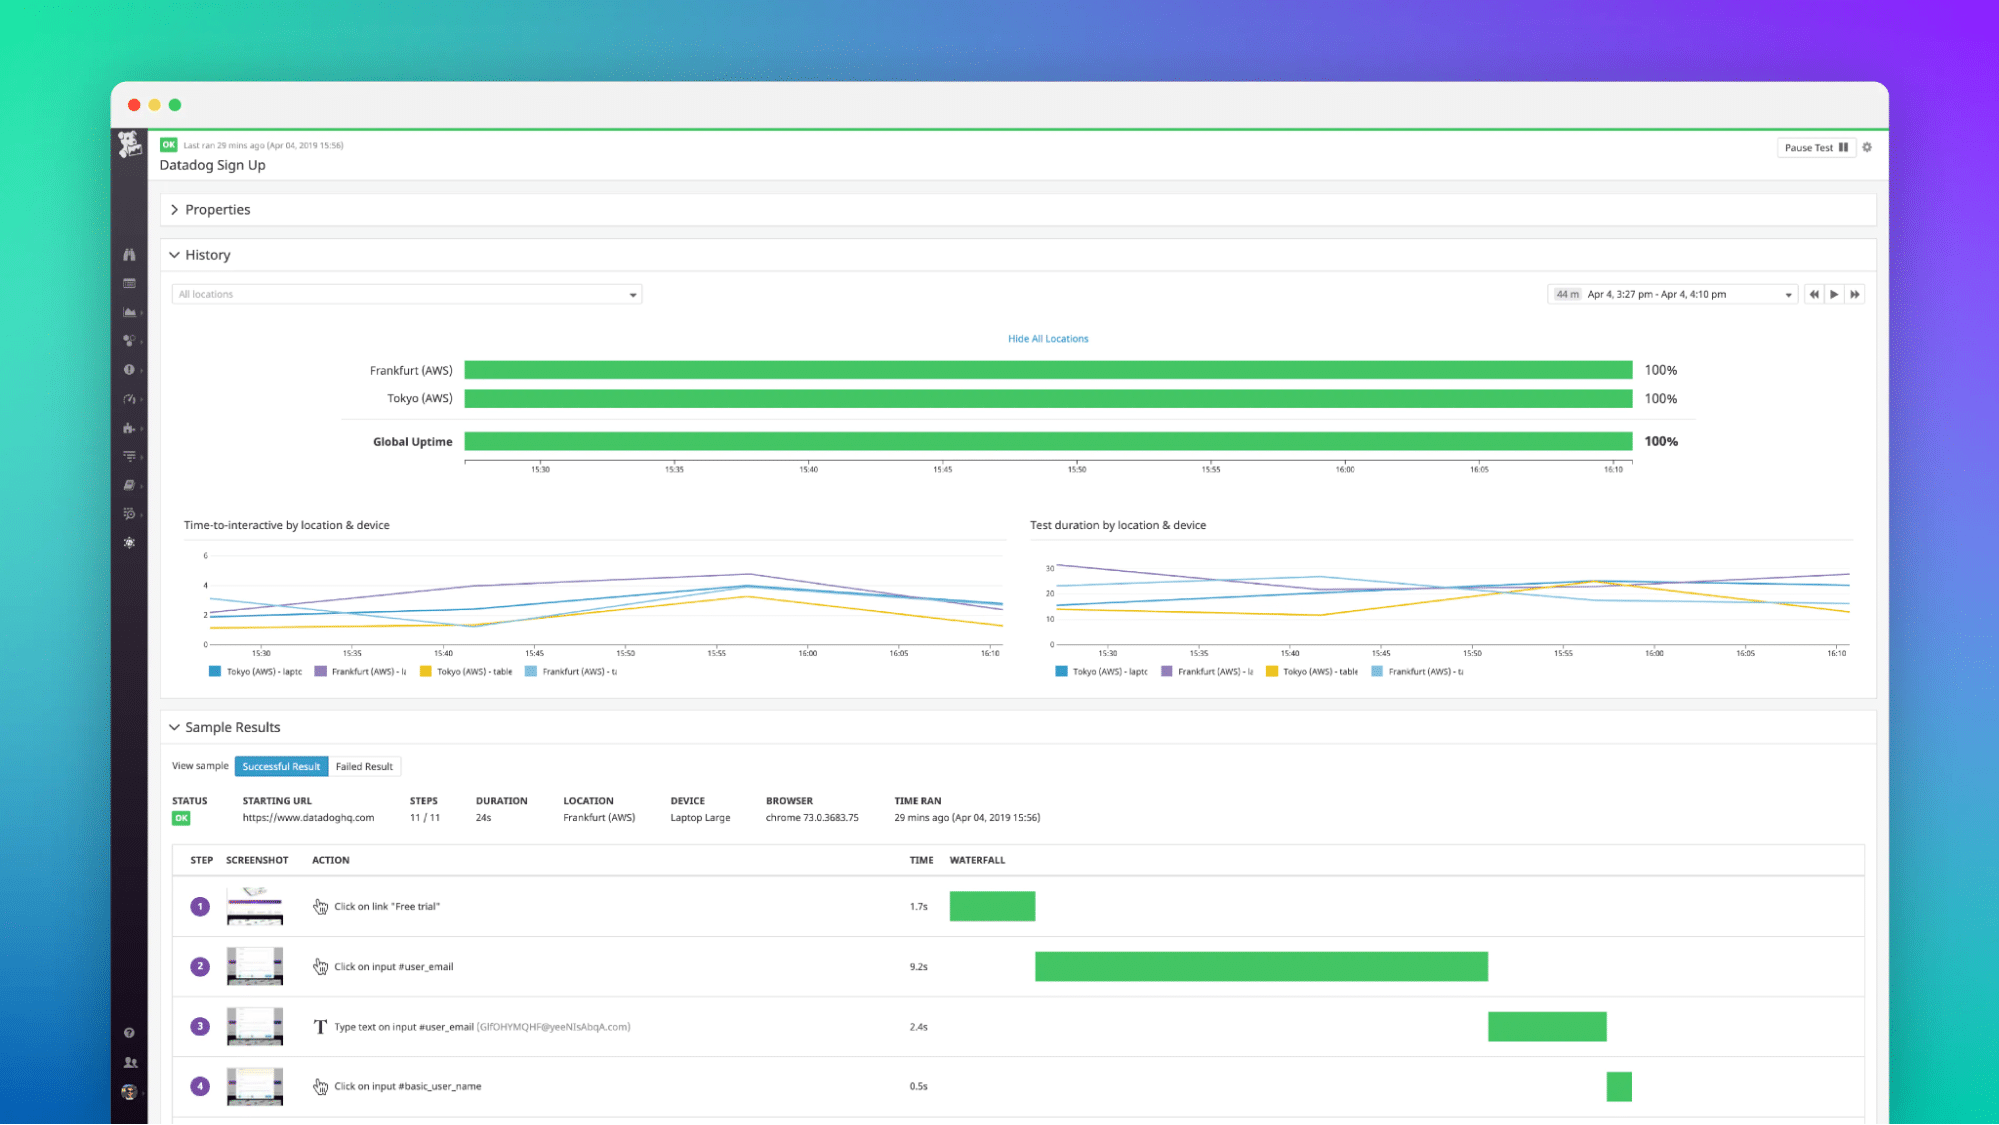
Datadog comes with a robust monitoring system for your applications, infrastructure, network, and logs. It also offers support for Docker containers.
All that you need to do is to install the Datadog agent. If you already have it installed, then you’re good to go. But if you don’t have it, just install the agent package and follow the guidelines. The only thing you need to think about is that the default limit of docker monitoring is 350 metrics per instance. So you can just collect Docker logs automatically if you want complete access to your container’s visibility.
Key Features:
- Container discovery function
- Tracks new invocations
- 15 seconds scan cycle
Why do we recommend it?
Datadog container monitoring is part of the Infrastructure monitoring service on the cloud platform. Datadog is able to track Kubernetes settings along with Docker activity and it watches clusters with each element as it is created and destroyed. The system also works out which software is running inside each container and monitors that as well.
Who is it recommended for?
Any business that runs applications over Docker will benefit from this monitoring package. Docker is used frequently to host systems that are written for Linux so that consumers who only have Windows can use them, so you might be running more Docker containers than you realize.
Pros:
- Docker log management option
- Monitors Kubernetes along with Docker
- The same package also monitors databases, operating systems, and other hosted applications
Cons:
- Log management is a separate module from Infrastructure Monitoring
5. SolarWinds Server and Application Monitor
SolarWinds Server & Application Monitor top spot enables you to monitor Docker containers. Depending on the environment you choose, it gives you a complete understanding of the Docker metrics and the Linux and Windows metrics.
Key Features:
- Monitors Docker on premises and on cloud platforms
- Tracks container resources
- Records host resources
- Correlates host and container activity
- Monitors many other applications
Why do we recommend it?
SolarWinds Server & Application Monitor tracks Docker on servers and also on cloud platforms, such as AWS, Azure, and GCP. The system monitors the application running within a container, the container itself, and the server or platform that hosts it. Correlating between these three levels identifies potential resource shortages.
Who is it recommended for?
This is a high capacity package that can manage multiple containers simultaneously while also tracking all of the other applications that are running for your business. Therefore, large companies with a lot of applications to monitor will benefit the most from this package. Small businesses would probably find a more affordable option with a smaller package.
Pros:
- Discovers all applications
- Relates applications to services and hosts
- Creates an application dependency map
- Identifies slowing performance with containers or the applications that they carry
- Predicts resource bottlenecks
Cons:
- Runs on Windows Server and has no SaaS equivalent
With supported out-of-the-box alerting and dashboarding ability, this is the best choice for docker monitoring and monitoring your complete infrastructure.
6. Sysdig
Sysdig lets you enhance the performance and availability of your infrastructure, applications, and services. In addition, it gives you clear access to quickly changing your container’s environment.
You can solve the issues quicker by using container data from system calls that are enhanced with the Kubernetes context. In addition, Sysdig makes it easier for you to unify data across different teams for docker monitoring.
Sysdig is the first available monitoring platform that is compatible with Prometheus entirely. It gives the developer a familiar tool without the management issue. Sysdig can measure up to millions of metrics with long-term holding and only one backend. How Impressive.
Key Features:
- Kubernetes monitoring
- Cloud security
- DevOps system
Why do we recommend it?
Sysdig offers monitoring for Kubernetes and also has a cloud-native application application protection platform that scans Kubernetes settings and also monitors container activity as Docker creates and destroys new instances. This tool is more focused on Kubernetes than Docker and it operates through a cloud-based Prometheus implementation.
Who is it recommended for?
If you are using Docker, you are probably managing your activity through Kubernetes. Therefore, Sysdig qualifies for this list of Docker monitoring tools. Annoyingly, the company has stopped publishing its price list, which will make small businesses nervous about inquiring. Some container management scripts are available for free in the Sysdig Github repository.
Pros:
- Provides configuration scanning for Kubernetes
- Live security monitoring for Kubernetes
- Free container scripts in Github
Cons:
- Doesn’t actually monitor Docker
7. Dynatrace
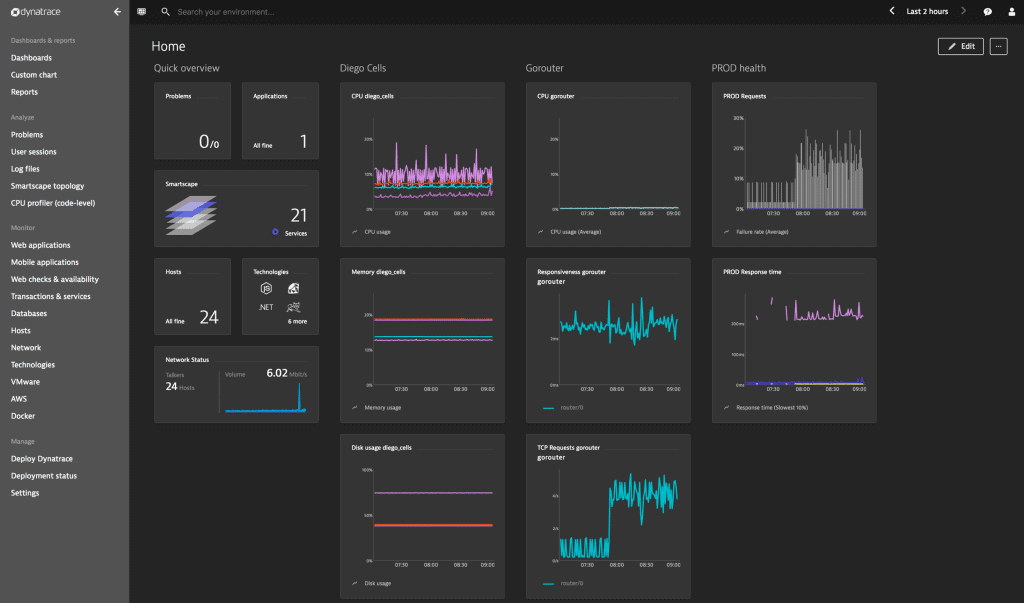
Dynatrace is a complete observability solution that gives you a user-friendly approach to Docker monitoring of your container’s metrics and logs.
It is available in software as a service (SaaS). Most of your Docker monitoring requirements, including its logs and the infrastructure it is working on, will be fulfilled by this tool.
Dynatrace allows you to explore container resource usage of different hosts. You also have access to some Docker metrics like RSS, CPU usage, and the total amount of time that a container’s CPU usage was attacked.
Key Features:
- Infrastructure monitoring
- AI-based
- Application dependency mapping
Why do we recommend it?
Dynatrace offers two levels of service and Docker monitoring is part of its lower plan, which is the Infrastructure Monitoring edition. This package is much cheaper than the upper plan which is the Full Stack Monitoring edition. So, you can choose whether to just monitor Docker or monitor the container and the software it contains.
Who is it recommended for?
Dynatrace is cloud based and prices its services per host per hour. That makes the system affordable for any size of business. The Full Stack edition includes infrastructure. However, it is twice the price of the Infrastructure Monitoring plan. So, you will need to assess your needs and budget before signing up.
Pros:
- Discovers Docker instances and all other infrastructure
- Higher plan identifies and tracks applications and infrastructure
- Uses AI to predict potential resource shortages
Cons:
- No on-premises version
8. cAdvisor
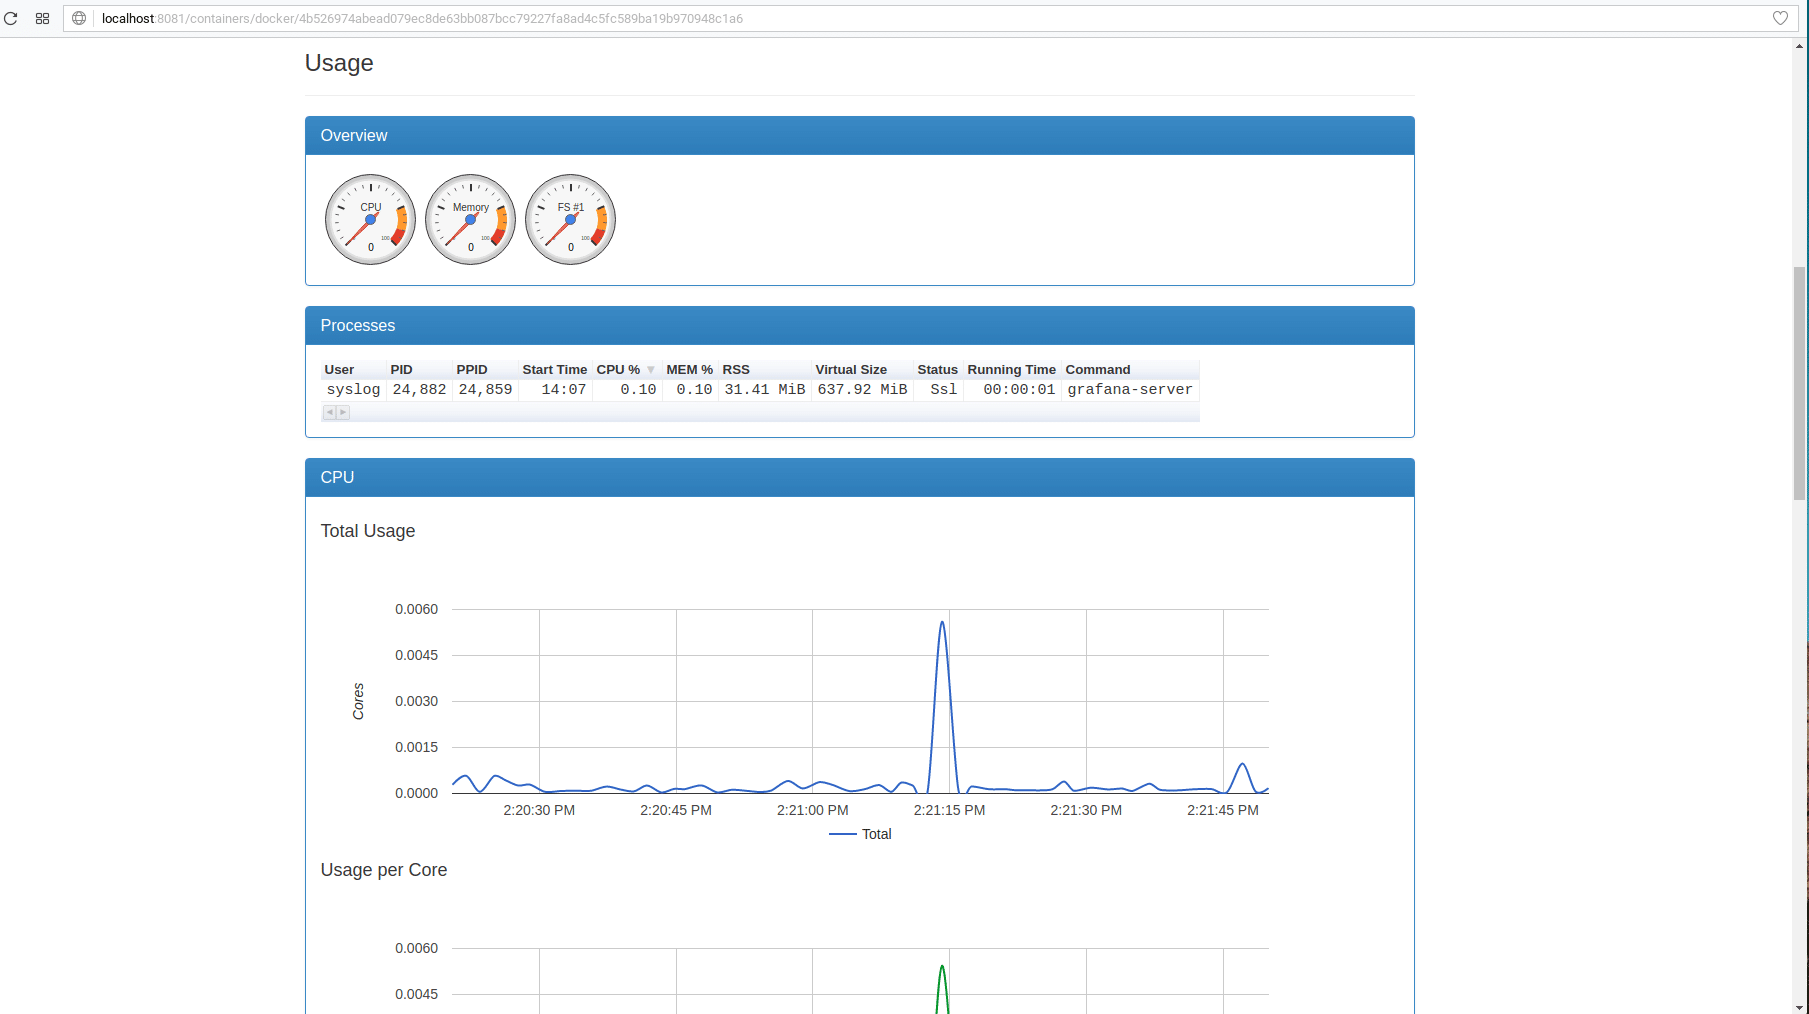
cAdvisor, also known as Container Advisor, is an open-source metrics collector built by Google to examine and expose usage and performance data of your resources from running containers.
It is quoted by Github Repository that: “cAdvisor (Container Advisor) provides container users an understanding of the resource usage and performance characteristics of their running containers”.
In simple words, this states that cAdvisor works as a daemon and collects, processes, and exports data about containers. It keeps the data of isolation parameters and network statistics for every single container. This data is then exported by container throughout the machine.
Key Features:
- An open source Google project
- Available on GitHub and SourceForge
- Written in Go
Why do we recommend it?
The cAdvisor open source project was created by Google, so it has the benefit of being free to use and having excellent project management. This system is more of an analysis service for the performance of containers rather than a live monitor. However, if you know how to program in Go, you can always alter the source code to get more live interaction.
Who is it recommended for?
You should be aware that cAdvisor is not a full monitoring system. It is a data collector and you will need to forward the records that it forms on to another application. So, although it is free to use, you will need to spend money on skilled technicians to set up the system and feed data through to a console of your choice.
Pros:
- Free to use
- An adaptable system that can be customized
- Choose your own front end
Cons:
- This is a data collector rather than a monitoring system
9. Sumo Logic
One of the best docker monitoring systems is Sumo Logic. It has more than 150 apps and integrations to make it easy for you to sum up your data across your stack.
Sumo Logic integrates containers that enable you to troubleshoot and do the root cause analysis of problems from distributed container-based apps and the Docker containers.
You have a native collection source for the whole infrastructure, with real-time monitoring including events, stats, the ability to troubleshoot problems, container logs, and sets alerts on unusual application or container behaviors.
Then, you can visualize the date with your customized dashboards and gain visibility throughout your infrastructure.
Key Features:
- Cloud based
- Log analysis
- Security monitoring option
Why do we recommend it?
Sumo Logic provides both live monitoring and historical analysis on its cloud platform. The source data for these functions is uploaded from site agents – these are also available for cloud platforms. All plans include Docker performance monitoring along with application and host monitoring. A security edition provides observability and cloud security monitoring plus a SIEM.
Who is it recommended for?
All companies will be attracted by the editions of Sumo Logic. These plans combine multiple services for one subscription, including live monitoring, analytical tools, and log management. Small businesses will be interested in the Free edition, which has capacity limitations that are generous. The price calculation or paid editions is complicated.
Pros:
- Plans provide options for performance monitoring and security monitoring
- Includes distributed tracing
- Provides root cause analysis
Cons:
- Each element in a plan has a separate price structure that needs to be totaled up
10. Splunk
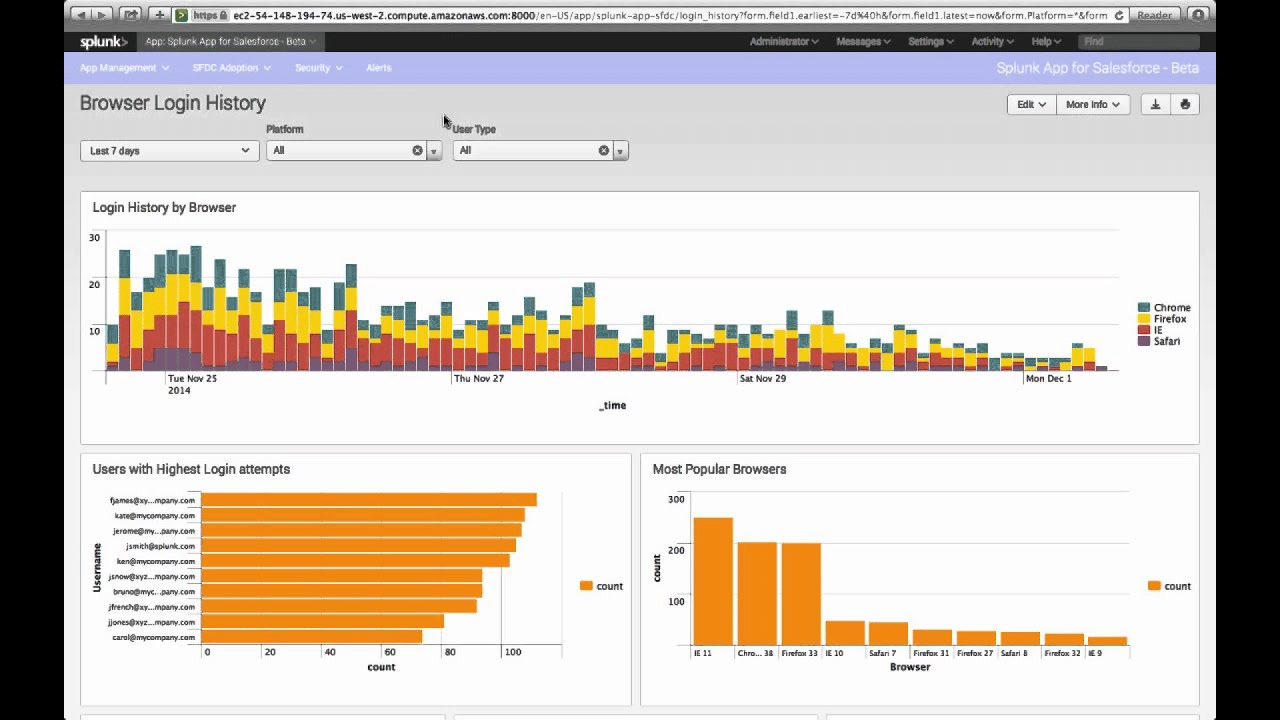
Splunk helps you with Docker Monitoring from host to container to application on just a single dashboard. You can easily see the infrastructure metrics and compare the performance of a single host to the whole population.
You can also relate performance metrics to a particular container and know if it has impacted your app at the service level.
Splunk collects various data about infrastructure, logs, and applications. You also get the discovery of Kubernetes components which lets you monitor the whole stack instantly.
Key Features:
- Observability or security
- On premises or cloud deployment
- Provides container monitoring
Why do we recommend it?
Splunk has grown from a data analysis package into a platform that offers many service options. The main split in the list of tools available is between the Observability and Security categories. Both of these options include Docker monitoring. The on-premises version is called Splunk Enterprise and it runs on Linux or Windows Server.
Who is it recommended for?
Splunk has a very large customer base and it has become one of the leading monitoring tools in the world. However, it no longer has a Free edition and the company binned its Lite plan, so there isn’t an option that is suitable for SMBs. Large companies will benefit from this comprehensive package.
Pros:
- Live performance tracking with alerts
- SIEM option
- SOAR module
Cons:
- Too big for SMBs
How to choose the right tool for yourself
There are some open-source observability tools of containers for monitoring, logging, and tracing that are available. They all do the job well, and it’s up to you to pick out the best one according to your requirements and the amount of effort you want to put into the maintenance.
If you require observability, you will have to invest time into picking out the most valuable tools, learning how to use all of them, and finally install, maintain and configure them. Therefore, it would be wise to compare multiple tools and check how well different tools work together. Here’s how we suggest picking out the best docker monitoring tool for your usage.
- Coverage of log formats A typical app stack contains multiple components, including databases, message queues, web servers, etc. Make sure your apps enable you to structure logs. There are some ways of keylogging that you can follow if you’re planning to use your logs for troubleshooting and deriving insights from them. Defining log patterns with usual expressions takes a lot of time. However, this is a time-saver, especially in the world of containers when you use docker images.
- Coverage of collected metrics Some tools only gather a few metrics, and some collect a lot of metrics, which may not be of any use to you, while some tools allow you to configure which metrics are helpful for you. Not picking out valuable metrics can be frustrating when working under pressure to solve an issue related to production. Having the wrong metric or many of them will make it hard to locate signals that matter. Tools that need configuration to collect or visualize each metric take time to set up and maintain. Don’t use such tools. Instead, look for the ones that give you excellent freedom to customize the collection of your metrics.
- Detect and correlate metrics with the same behavior When metrics have similar behavior, we find one of the metrics typically is the leading cause of a performance jam. A perfect example we know about is high CPU usage corresponding with disk IO and swap activity. In this case, CPU usage and disk IO could be reduced by turning off swapping for the containers. The relation is known chiefly for system metrics above, but when you track your app-specific metrics, you can find new correlations and jams in your microservices that you will have to optimize later.
- Correlation of metrics, logs, and traces Whether you spot a problem initially through metrics, traces, or logs, having access to the complete observability data makes analyzing quick and easy. A single UI displaying data from many different sources is the key for fast troubleshooting and makes the DevOps’ job better and more enjoyable.
- Collection of events Any sign of why a service crashed or was restarted will help you know the problems quickly and get to the primary cause easily. Any container monitoring tool should collect Docker events then.
- Machine Learning abilities and anomaly detection for alerting on metrics and logs Alerts based on Threshold work fine only for the known and consistent workload. Threshold-based alerts create a lot of noise in dynamic environments. You need to make sure the tool you select has this ability and that it doesn’t require ages to know the baseline or need too much training or such.
- Single sign-on It is impossible to store Correlating data in silos. Also, using many services often needs multiple accounts, learning various services and their Uls, etc. Every time you use any of them, there is the painful overhead of adjusting anything like the time range just before you can check your data in them. This requires time and money and makes it complicated to share data with your team.
- Role-based access controlLack of RBAC will be a show-stopper for any tool that seeks adoption at the level of corporate. Tools that work nicely for teams with fewer members and SMBs, but don’t have proper multi-user support with their roles, and the permissions never meet the requirements of huge companies.
- The total cost of ownership
- While planning the setup of monitoring, people mostly underestimate the quantity of data caused by monitoring agents.
- Most companies underestimate the resources required for processing and retrieval of metrics and logs when their volume increases.
- An issue that companies commonly face is underestimating the effort of people and the investment of time required for the maintenance of monitoring open-source tools and infrastructure. This not only causes the cost for monitoring and logging to go over anyone’s expectations but also increases the time. Thus more money is required for the maintenance of the infrastructure.
- You can reduce it by limiting any data retention. This needs fewer resources, less experience to work on the infrastructure and tools, and less maintenance, but it limits the access and insights derived from long-term data.
- Another thing that works is lessening the granularity of metrics from an exact 10 seconds to a minute. This method is known as sampling. However, this can lead to other issues like having inaccurate information with less time to analyze problems and limited insight into the issues.
- You can avoid these problems entirely by picking a SaaS tool that does everything for you. Then, the only thing you have to do is send the data, and you will be able to sleep at night with no worries.
- Microservices transaction tracing
- Till now, we’ve only talked about monitoring and logging, ignoring the term Microservices transaction tracing as the third part of observability.
- Remember that the amount of data will increase as soon as you start gathering transaction traces in microservices. This leads to an increase in the total cost of ownership of a monitoring setup.
Conclusion
No matter how many Docker containers you’re working on, monitoring them is the best way to keep your app in progress and its users satisfied. Therefore, DevOps engineers need proper monitoring, tracking, and logging solutions with advanced functions like correlating traces, metrics, and logs.