A Data Center is a physical location for businesses to store essential mission programs and industry-differentiated information. The computer network and storage resources must be kept in mind while building a data center that enables standard applications and data across the company. The routing and switching, firewalls, storage systems, and server interactions are all part of an architecture. Now, the data centers, which was a good thing only a few years ago, are very different. A more advanced data center is available. Many companies now wholly take over conventional physical servers from the virtual network systems that allow applications and workloads to be distributed across a multi-cloud environment and physical infrastructure pool.
Here is our list of the best data center monitoring tools:
- ManageEngine OpManager – FREE TRIAL A simple-to-use application that can track various metrics on various devices, including routers, switches, virtual machines, printers, storage devices, and more. Start a 30-day free trial.
- Site24x7 – FREE TRIAL This paid tool has a free trial and also a limited free version. It extracts traffic data from switches and routers. Available for Windows Server and Linux. Start a 30-day free trial.
- Paessler PRTG Network Monitor – FREE TRIAL A robust tool that ensures you’re always on top of your IT infrastructure. Download a 30-day free trial.
- SolarWinds Data Center management SolutionsLightweight, easy-to-use, and strong enough to handle even the most complicated circumstances. Furthermore, its application performance monitoring is compatible with more than 1,200 different applications and platforms.
- Datadog A sophisticated monitoring solution that gives you complete insight across on-premises, cloud, and hybrid environments.
- NLyte Software A full-featured data center infrastructure management tool that can help you optimize your critical infrastructures, such as your data center, hybrid environment, cloud, and edge computing resources.
- CloudMonix Α monitoring and automation solution that can be used both in the cloud and on-premises.
- EcoStruxure Α data center monitoring tool that assists in the management and monitoring of infrastructures across a variety of scenarios. In addition to providing actionable intelligence, its vendor-neutral architecture helps to enhance performance and reduce risk.
- Uila Α powerful application-centric data center monitoring solution that can track the performance of many apps, identify dependencies between them, keep ahead of cyber threats and vulnerabilities, and automate root cause analysis.
- Kaseya VSA Α feature-rich unified monitoring and management application for the complete monitoring of your IT infrastructure.
- Device42 Α hybrid cloud discovery and dependency mapping tool that gives you complete visibility into your data center, including all of its dependencies and associated resources
- Zabbix Οpen-source software for keeping track of a variety of devices and situations. It is suitable for both local and large-scale enterprise IT environments.
We will explore each tool one by one and give you a detailed description of its features, pros and cons, and cost.
Global data networks are present and will continue to exist in a wide range of data centers, border data center sites, and public cloud sites, among other locations. A connection to the data center, which may be located on-site or in the cloud, is required for each of these locations. In addition, additional public cloud data centers are now accessible for usage by customers. The cloud service provider makes use of the data center resources that are made accessible via cloud computing.
A Data Center’s primary components
Many components, including routers, switches, firewalls, and storage systems, are available in the datacentre design. The fact that these components hold and handle mission-critical information and applications makes it critical to consider data center security when planning the architectural architecture of a data center. In addition, as a consequence of their cooperation, they may be able to provide the following services to their customers:
- Infrastructure for the network. Aside from that, it is used to connect end-user sites and other external connections such as actual and virtual servers, data-center services, storage, and other such external links.
- Infrastructure for storing data. Data is the contemporary data center’s lifeblood. This valuable commodity is kept in storage systems.
- Resources for computing. A data center’s engines are applications. Applications are driven by these servers, which offer processing, memory, local storage, and network access.
Why do we need Data Centers?
The world has evolved, and there is a greater demand for information than ever before. Society was pleased with modest television broadcasts with few channels to choose from only a few decades ago. Even communication is straightforward, and snail-mail is extensively used. However, this is no longer the case. Since the internet has become a daily need, and virtually everyone now owns a Smartphone, we spend most of our waking hours online. The internet plays a massive role in our life, whether it’s for business or sociability. As a result, the need for real-time data transmission has never been greater. The demand for computers and other networking equipment to fulfill these requests drives the modern data center’s development.
Data centers are complicated, and managing them necessitates a team of professionals backed by the latest monitoring software. However, this combination can aid in proactively identifying and addressing issues before they affect end-users. They can also prevent security flaws and the resulting financial loss, which may be thousands of dollars.
Nonetheless, with so many options, picking the appropriate tool might be difficult. Furthermore, you must select a tool most suited to your data center setup and business requirements. This is why we have discussed some of the most effective tools on the market today. Furthermore, these tools are usually comprehensive and provide various functions, making them an excellent choice for most circumstances.
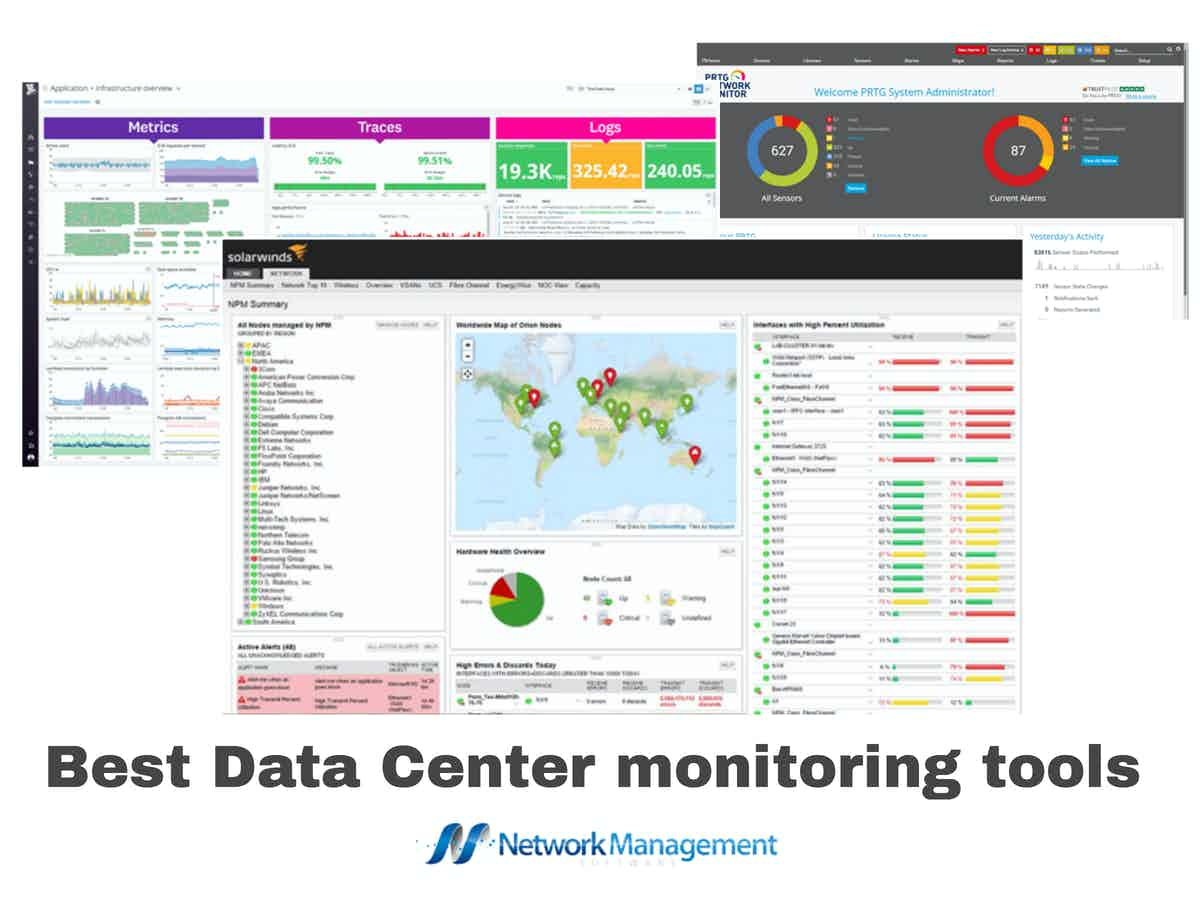
The Best Data Center Monitoring Tools
1. ManageEngine OpManager – FREE TRIAL
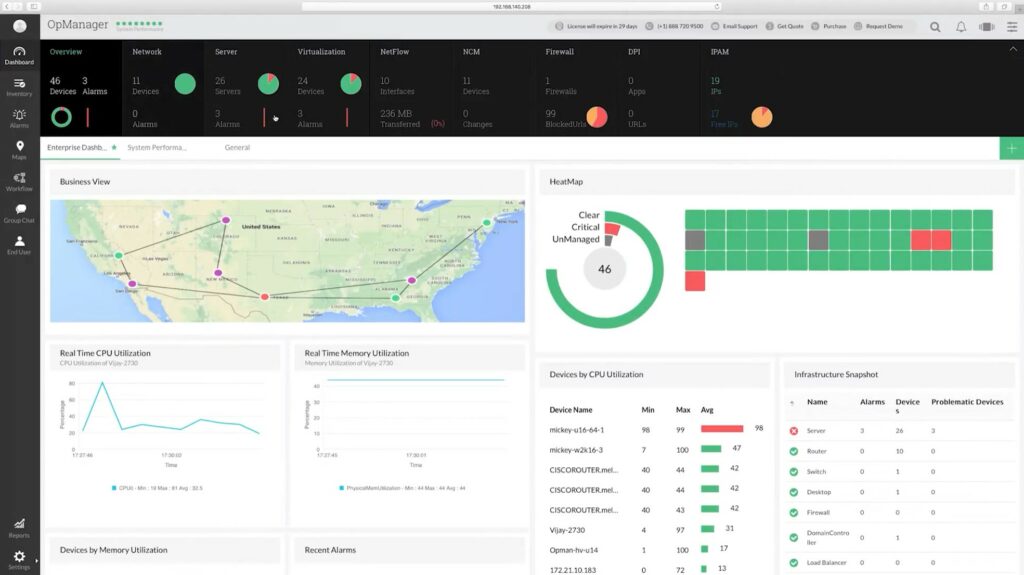
ManageEngine OpManager is a simple-to-use application that can track various metrics on various devices, including routers, switches, virtual machines, printers, storage devices, and more. Its powers aid in locating and eliminating the root cause as quickly as possible.
Its primary characteristics are:
- Real-time monitoring of measurements
- Keeps track of physical and virtual machine performance.
- Sets several thresholds and sends out quick alerts when they are exceeded.
- The dashboards can be customized entirely.
- More than 200 performance widgets are integrated to offer you a complete picture of the health of your infrastructure.
- Provides precise information to help you find the source of the problem.
Why do we recommend it?
ManageEngine OpManager is a very close competitor to the SolarWinds Network Performance Monitor. This tool also relies on SNMP. Most network devices and servers already have an SNMP agent installed, so the service only needs an SNMP Manager to gather status data, which is the role that OpManager provides.
Who is it recommended for?
Large data centers looking for an automated network and server monitor will need to compare this tool and the SolarWinds system because they are both very suitable for larger businesses. The top edition can monitor multiple networks, which means that the data center can also watch over the networks of branch offices.
Pros:
- Network Discovery, inventory documentation, and topology mapping
- Based on the Simple Network Management Protocol
- Can monitor a single network or multiple sites depending on the chosen edition
- An edition for managed service providers is available
Cons:
- The free edition only monitors three interfaces
Download the 30-day free trial.
2. Site24x7 – FREE TRIAL
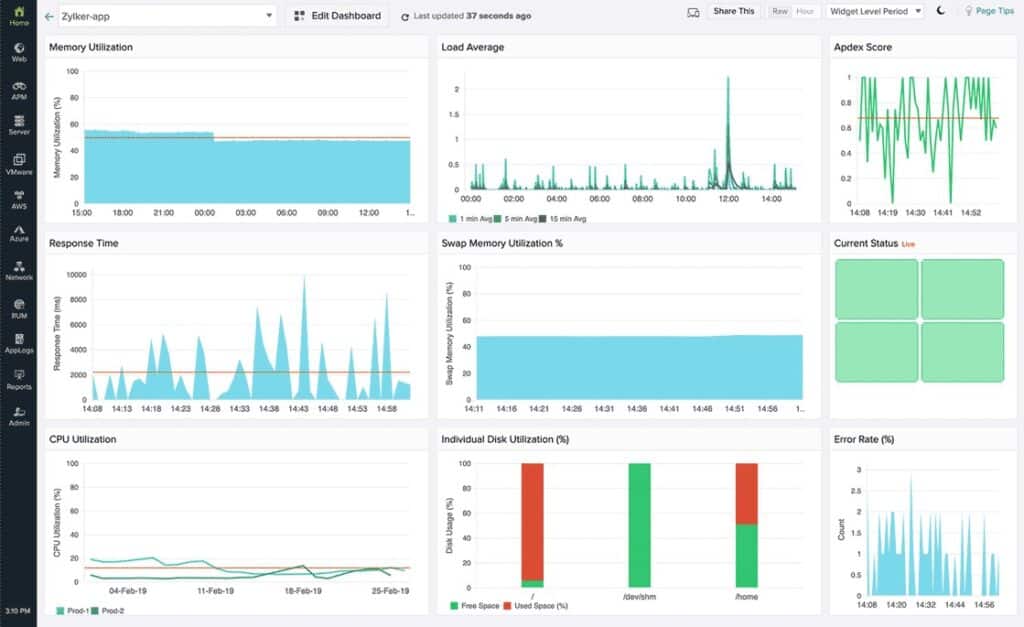
Site24x7 is a full-stack monitoring platform accessible to both small and large businesses for monitoring servers, services, networks as well as applications. Customers can choose from the different plans and fulfill their monitoring needs using this tool. Also, if you run a data center and want to keep track of all your resources for better performance delivery, it can be a great choice.
Key Features:
- Keeps track of all IT resources
- Sends real-time performance alerts
- Supports software inventory creation
- Consolidate and analyze logs
Why do we recommend it?
Be it MSPs, small businesses, or large businesses, all of them can use the tool and choose from the different editions available on the Site24x7. Businesses can even pay a higher fee for greater capacity.
It is an all-in-one solution you can rely on to constantly monitor the performance and availability of your data centers. Further, be it physical, virtual, or logical components of your data center, the tool works great in all cases. Using it, businesses can keep an eye on all the key metrics and remove performance bottlenecks. All you will need to do is install server monitoring agents or an On-Premise Poller that will make the whole process of managing and monitoring data center infrastructure simple.
Who is it recommended for?
It is an AI-powered monitoring tool that provides complete visibility into your data center environment, monitors all systems, detects issues, and troubleshoots them quickly. Using this tool, businesses can perform automated monitoring for the entire infrastructure from a single console.
Pros:
- Monitor data center environment and infrastructure from a single console
- Discover devices in real-time, map them, and generate inventory reports
- Quick to set and maintains compliance
- Warns about developing problems by creating performance thresholds
Cons:
- Understanding all features may take some time as it is a feature-rich tool
Access the 30-day free trial.
3. Paessler PRTG Network Monitor – FREE TRIAL
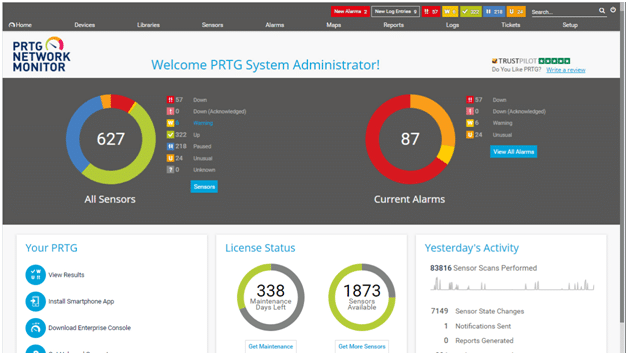
Paessler PRTG Network Monitor is a robust tool that ensures you’re always on top of your IT infrastructure. In addition, it has extensive monitoring features that allow you to keep track of all the systems, devices, applications, and traffic sources on your IT system, ensuring that you’re always aware of what’s going on.
Its characteristics are:
- No additional downloads or plug-in are required to monitor all systems, devices, and apps in your IT environment.
- Ideal for all types of enterprises
- Determines how much bandwidth is used.
- Obtains detailed statistics by monitoring specified datasets and applications.
- All cloud services are monitored and managed from a central location.
- Supports the most widely used technologies
- Advanced maps and dashboards that display real-time data are included, as well as flexible alerting options.
Why do we recommend it?
Paessler PRTG is a large bundle of monitoring tools and the buyer chooses which to turn on. The core of the system is a discovery service that repeats throughout the service life of the tool. This documents all devices on the network and creates a topology map. Sensors in the bundle monitor servers and applications.
Who is it recommended for?
This package is suitable for use by any type or size of data center. The package is very flexible because each buyer tailors the system by deciding which sensors to turn on. This way, no one has to pay for features that they don’t need.
Pros:
- A SaaS platform or an on-premises software package for Windows Seever
- Monitors Windows Server and Linux
- Alerts for performance issues
Cons:
- No system management tools
The cost is determined by the number of sensors used. The following is the pricing. 500 sensors are $1,750, 1000 are $3,200, 2500 are $6,500, and 5000 are $11,500. $15,500 for unlimited sensors and one installation; $20,500 for 20,000+ sensors and multiple installations. Start with a 30-day free trial.
4. SolarWinds Data Center Management Solutions
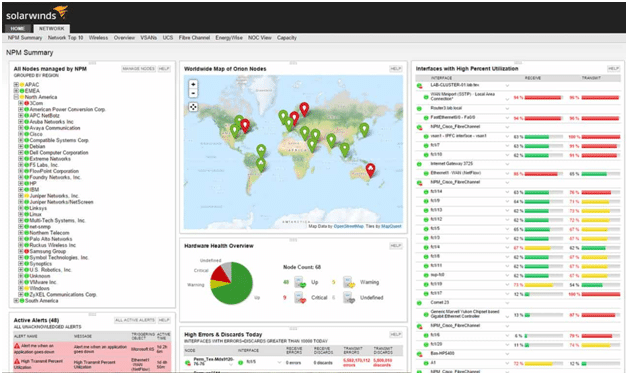
SolarWinds Data Center Management Solutions has simplified comprehensive server monitoring by making it lightweight, easy-to-use, and strong enough to handle even the most complicated circumstances. Furthermore, its application performance monitoring is compatible with more than 1,200 different applications and platforms. There are many various types of solutions offered by SolarWinds, including IT security and operations, database management, and administration of networks and infrastructures (including Azure Cloud solutions, Office 365 solutions, scalability, CISCO solutions, and many others). SolarWinds allows you to get up and running in a matter of minutes, configure server monitoring, and visualize application dependencies.
Its prominent characteristics are:
- Its scalable design works well across traditional, virtualized, cloud, and hybrid systems, providing centralized monitoring and management of the complete IT stack.
- It can be used on both on-premises and virtualized containers.
- Monitors for faults, performance, and availability across many platforms and vendors.
- Capacity is forecasted automatically for future planning.
- When values exceed certain thresholds, an alarm is sent.
- Gives you a clear picture of how commercial and custom apps are performing.
- Identifies and resolves vSphere and Hyper-V issues.
- Data from continuous streams is captured and converted into simple charts and reports.
- Provides a single storage monitoring solution that works with all vendors and devices.
- Maintains a close eye on VoIP and WAN performance.
Why do we recommend it?
SolarWinds Network Performance Monitor is an on-premises system that provides device discovery that compiles a network inventory and topology map. This system is based on the Simple Network Monitoring Protocol and it can also check on the statuses of servers if you activate an SNMP agent on them.
Who is it recommended for?
This package is certainly suitable for a data center. A central server location usually has a bank of servers and an access network that extends to consoles for technicians. So they can end up with quite a large network even though most of the users that they serve are at other locations.
Pros:
- Network device discovery that repeats continuously
- Relies on the Simple Network Management Protocol
- Creates and updates a network inventory and topology map
- Alerts for approaching resource shortages or component failure
- Runs on Windows Server
Cons:
- No SaaS option
A 30-day free trial is offered. On request, an interactive demo will be provided. The starting price is $2995
5. Datadog
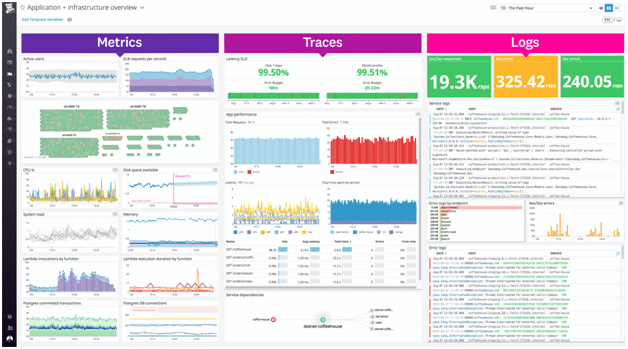
Datadog’s sophisticated monitoring solution gives you complete insight across on-premises, cloud, and hybrid environments. Its real-time interactive dashboard and notification systems also help to increase production efficiency.
Some of its main characteristics are:
- App performance is tracked through service overviews.
- Logs from all applications and devices are collected.
- This function creates a context for log data.
- When it crosses established thresholds, it detects performance concerns and delivers alarms.
- SLAs and SLOs are managed.
- Correlates frontend performance to business objectives.
- In cloud environments, it visualizes traffic flow.
- Allows you to create real-time interactive dashboards.
- Restful APIs are available to extend its capabilities.
Why do we recommend it?
Datadog is a cloud platform of system monitoring and management tools and it also offers modules for security monitoring. The units in the brand are charged for individually, so you can mix and match to get just those functions that your data center needs. You will probably go for the infrastructure module first. That watches servers and hosted applications.
Who is it recommended for?
Datadog is the core module of the platform and that is the minimum unit that any data center would go for. Datadog offers a free trial for all of its modules so, that is a good opportunity for any system administration team to explore exactly how many other modules they need.
Pros:
- A menu of services
- Infrastructructure, cloud platform, server, network, and application monitoring
- Connectors to extract performance data from specific technologies
Cons:
- Choosing a lot of modules can get expensive
Pricing:
- Free
- Pro – each host pays $15 per month.
- Enterprise – per host, $23 per month
For a free trial, click here.
6. NLyte Software
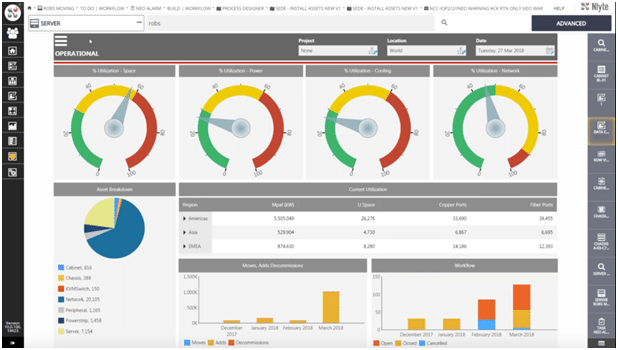
NLyte Software is a full-featured data center infrastructure management tool that can help you optimize your critical infrastructures, such as your data center, hybrid environment, cloud, and edge computing resources.
Some of its salient characteristics are:
- Observes telemetry points to improve power and thermal efficiency.
- Reduces downtime caused by network resource maintenance cycles.
- Predicts disruptions so you can prepare.
- Places application workloads in the best possible location.
- Provides total visibility into all devices’ health and performance.
- Reduces expenses and resource utilization by unifying the data center ecosystem
- Maintains critical infrastructure while keeping workloads available.
- Detects problems with your devices’ performance.
- Transparency is provided across the whole facility’s infrastructure.
Why do we recommend it?
Nlyte Data Center Monitor. The suite includes the DCM module, which tacks the statuses of hardware. That extends to monitoring the temperature and power supply for the server room and the entire building. The package also monitors server and device capacity and utilization. The package includes server capacity planning and workload balancing.
Who is it recommended for?
This package is suitable for any business that runs servers on its premises. It provides a map of the server room, noting the locations of servers. The system will be more useful to large data centers because they will get maximum cost benefit from the package.
Pros:
- Environment monitoring
- Server temperature and power supply tracking
- Server capacity planning
Cons:
- Doesn’t include application monitoring
Call 650-642-2700 or email sales@nlyte.com for pricing.
7. CloudMonix
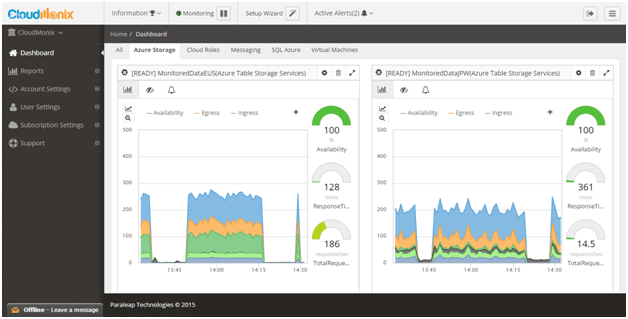
CloudMonix is a monitoring and automation solution that can be used both in the cloud and on-premises. It can monitor your systems and resources and offer information on their health and performance through a single dashboard.
Its characteristics are:
- It keeps track of the performance and availability of all devices and resources in your network and sends notifications when there is a problem with production.
- The entire recovery procedure is automated.
- It automatically scales resources in real-time.
- This product includes dashboards that are ready to use and that provide complete information.
- Procedures for healing and rehabilitation are automated.
- Scales up a variety of resources to satisfy the need
- There are numerous unique features that have been developed to fulfill the needs of MSPs and CSPs.
Why do we recommend it?
Netreo CloudMonix is a server monitoring package that includes the capability to monitor IaaS and PaaS systems on AWS and Azure. For each platform, the system tracks the activity of important applications, such as databases and storage management systems. The system can exchange data with third-party monitoring tools, such as Service Now, and Jira.
Who is it recommended for?
This system’s main service is availability monitoring. There is a Free edition that is limited to uptime checks for servers that run every 10 minutes. You can get results fed to you in Slack. The paid plans provide a dashboard and those tools can also send results to third-party monitoring systems. The system is designed for use by MSPs.
Pros:
- Cloud-based system
- Availability tests
- Monitors servers running Windows Server and Linux and also the AWS and Azure platforms
Cons:
- Doesn’t provide resource availability monitoring
Starter is entirely free. Per month, you will be charged $15 per resource. Monthly resource fees are as follows: $20 per resource each month.
8. EcoStruxure
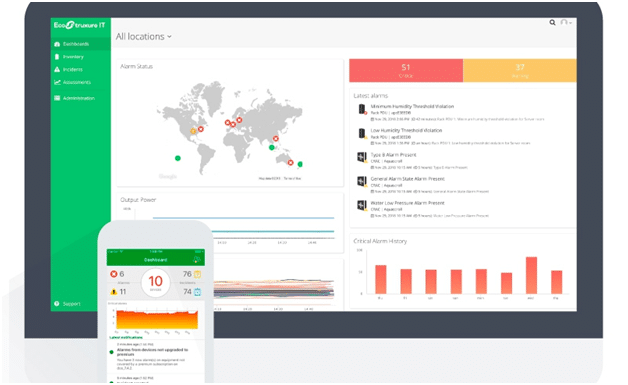
EcoStruxure is a data center monitoring tool that assists in the management and monitoring of infrastructures across a variety of scenarios. In addition to providing actionable intelligence, its vendor-neutral architecture helps to enhance performance and reduce risk.
Its characteristics are:
- Checks the status and performance of your on-premises and cloud infrastructure regularly to ensure that they are always available.
- Provides remote monitoring services by experts in the field.
- Manages alarms to ensure that only the most important and relevant notifications are sent.
- This helps to ensure that essential resources are always available.
- Data Center management is improved as a result of increased efficiency and improved facilities.
- Deals with incidents in a proactive manner.
- There are no restrictions on which vendors may use it, and it works well across various systems.
Why do we recommend it?
EcoStruxure is a data center infrastructure management (DCIM) package that watches over hardware and environments. If your data center is based around your own servers, you can monitor the server room environments and rack and blade or server unit power supply and temperature. The software can also check on fan speed for racks and servers.
Who is it recommended for?
You will need to be running at least a rack of servers on premises to justify using this tool. Alternatively, you can use the package to monitor cloud services, which could be rented bare metal servers or platforms, such as AWS or Azure. However, PaaS users won’t be able to take action on the monitor’s feedback.
Pros:
- Server environment monitoring
- Server and rack monitoring
- Remote monitoring
Cons:
- No price list
EcoStruxure has three pricing editions to choose from:
- EcoStruxure IT Expert costs $66 per year per device.
- EcoStruxure Asset Advisor costs $120 per year for each device.
- $256 per rack per year for EcoStruxure IT Advisor.
9. Uila
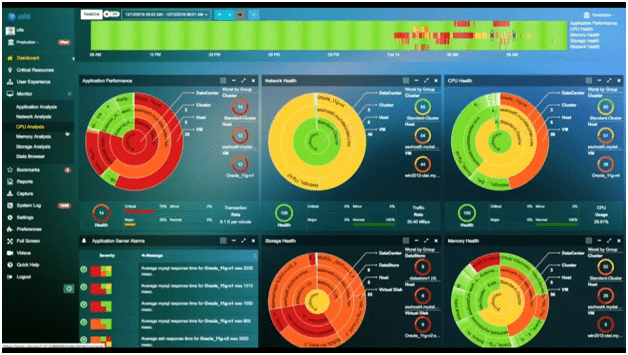
Uila is a powerful application-centric data center monitoring solution that can track the performance of many apps, identify dependencies between them, keep ahead of cyber threats and vulnerabilities, and automate root cause analysis.
Some prominent characteristics of this tool are:
- It takes less than an hour to set up and doesn’t require any additional software.
- It’s a platform for unified monitoring and troubleshooting.
- Dependencies are automatically mapped.
- Anomaly behavior is detected.
- Prevents problems before they have a negative influence on the firm.
- Produces a variety of reports for various business purposes.
- Conforms to regulatory requirements
- Monitors the performance of several devices in great detail.
- Deals with cyber-threats
- Pre-migration cloud assessment time is cut in half.
- Reduces unplanned downtime
- Employees are more productive because they spend more time fixing minor issues.
- Monitors the entire stack.
Why do we recommend it?
The Uila platform offers three divisions of services. The first is a performance monitor for servers, there is also a security scanning system and an application dependency mapping service. So, you get hardware and environment monitoring for servers, capacity and utilization monitoring, threat protection, and application performance root cause analysis.
Who is it recommended for?
This package is suitable for a company that runs its own servers in its data center. It could also be used for companies that utilize rented bare metal servers. The full package wouldn’t be suitable for users of cloud platforms, such as AWS or Azure because those managers won’t be able to do anything about environmental problems.
Pros:
- Track multiple server locations simultaneously
- Security monitoring
- Forecasts demand compared to existing capacity
Cons:
- No price list
For new customers, Uila offers a 30-day free trial. For custom prices, contact the company.
10. Kaseya VSA
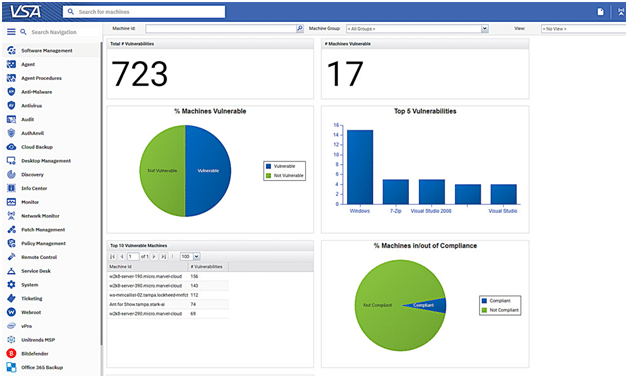
Kaseya VSA is a feature-rich unified monitoring and management application for the complete monitoring of your IT infrastructure. It also has several managing infrastructures automation features to help reduce workload and increase operational efficiency.
Its characteristics are:
- All traditional endpoints, such as servers, PCs, laptops, SNMP network devices, and printers, are monitored and managed.
- Gives you a bird’s eye view of your whole IT infrastructure and generates reports and dashboards to help you visualise your data
- Automation improves efficiency.
- Endpoints are managed remotely to discover and remedy issues swiftly.
- IT activities such as patch and vulnerability management are automated.
- Organizes backups.
- Removes operations that aren’t related to your IT infrastructure, as well as underutilized tools, to improve overall efficiency.
- Discovers and maps new devices.
Why do we recommend it?
Kaseya VSA is a remote monitoring and management package that is designed for use by managed service providers. The system is able to track endpoints, servers, networks, and applications running on other sites. It could also watch over equipment running on the same site but that isn’t the main use case for the package.
Who is it recommended for?
The key characteristic of the Kaseya VSA system is that it is intended for use to watch over remote systems. The typical concept of a data center is a location that has a large number of servers on site. In this scenario, Kaseya VSA wouldn’t be the best fit. However, it could be used by an MSP to manage the data centers of other companies.
Pros:
- Remote monitoring and management of entire sites
- Maintenance task automation
- Automated monitoring with alerts
Cons:
- No price list
Contact the customer support team, and it will give you the custom price.
11. Device42
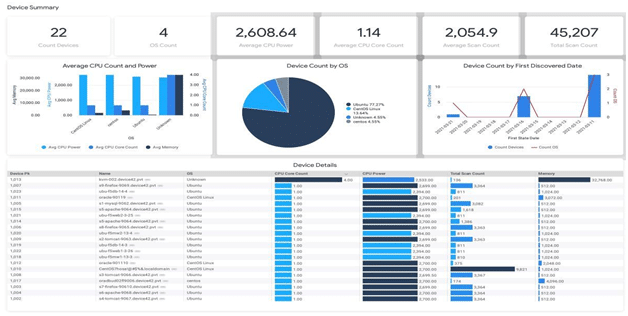
Device42 is a hybrid cloud discovery and dependency mapping tool that gives you complete visibility into your data center, including all of its dependencies and associated resources.
Its significant features are:
- Gives you complete visibility throughout the whole IT stack.
- Complies with both internal and external regulations.
- Identifies cross-environmental dependencies
- Works effectively for large enterprises with complicated IT architecture since it automatically discovers infrastructure and apps across the data center and cloud.
- Most ITSM and SIEM tools are compatible.
- Downtime is reduced, and overall operational efficiency is improved.
- Provisioning and automation are improved, and the existing burden is optimized.
- Within your organization, it provides extensive root cause analysis and a single source of truth.
- Applicability dependencies are discovered and mapped.
- All shared passwords across multiple teams are managed centrally.
Why do we recommend it?
Device42 is an ITSM package. It is able to document all of the equipment on a site and it also provides live performance monitoring. The platform includes a data center infrastructure management (DCIM) module that will monitor the environment and hardware statuses of servers. The package includes a server room layout plan that lets system managers document where each server, rack, and blade is located.
Who is it recommended for?
This package is very well organized for use by any mid-sized to large organization and the DCIM unit makes it particularly useful for data centers. The platform has a lot of features in it and so it would appeal to a startup data center or a company that wants to completely retool all its monitoring systems.
Pros:
- System discovery and documentation for ITSM
- Server room layout visualization
- Live environment and activity tracking
Cons:
- No price list
Device42 is available as a yearly subscription, with prices varying according to the number of devices and IP addresses used. Contact the sales staff for a custom price.
12. Zabbix
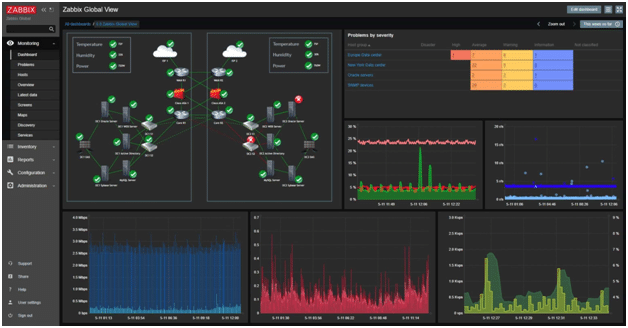
Zabbix is open-source software for keeping track of a variety of devices and situations. It is suitable for both local and large-scale enterprise IT environments.
Some of its main characteristics are:
- It can monitor 100,000+ hosts and metrics, giving it near limitless scalability.
- Supports distributed monitoring to help you keep track of apps across multiple locations.
- End-to-end encryption and ready-to-use templates are included.
- Devices are automatically discovered and mapped by Auto.
- Predicts trends and abnormalities so you can get to the root of the problem quickly.
- Can issue intelligent alerts and take corrective action.
- Metrics are collected from all devices, services, and apps.
- Sets intelligent thresholds
- All relevant data is displayed in a single window.
- You have the option of allowing Zabbix to resolve issues automatically.
- At all levels, data is safeguarded.
- Ideal for keeping an eye on vast, complex environments.
- Fits in well with the rest of the environment
Why do we recommend it?
Zabbix is a free system monitoring package that is able to cover servers, networks, and applications. Traditionally, this tool was created for on-premises monitoring but as cloud computing has developed, the Zabbix team has added on cloud monitoring as well. It is also possible to feed in readings from a sensor to add server room environment monitoring.
Who is it recommended for?
Zabbix is a well-established and stable monitoring package. It is free to use, which means it will appeal to small businesses. However, the package has some very large businesses on its client list, including Dell, the European Space Agency, and Seat. Larger companies can buy a professional support package from Zabbix.
Pros:
- Runs on Linux, cloud platforms, Docker, or VMs
- Full stack monitoring
- Watch over local and remote assets
Cons:
- Support contracts have to be paid for
It is 100 percent free. You can download it here.
