
All PCs and servers in a network generate some heat. There should be no issue if the heat is around the average level. However, a computer processor is built from several components: CPU, GPU, motherboard, fans, etc. If the heating is continuous and higher than usual, it can become problematic and damage these components. The best way to control the damage is to monitor the temperature of the CPU. So, If you notice a higher than normal temperature, you can try some fixes to bring the temperature lower. This can be done by using CPU temperature monitors.
Here is our list of the best CPU Temperature Monitors:
- PAESSLER PRTG Network Monitor – FREE TRIAL A powerful tool that monitors all the systems, devices, traffic, and applications in a network. Start a 30-day free trial.
- Site24x7 Network Monitoring – FREE TRIAL Real-time CPU temperature monitoring as part of a full-stack monitoring suite. Start a fully featured 30-day free trial.
- HWMonitor A complete hardware monitor. It can read voltages, temperatures, and fans sensors of a system.
- CoreTemp Monitors CPU temperature in a very easy-to-use manner. It displays the temperature of every core of each processor in a system giving you accurate CPU cores.
- Open Hardware Monitor A free, open-source hardware monitoring software. You can monitor all sorts of different components of your system.
- SolarWinds CPU Monitor Tracks and graphs the load for devices in a network. It provides real-time data of critical performance metrics like uptime, errors, and CPU response time.
- AIDA64 Extreme Monitors sensors of processors in real-time to collect CPU temperature, voltage, and fan speed readings.
- HwiNFO Provides hardware analysis monitoring and reporting for Windows and DOS operating systems. It offers in-depth information on all hardware components of a system in real-time.
- SpeedFan A CPU monitoring tool that monitors CPU temperature, fan speed, and voltage in a computer processor.
- NZXT Cam A Gaming PC monitoring app. One can monitor performance, temperatures, and devices by using it.
- RealTemp A CPU monitor application designed mainly for Intel single Core, Dual Core, and Core i7 processors.
A CPU temperature monitor is an application that collects data from various sensors of a processor and shows it in a graphical user interface. The CPU temperature monitors can provide essential metrics like the temperature and voltage of the CPU, GPU, fan, and the all-important motherboard. The next question on your mind will undoubtedly be the following: “which CPU temperature monitors should I use?”. And that’s exactly what I will be answering in this article.
Below we outline the best CPU temperature monitors. Both free, open-source tools, as well as highly customizable and feature-packed paid applications, compose our selection from which you can pick the monitor that is best suited to your needs.
The Best CPU Temperature Monitors
Our methodology for selecting CPU temperature monitoring tools and software
We reviewed various CPU temperature monitoring tools and analyzed the options based on the following criteria:
- Support for larger enterprise environments
- Support for monitoring other hardware components such as disk usage, memory allocation, and more
- A facility to analyze CPU temperature over time
- Graphical interpretation of data, such as charts and graphs
- A free trial period, a demo, or a money-back guarantee for no-risk assessment
- A good price that reflects value for money when compared to the functions offered
1. PRTG Network Monitor – FREE TRIAL
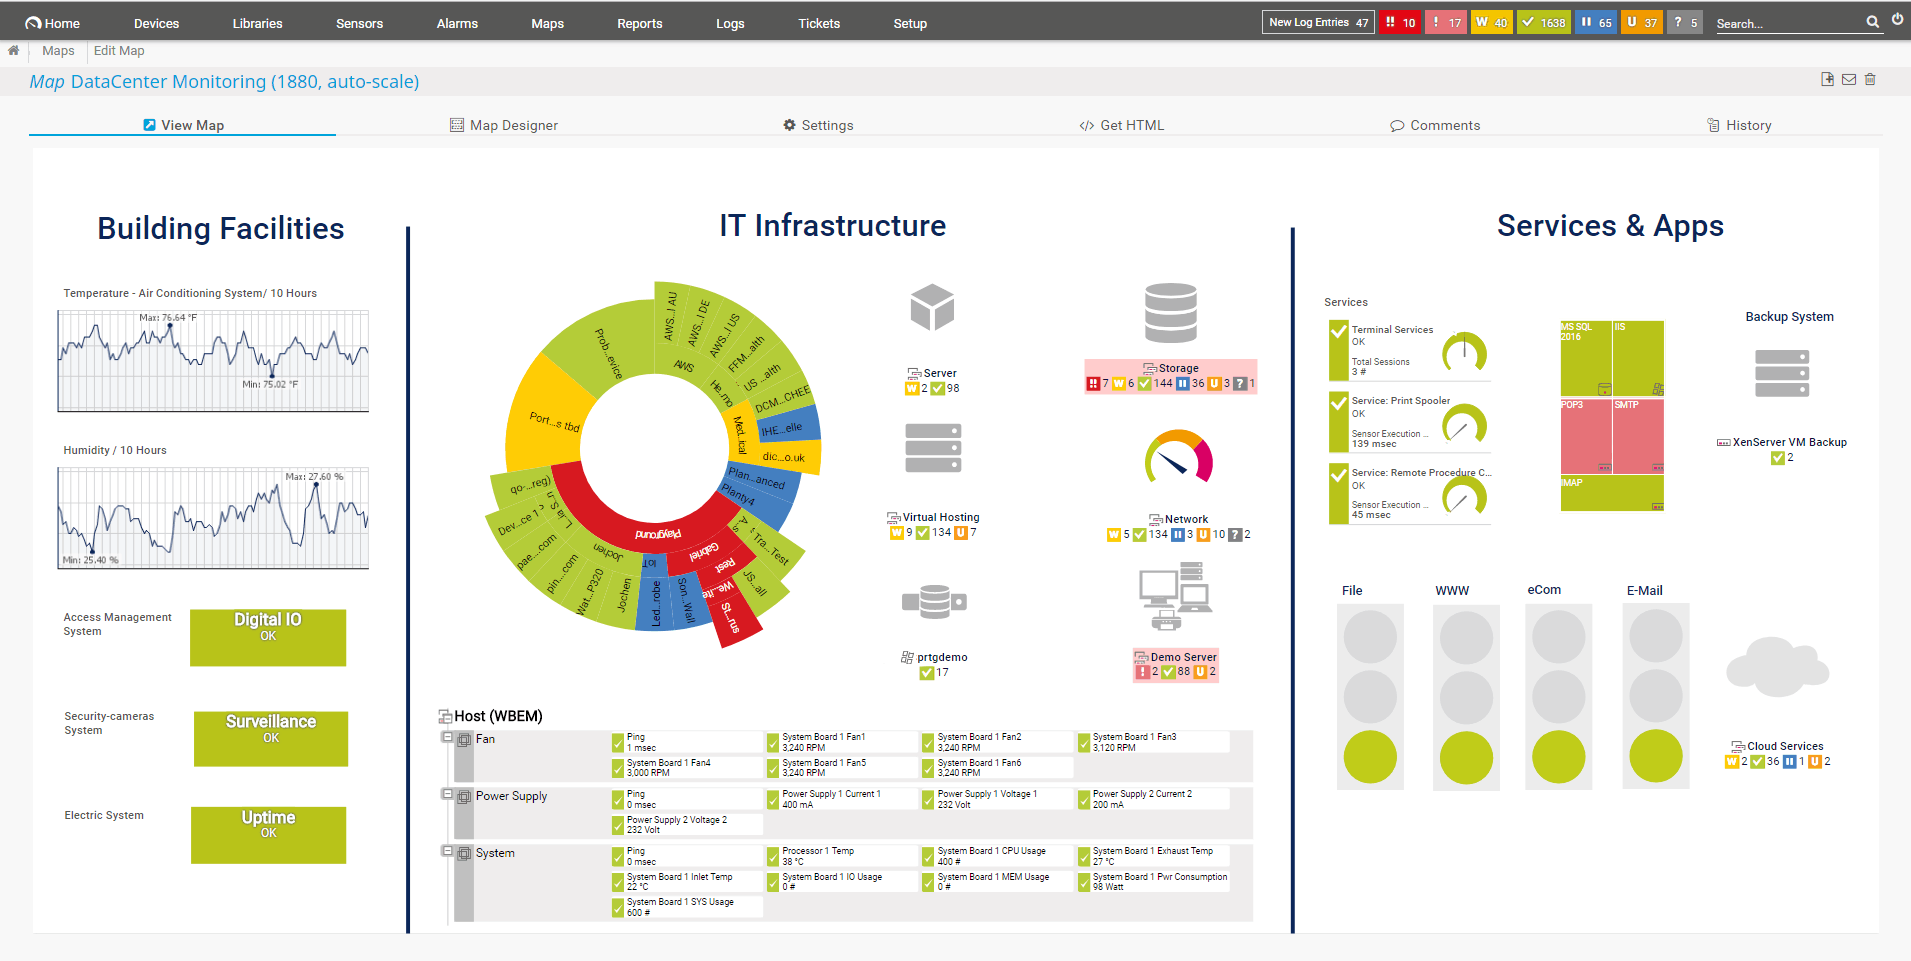
PAESSLER is the market leader in monitoring IT infrastructure. It offers PRTG a powerful tool called PRTG Network monitor. The PRTG monitors all the systems, devices, traffic, and applications in a network. It includes everything in one tool, so you don’t have to download any other plugin. It sends an alert to the admin whenever it discovers any problems in the system.
Key Features:
- Device discovery
- Servers and network devices
- Server room temperature
Why do we recommend it?
Paessler PRTG Network Monitor is a large bundle of monitoring sensors and buyers customize their purchase by deciding which sensors to activate. The package includes a CPU temperature monitor that will report on endpoints and network devices. The system operates with SNMP procedures to get regular reports on CPU temperatures.
Who is it recommended for?
PRTG is a good choice for any size of business because you buy an allowance of sensors and then decide which to turn on, this means the system is accessible to anyone. If you only activate 100 sensors, it is completely free to use. The system is available as a SaaS platform or for installation on Windows Server.
Pros:
- Offers hardware monitoring as well as network and application monitoring
- The Freeware version supports 100 sensors, great for small businesses
- Pricing is based on sensors in use, making it a good fit for both small and large networks
- Great options for companies looking to monitor all aspects of their IT system
Cons:
- Is designed for network professionals can take time to learn all features offered on the platform
It supports all the most popular technologies such as SNMP, WMI. SSH, PING, SQL, etc. With real-time maps, you can visualize the network with live information. Furthermore, it allows the creation of dashboards with the map designer to integrate network components. The PAESSLER PRTG Network Monitor can be downloaded completely free for 30 days with a free trial or by buying it. The price starts at $1750.
2. Site24x7 Network Monitoring (FREE TRIAL)
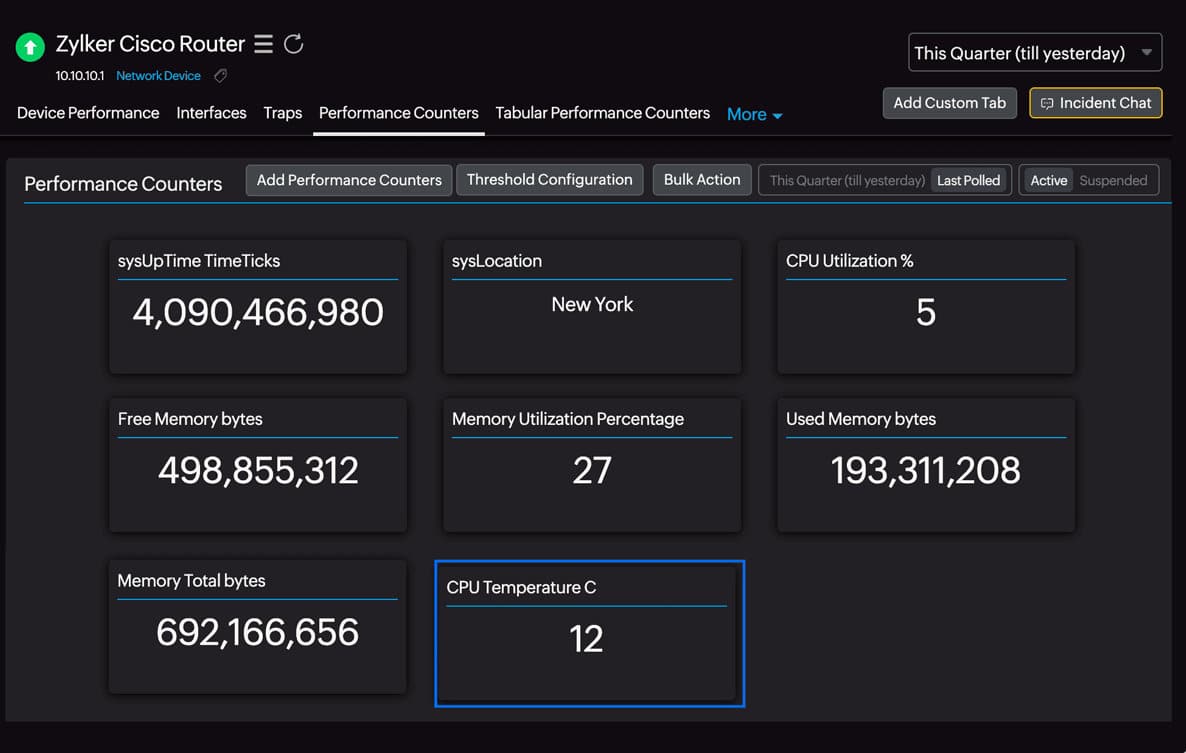
Site24x7 offers a powerful, cloud-based network monitoring platform designed for modern IT teams. Among its many capabilities, Site24x7 includes CPU temperature monitoring to help prevent overheating and hardware damage across servers and devices. With native support for Windows and Linux, this tool delivers high-value infrastructure visibility without the need for complicated setup or local installations.
Key Features:
- Real-time CPU temp tracking
- Custom alerts via email/SMS
- Historical reports & trend analysis
- Supports Windows, Linux, and major vendors
- Energy usage insights for overworked systems
- Visual dashboards for CPU, disk, and memory
Why do we recommend it?
We’ve actively tested Site24x7 in real production environments and were impressed to see how consistently it performs. First, the setup is fast—around 30 minutes end-to-end—and then, the monitoring feels impressively accurate. In one instance, it helped us detect thermal spikes on a cloud VM before they affected end-user experience. The dashboards are also packed with metrics (you can see the screenshot above), but still readable, and alerting is timely.
But where Site24x7 really shines is scale: you can monitor remote endpoints, cloud assets, and edge devices—all from a single SaaS dashboard. So, that means you don’t need to manage many plugins or toolchains. The CPU temperature feature is just one part of an impressive and broad toolset.
Who is it recommended for?
We recommend Site24x7 for IT teams currently managing hybrid or cloud-native environments. We also think it is ideal for MSPs looking for multi-client dashboards with built-in alerting. And that is not all, Site24x7 is also a great fit for sysadmins tracking CPU temps, disk, memory usage, and uptime across distributed endpoints, and for DevOps teams aiming to catch issues early on. When it comes to the size of business, the small to mid-sized will love its enterprise-grade visibility, which comes without the usual complexity.
Pros:
- Comprehensive monitoring suite (servers, sites, apps, networks, users)
- Accurate, real-time CPU temperature data with customizable alerts
- Cloud-based (no local infrastructure required)
- Supports hybrid and multi-vendor environments
Cons:
- Alerting can get noisy without fine-tuning
Site24x7 supports Windows and Linux. The software is offered on a subscription basis with pricing based on the services that you are monitoring. The licensing may require careful review depending on feature usage. The pricing starts at $35/month for the Pro plan (40 monitors, 500K RUM pageviews) and $89/month for the Classic plan (100 monitors, 1M pageviews). The Enterprise plan starts at $225/month with custom quotes for large-scale setups. All plans include a 30-day fully featured trial and support real-time CPU temperature monitoring.
3. HWMonitor
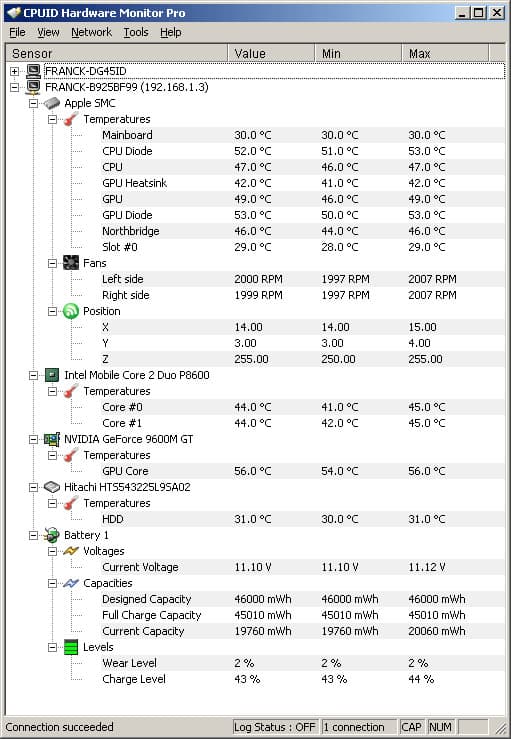
HWMonitor is not just a CPU temperature monitor but a complete hardware monitor. It can read voltages, temperatures, and fans sensors of a system. So, you will be able to monitor the CPU and other sensors on your PC. Two of the most popular sensor chip ITE IT87 series, Winbond ICs, are supported by HWMonitor. It means most of the systems using these sensor chips will send a correct reading to the monitoring system. On top of it, HWMonitor can read new generation CPUs on-die core thermal sensors. In addition, it can read hard drive temperature using SMART video card GPU temperature. The HWMonitor is a free tool with an option to upgrade for a Pro subscription.
Key Features:
- Voltage tracker
- CPU temperatures
- Battery statuses
- Fan activity
Pros:
- Freeware, with paid options for remote monitoring
- Open-source transparent project
- A great option for home labs and smaller networks
- Available for both Linux and Windows
Cons:
- Interface isn’t customizable making it difficult to track only the metrics you want
- Could use better visualization features when reporting over longer periods of time
You might ask what the additional features HWMonitor adds are. Those features are Remote Monitoring, Graph Generator, and improved Interface. Remote monitoring allows monitoring as many distant PCs as you want to monitor using a secured TCP/IP connection. In comparison, Graph Generator lets you save all the monitoring data and generate logging graphs in bitmap files. The HWMonitor Pro comes in two different plans: Standard and Extended. The Standard plan is for 19.95 Euro whereas the Extended Plan will cost you 34.95 Euro. There is also a 30-day free trial to test things first and then continue with the subscription.
4. CoreTemp
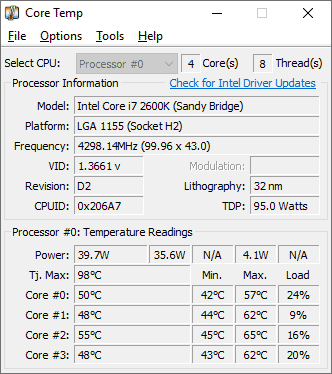
CoreTemp monitors CPU temperature in a very easy-to-use manner. It displays the temperature of every core of each processor in a system giving you accurate CPU cores. In addition, you can see CPU temperature fluctuations in real-time. The CoreTemp is motherboard agnostic. Although the CoreTemp user interface is straightforward it has a high level of customization options. It collects data from DTS (Digital Thermal Sensor). All major CPU makers Intel, AMD, or VIA, are using DTS in their CPUs. It is better than traditional onboard thermal sensors, which means the temperature data is accurate.
Key Features:
- Runs on Windows
- Brand and model detection
- Core temperature
Why do we recommend it?
CoreTemp is a free CPU temperature monitor for Windows. The package displays details about the processor and will report on temperature per core. The tool takes readings from the Digital Thermal Sensor that is embedded in processors from Intel, AMD, VIA, and some other brands.
Who is it recommended for?
This is a free tool, which is great, but it only reports on the computer that hosts it and it is only available for Windows. The utility displays results live in an application on the screen of the host, so it can’t record activity or be accessed across a network. So, this is suitable for use by small businesses.
Pros:
- Supports an Android and iPhone app for remote monitoring
- Is completely free for personal use
- Barebones interface makes the tool very lightweight and resources conservative
Cons:
- Relies on a plugin for additional functionality for visuals, would like to see this built into the product itself
CoreTemp provides a platform for Plugins allowing developers to add new features and extend the functionality. The operating system supported by CoreTemp is Microsoft Windows 10, 8, 7, Vista, XP. It also has support for the 2003 Server, 2008 Server, 2012 Server, and 2016 Server. In terms of pricing, CoreTemp is free for end-users but businesses need to purchase the commercial license. The price of one license is $25, and it will get lower when purchased in bulk. Overall I would say CoreTemp is a solid CPU monitoring software not just for individuals but businesses as well.
5. Open Hardware Monitor
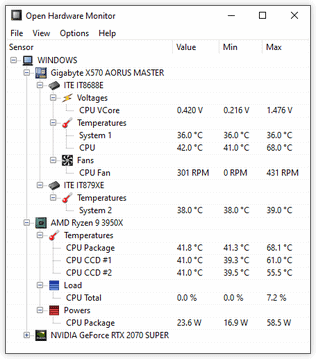
Next up on our list is Open Hardware Monitor. It is a free, open-source hardware monitoring software. You can monitor all sorts of different components of your system. This includes temperature sensors, voltages, fan speeds, load and clock speeds of a computer. Although It is free and open-source, it supports almost all the latest hardware monitoring chips found in systems. Open Hardware Monitor reads core temperature sensors of Intel and AMD processors to monitor the CPU temperature. It also supports sensors of ATI and Nvidia video cards. Not just that, but it can also display S.M.A.R.T hard drive temperature.
Key Features:
- Power supply
- Temperature
- Fan speed
Why do we recommend it?
Open Hardware Monitor is a similar tool to CoreTemp, except that it gives information on other hardware components as well as the CPU. Those other factors include fan speed and power supply statuses. The CPU temperature measurement reports per core. This is a free tool for PCs running Windows.
Who is it recommended for?
This is a good tool for home use and small businesses. Like CoreTemp, the tool provides a live readout and will only scan the computer on which it is installed. It can’t be accessed remotely or contribute a data feed to a centralized monitoring system, so it wouldn’t be suitable for mid-sized or large businesses.
Pros:
- Is a free open-source transparent project
- Can measure other metrics like fan speed, clock speed, and voltage alongside temperature readings
- Better suited for home PCs and enthusiasts
Cons:
- No management console, cannot monitor multiple machines at the same
- Not ideal for a business environment
The CPU temperature values monitored by Open Hardware Monitor can be displayed in the main window or the form of a desktop widget or system tray. Open Hardware Monitor supports both 32-bit and 64-bit Microsoft Windows 10, 8.1, 8, 7, Vista, XP, or any other x86 based Linux operating system. Interestingly it does not require installation. On the Windows operating system, it runs with .Net framework version 4.5 or above. It requires Mono with WinForms on Linux running systems. It is entirely free to use Open Hardware Monitor as it is open-source software. So, If you don’t have any budget and are looking for a capable CPU monitor, you must give it a try.
6. SolarWinds CPU Monitor
SolarWinds CPU Monitoring software tracks and graphs the load for devices in a network. It provides real-time data of critical performance metrics like uptime, errors, and CPU response time. The most exciting feature I found in the SolarWinds CPU monitor is setting warnings and alarms for network devices. The alert feature is customizable so that you can define a threshold for different CPU monitoring metrics. As soon as the threshold is crossed, the admin will receive an alert through an email or even with an SMS. This feature is groundbreaking, as there is no need to monitor the CPU manually constantly.
Key Features:
- Part of a large package of system management tools
- CPU monitoring
- Device discovery
- Endpoints and network devices
- Alerts
Why do we recommend it?
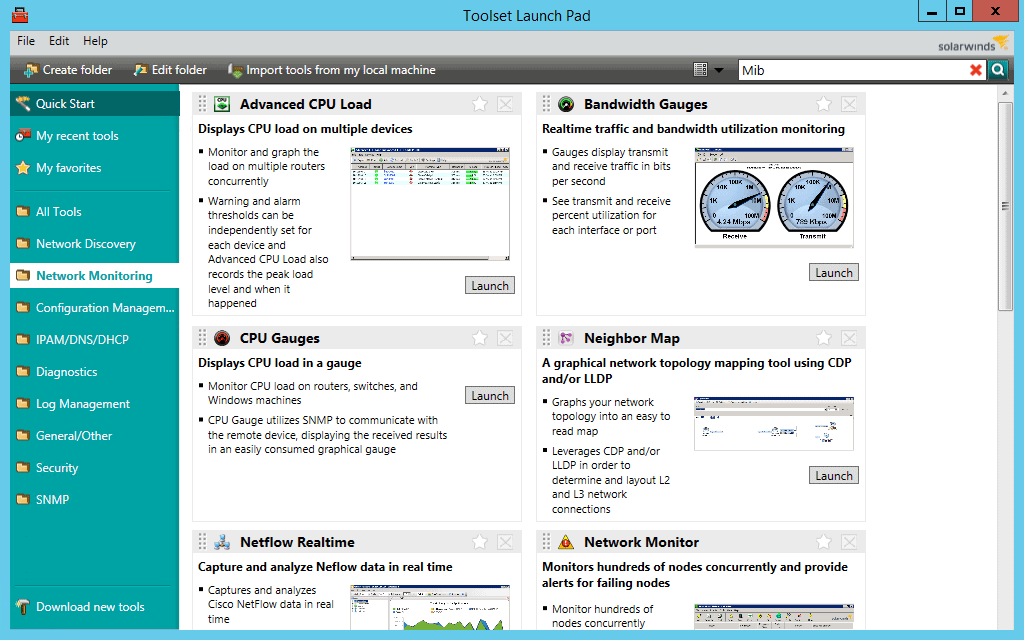
The SolarWinds CPU Monitor is part of the Engineer’s Toolset, which provides a console of useful network systems. The CPU Monitor measures the activity of routers and switches, recording the utilization of each processor’s capacity with respect to its total capabilities. Other systems in this package include device discovery and traffic handling activities.
The SolarWinds CPU monitor supports IPv6 and SNMP v3 protocol. SolarWinds CPU Monitor is part of their Engineers Toolset package. The toolset features a mighty CPU monitor along with 60 different network monitoring tools. All these tools provide a tremendous overall network monitoring experience.
Who is it recommended for?
The full Engineer’s Toolset is suitable for the network manager of a mid-sized business. You need to have knowledge of network technology in order to get the full benefit of this system so owner-managed small businesses wouldn’t be able to use the system. Large organizations would be more likely to opt for the SolarWinds Network Performance Monitor.
Pros:
- Designed with large and enterprise networks in mind
- Supports auto-discovery that builds network topology maps and inventory lists in real-time based on devices that enter the network
- Has some of the best alerting features that balance effectiveness with ease of use
- Supports both SNMP monitoring as well as packet analysis, giving you more control over monitoring than similar tools
- Uses drag and drop widgets to customize the look and feel of the dashboard
- Robust reporting system with pre-configured compliance templates
Cons:
- Designed for IT professionals, can take time to fully explore the platform
Pricing: The price of Engineers Toolset starts at $1585. It might seem a lot higher for just a CPU monitor, but it is worth considering all other tools in the package.
Download: You can try SolarWinds CPU monitor for a fully functional 14-day free trial.
7. AIDA64 Extreme
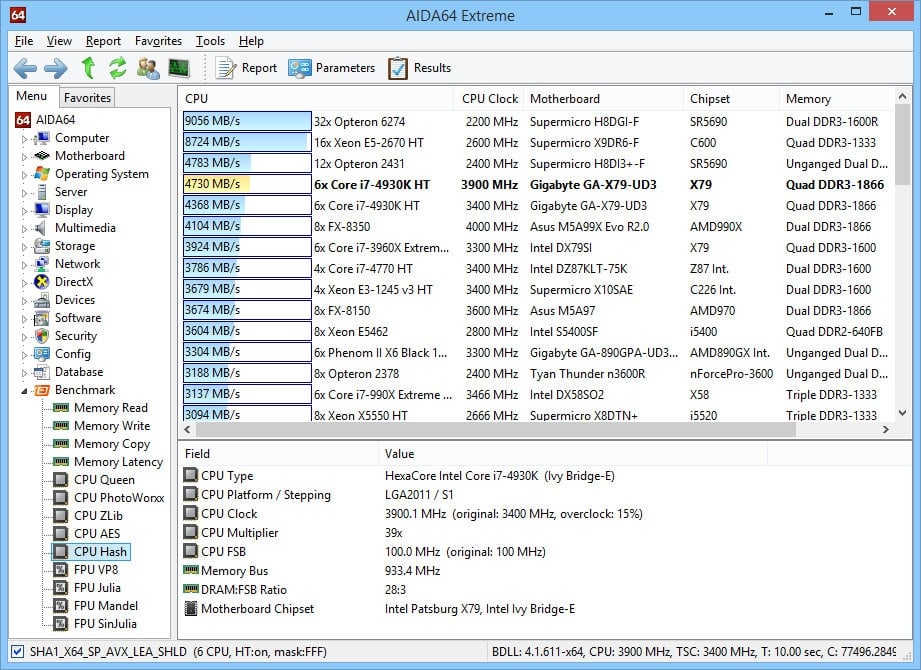
AIDA64 Extreme monitors sensors of processors in real-time to collect CPU temperature, voltage, and fan speed readings. It supports over 250 different sensor devices. The values measured by the software can be displayed on System Tray, OSD panel, in Desktop Gadget, LCD Gaming Keyboard. Moreover, it has a mighty hardware detection engine. The hardware detection engine is capable of providing in-depth information about software installed on a system. It also offers the diagnostic function to detect hardware issues to be prevented without the processor getting damaged.
Key Features:
- Processor sensor monitor
- CPU statuses
- Capacity utilization
Why do we recommend it?
AIDA64 Extreme is a rival to Open Hardware Monitor, except this is a paid tool. The software runs on Windows and Windows Server and it tracks the hardware component statuses of the device on which it is installed. This tool also includes a stress testing utility, which will drive up CPU activity to identify actual capacity versus advertised capacity.
Who is it recommended for?
This is a tool for home use or for small businesses. It offers great features but it can’t be networked, so it isn’t going to suit multi-site businesses or companies that are too large for a support technician to physically visit each endpoint.
Pros:
- Designed to detect and monitor devices at scale, good for large companies and enterprises
- Can save collected information in database format
- Simple alert system is easy to use
- Acts as a lightweight RMM with options to restart machines remotely
Cons:
- Less intuitive than leading products
- Interface could use improvements, graphs can be hard to read
Some of the notable AIDA64 Extreme features are Diagnostics, Stress testing, Software audit, Benchmarking, External display support, etc. The AIDA64 Extreme compatibility includes 32-bit and 64-bit Windows 10, 8.1, 8, 7, Vista, XP operating systems. When it comes to servers, it has support for Windows Server 2003, 2008, 2012, 2016, and 2019. Despite being so feature-packed, it just takes 80MB of storage space to get installed. Coming to the pricing, AIDA64 Extreme price starts from $49.95 for 3 PCs. It will get lower if you are purchasing the license for a higher number of PCs.
8. HWiNFO
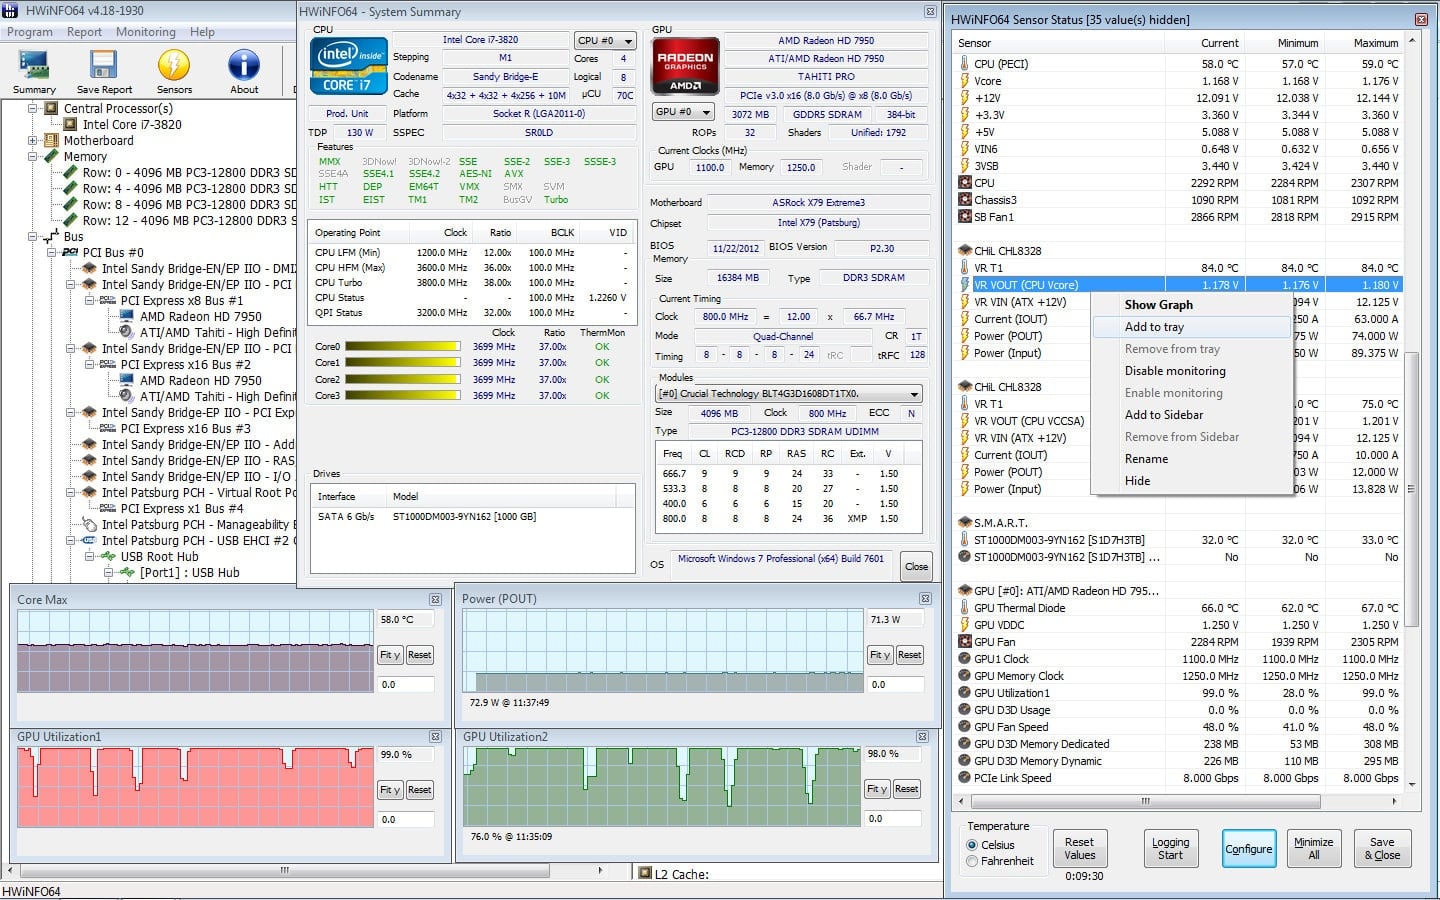
HwiNFO provides hardware analysis monitoring and reporting for Windows and DOS operating systems. It offers in-depth information on all hardware components of a system in real-time. All the data becomes useful for the detection of overload, performance loss, overloading. The interface of HWinfo is customizable, with lots of different options to play with. HWiNFO is supported on Microsoft DOS, Windows 1995 to 10, and i386 – Xeon Platinum platforms.
Key Features:
- Data and graphs
- Live statuses
- Runs on Windows
Why do we recommend it?
HWiNFO monitors processors, graphics cards, and chipsets. The software runs on Windows and collects data on its host. The tool will display statuses, which include CPU temperature, in a console on the screen of the hosting computer. A library of add-ons enables the tool to send monitoring data streams to centralized system monitoring packages.
Who is it recommended for?
This system is suitable for businesses of any size. It can be used for home PCs or small business computers with its on-device display. Larger businesses with centralized support teams will activate an add-on to get data fed from all instances into a system monitoring package.
Pros:
- Extremely detailed, includes metrics not found in other tools like cache sizes, ratio, clocks speed per core, and timing information
- Can track other metrics such as GPU and disk utilization
- Is fully customizable
- Offers built-in visualizations
Cons:
- Lack of proactive features like robust alerting options and inventory management
The Tools offered by HWiNFO are available for different systems and versions. All the versions are free to use in both personal and commercial environments; no license is required. However, only using HWiNFO64 for commercial use requires a license for HWiNFO64 Pro. The price of HWiNFO64 Pro is $25.
9. SpeedFan
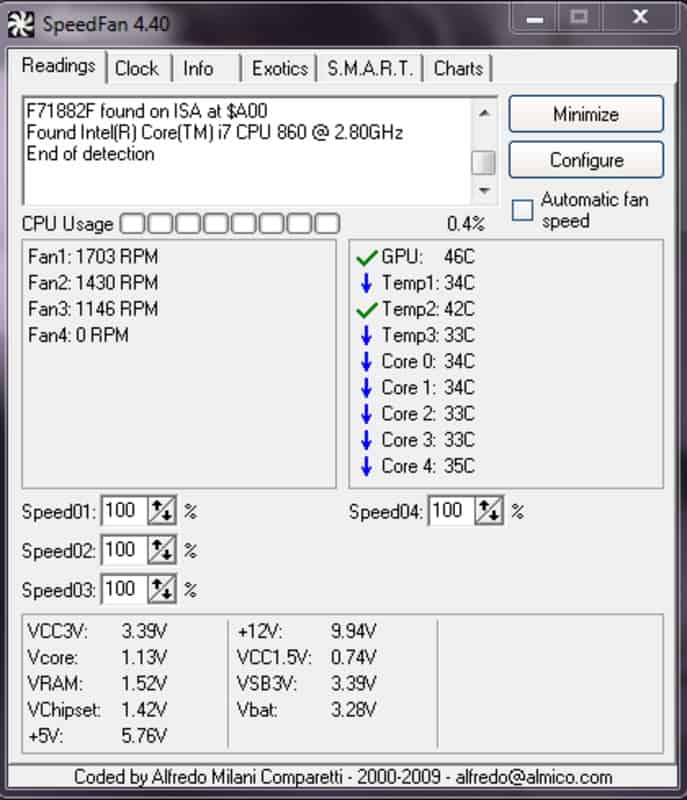
SpeedFan is a CPU monitoring tool that monitors CPU temperature, fan speed, and voltage in a computer processor. It can also access S.M.A.R.T info to show the temperature of the hard disk. It even supports SCSI disks. Not just that, SpeedFan is capable of changing FSB on some hardware. SpeedFan tool accesses the DTS (Digital Temperature Sensors) of a processor to measure the temperature of various components. After a measure, it changes the fan speed as per need, reducing the noise coming from fans.
Key Features:
- Power supply
- CPU temperature
- Fan speed
Why do we recommend it?
SpeedFan gathers information on CPU, core, motherboard, and graphics card temperatures as well as power supply voltages and fan speed. The tool also presents details of the CPU in the device. This is an on-device package for Windows and you can use it free of charge..
Who is it recommended for?
This tool is good for home use or for small businesses. The system isn’t able to send data to a central monitoring tool and it can’t be accessed remotely, so it isn’t really suitable for a mid-sized or large organization that administers many endpoints from a central office. The software is available for Windows.
Pros:
- Simple installation that begins pulling metrics immediately
- Built for individual machine monitoring with a simple interface
- Collects S.M.A.R.T data as well as detailed metrics about the status of your machine’s fans
- Helps users correlate fans speed with temperature
Cons:
- Not for larger networks
- Lacks long-term monitoring features
- Reporting features could use improvement
In terms of support, SpeedFan has support for Windows 10, 8.1, 8, 7, 2008, Vista, XP, 2003, 2002, NT, ME, 9x, and Windows Server 2003, 2008, 2012. It works with both 32-bit and 64-bit systems. SpeedFan is free, so you can download it and start using it right away.
10. NZXT CAM
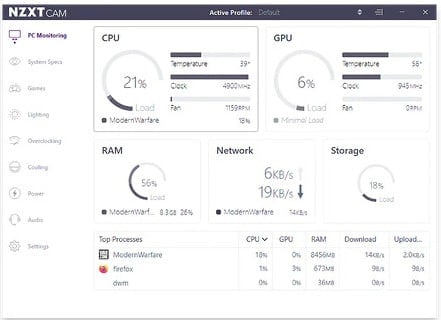
NZXT CAM is a gaming PC monitoring app. One can monitor performance, temperatures, and devices by using it. The NZXT CAM can track processor load and bandwidth consumption. It can also monitor which application is using any of the parts of your computer. As mentioned, it is centered on gaming PCs. It can be used to track temperature, FPS, and bandwidth while playing games.
Key Features:
- Sophisticated interface
- Always on
- Also monitors GPU
Why do we recommend it?
NZXT CAM is a very sophisticated onboard system monitoring tool that also provides configuration and device management functions. The console for this tool is well designed and you can get it to schedule changes to device settings, such as screen brightness, for different times of the day. Its readout includes CPU and GPU temperature.
Who is it recommended for?
NZXT manufactures components for gaming machines and can assemble an entire customized PC for a customer. The NZXT CAM utility is free and anyone can download it from the NZXT website. This is a useful utility for home use and for small businesses. The software runs on Windows.
Pros:
- Great for monitoring temperature, fans speed, voltage, and other hardware metrics
- Simple yet highly informative dashboard
- Shows top processes that could be contributing to higher CPU usage/temperature
Cons:
- Not ideal for automated monitoring
Another notable feature is GameSync, which sets lights and fans to change according to the game’s colors. Then there is intelligent scheduling which lets you customize lighting and fans several times a day. So, If you are a gamer and looking to monitor the temperature of your CPU, then you must try NZXT Cam. It is available for free to download.
11. RealTemp
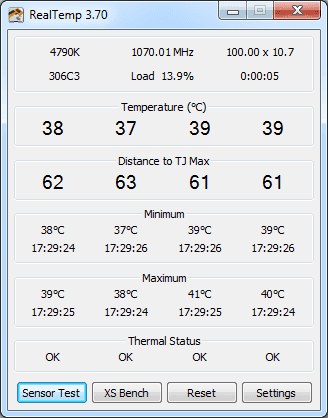
RealTemp is a CPU monitor application designed mainly for Intel single Core, Dual Core, and Core i7 processors. These processors feature a digital thermal sensor (DTS) on all of their cores. TJMax is the optimal temperature of a CPU. When a CPU heats, the distance of TJMax decreases. If it reaches zero, the system will start to throttle, and you will slow down. RealTemp warns you when the distance of TJMax starts decreasing due to the high temperature of the CPU, so can try fixes to stop it.
Key Features:
- Temperature per core
- Identifies optimum temperature
- Clock speed
Why do we recommend it?
RealTemp accesses the digital thermal sensor on a PC and displays the current CPU core temperature. The display also shows some basic capacity details about the computer that hosts it but other than that panel, the utility only monitors temperature. This is a free tool that runs on Windows.
Who is it recommended for?
This is a nice free tool for home use or for a small business that just has one or two PCs to monitor. The system doesn’t provide a feed for centralized monitoring tools and it can’t be managed remotely, so it isn’t suitable for businesses that operate central IT asset management.
Pros:
- Simple lightweight tools
- Offers simple logs and reports
- Supports simple alarms for temperature thresholds
- Better suited for smaller networks
Cons:
- Interface could use improvement
It can read temperature information from all Intel Core processors that are core-based. Do remember Pentium 4 processors are not supported by it. RealTemp can calibrate the temperature for each core of the CPU. It is based on data gathered by using a Fluke 62 IR Thermometer. There are no installation or registry modifications required to use RealTemp. It supports 32-bit and 64-bit Windows 10, 8, 7, Vista, XP, and 2000. RealTemp is an entirely free app, so you can directly download and start using it.
Conclusion
CPU Temperature Monitor can always be handy to be aware of the temperature of all PCs and Servers in a network. With so many options available, it gets confusing to pick the right one. Above is the list of the best CPU temperature monitors. You can go with any of them. All of them are handpicked and tested by our experts. Which CPU monitor will you be picking from our list? Do let us know in the comments.
CPU Temperature Monitors FAQs
Are CPU Temp Monitors Accurate?
Not 100%, but accurate to a reasonable extent. Most of the CPU temp monitors use DTS to collect data from a processor. The Digital Thermal Processors provide accurate data in comparison to the older thermal processors. Therefore, one can trust the best CPU temperature monitors included in our list.
How do I find the best CPU temp?
You have already found a resource to find the best CPU temperature. Here we have listed the best CPU temperature monitoring tools available in the market. Go through the list and pick one of the software to measure the temperature of your CPU.
How do I monitor my CPU temp?
You can monitor your CPU temperature by using a CPU monitoring tool. These tools are small pieces of software that you can install on your PC and server. Once installed, the CPU monitoring tools collect accurate data through various sensors and show them in a graphical interface.
How to monitor CPU Temp and Fan speed?
The best way to monitor CPU Temp and Fan speed are by using a CPU temperature monitor. There are many free open source applications available. We have listed all of them in this article. Download any one of the tools and start monitoring CPU temp and fan speed.