Knowing the health of your network devices is important and is a good first step when monitoring for network health.
However, sometimes that is not enough and you need to take your monitoring to the next level and monitor the actual traffic flowing through the infrastructure.
Analyzing flow data opens up an entirely new level of visibility that can help you maintain the health of your network and troubleshoot problems.
Monitoring network flow data allows you to:
- Identify applications consuming the most bandwidth on your network
- Verify QoS marking of traffic flows to ensure your QoS policies are correctly tagging the proper traffic.
- Confirm that your QoS queues are sized properly based on the actual amount of data hitting each queue.
- Easily and quickly identify important or troublesome traffic flows traversing the network.
Let’s take a quick look at some of the tools available for analyzing network flow data throughout a network.
SolarWinds Network Bandwidth Analyzer Pack – FREE TRIAL
SolarWinds Bandwidth Analyzer Pack (BAP) is a bundle of SolarWinds Network Performance Monitor and SolarWinds NetFlow Traffic Analyzer.
BAP provides a married experience of—a full SNMP monitoring suite, coupled with network flow analysis.
NTA is capable of accepting different flow types (j-flow, s-flow, IPFIX, Netflow v5/9), making it a more effective product for environments that are running a mixture of vendor devices.
NTA also provides a fair amount of additional ‘nice to have’ features,. including the ability to capture CBQoS information from your routers.
When enabled, SolarWinds will query policy-map/service-policy information from routers and automatically show the utilization of different QoS queues. Statistics can also be calculated from NBAR2 data.
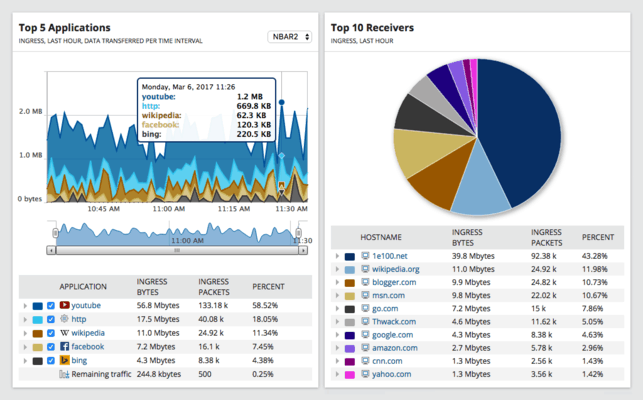
NBAR data is capable of identifying 1000s of different applications .
Gone are the days of identifying applications by simple port identification.
SolarWinds will even notify you if a device is capable of sending NBAR-related information but is not configured to.
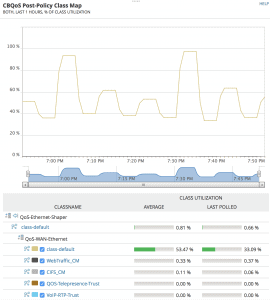
CBQoS statistics in NTA, from SolarWinds demo website.
Like other SolarWinds products, the true value comes from the out of the box dashboards and the customizability of those dashboards and charts.
The NTA dashboards offer the capability to search for specific ingress or egress network flows.
The individual flow graphs can also be customized by editing the number of entries that may appear in the resource.
You can also quickly remove flow data from specific resourcesby checking and unchecking boxes.
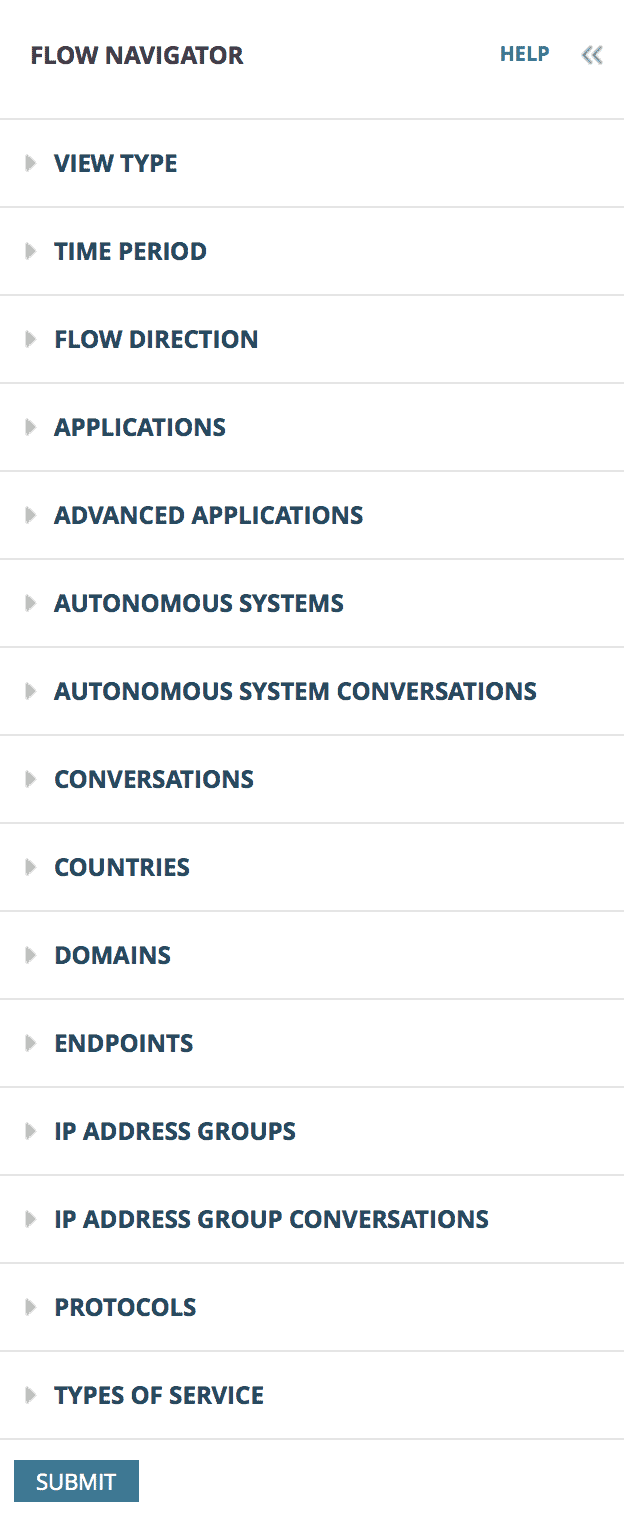
Filtering options within NTA to quickly zero in on the flows you are interested in.
The final and probably the most important feature I want to mention about SolarWinds NTA, is its integration with the Orion platform.
NPM and NTA allow you to use PerfStack to compare multiple data types on a single dashboard for easy correlation and performance analysis.
NETSCOUT TruView
NETSCOUT’s TruView™ product originally came from the Fluke merger.
Same great product under a different umbrella.
TruView offers some basic network monitoring capabilities, but really shines as an APM and flow analysis tool.
TruView queries devices via SNMP to gather interface statistics which then get tied together with flow information from that same device.
While TruView is not your tradition network monitoring platform, its capabilities at identifying traffic flows and calculating network, server, and application response times outweighs the lack of typical performance monitoring.
This information is identified by receiving the raw SPAN data packets from the equipment and calculating timestamp information of different packets.
Being able to identify bottlenecks at the application layer is a more direct approach to identifying slow network issues because it focuses on the source of the delay.
This allows allows you to drill down to the individual application servers and services.
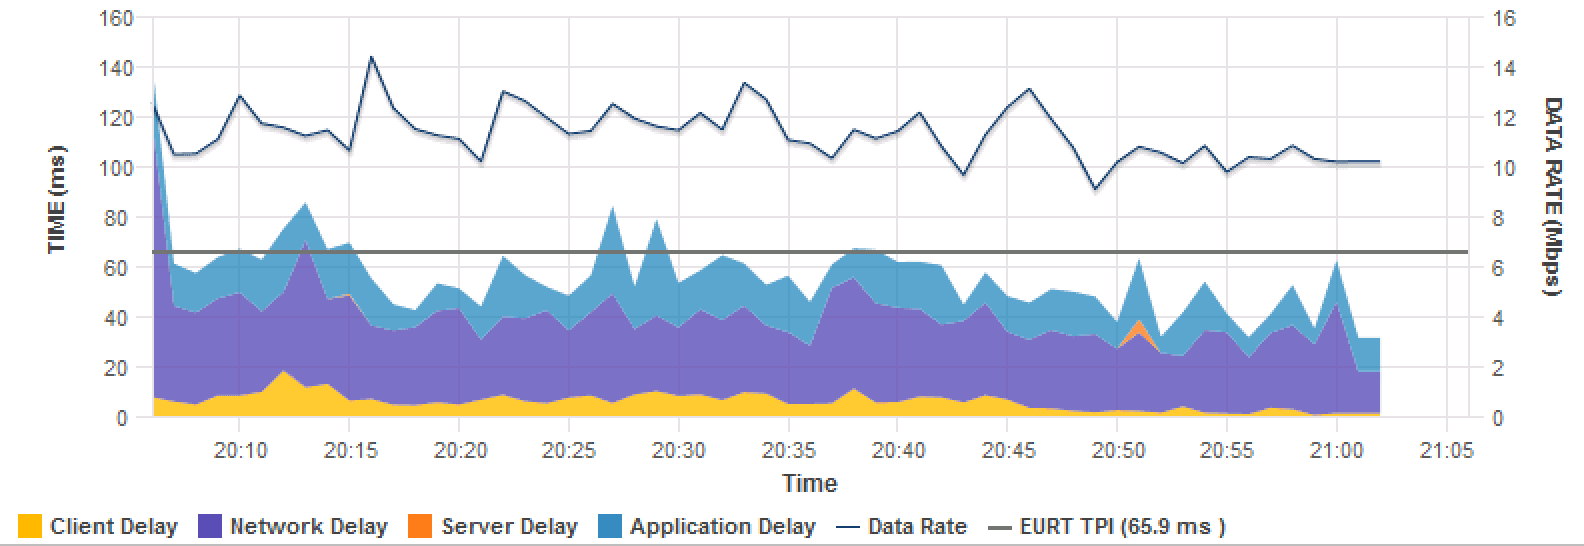
Network, Application, Server delay stats
Plixer Scrutinizer
Scrutinizer is the netflow application for all your netflow needs.
When it comes to analyzing netflow data, Plixer offers deployment models that cover a wide range of network styles.
This application can be deployed quickly and easily in a virtualized settings, you can acquire dedicated hardware appliances for larger environments, or use a cloud deployable model, so regardless of your sizing structure or design, Plixer has you covered.
Scrutinizer is a flow analysis tool that will accept many different types of flow data, including from VMware.
This allowsflows to be traced into the virtualization layer, which can be presented in a map of the flow in question.
Along with the visibility into network level troubleshooting, Scrutinizer also offers the flexibility the be part of your security infrastructure, working in tandem with other systems to present the flow data for further processing.
Scrutinizer can increase its value to the organization by serving different roles within your monitoring environment..
Steve’s Verdict
With so many powerful tools at our disposal it’s hard to say that one tool is better than the other.
The best tool for the job is the tool that addresses the problem you are attempting to solve while complimenting other monitoring tools in your environment.
When it comes to deciding on implementing another type of monitoring solution, the trickiest questions may be:
1) Will this product solve my problem and improve my existing monitoring capabilities?
2) Can this tie in with my existing management suites to provide a single pane of glass and ease the burden of having to manage my existing network management suite?