WAN Monitoring is probably one of the most overlooked management tasks by the Network Ops teams in Small-businesses.
With the rise of more Affordable business class Internet connections and the necessity for backup WAN connections, monitoring Uptime, Availability, Utilization and Latency more important than ever!
Here is our list of the best WAN monitoring tools:
- ManageEngine OpManager – EDITOR’S CHOICE This software package is available for on-premises installation or as a service on cloud platforms, it scans networks and its top edition covers WANs. Run on Windows Server, Linux, AWS, or Azure. Get a 30-day free trial.
- ManageEngine Desktop Central – FREE TRIAL ManageEngine Desktop Central excels in WAN monitoring, providing robust tools essential for overseeing wide area networks. Its comprehensive monitoring capabilities and real-time alerts make it ideal for ensuring optimal performance and reliability of WAN connections across various organizational settings. Start a 30-day free trial.
- Site24x7 – FREE TRIAL As part of its cloud platform, Site24x7 includes a WAN monitoring tool that gives IT teams live visibility into bandwidth usage, latency, and packet loss. That visibility helps maintain network reliability, improve performance, and identify WAN connectivity problems quickly. Get a 30-day free trial.
- SolarWinds Network Performance Monitor This on-premises software package provides site monitoring through discovery, inventory management, mapping, and status scanning. Install a copy on each site to get WAN monitoring. Runs on Windows Server.
Techniques for Monitoring WAN Links
Most business organizations use WAN links to interconnect local area networks (LANs) at geographically dispersed sites.
Over the years, as business organizations continue to grow both nationally and globally, the demand for WAN links has steadily increased.
Call centers, for example, have moved off-shore; distributed computing has replaced large regional data centers; sales offices have expanded to new locations.
As WAN links become integral to the day-to-day operations of the business organizations, the availability and reliability of WAN links has a direct, highly visible impact on business operations, employee productivity, and customer satisfaction.
Cost vs Business Impact
Monitoring WAN links for availability and reliability is essential: business organizations absolutely require continuous uptime, fast response times, and minimal transmission errors.
But the cost of WAN links is also a factor.
A T1 line, which used to be the most common type of WAN link, provides 1.5 megabits-per-second (Mbps) of bandwidth at an average cost of $600 a month.
A T3 line, which offers 45 Mbps of bandwidth, can cost $15,000 a month.
Major ISPs, such as CenturyLink, Comcast, Verizon and even Google Fiber has started to provide 1GB links to customers for a fraction of the cost that we used to pay for a T1 or t3!
Monitoring WAN link utilization can help ensure the business organization is receiving optimal network performance without over investing in network infrastructure.
Due to the cost of leasing a WAN link, it’s often difficult to justify an additional T1 or T3 line unless an existing link is consistently running at 80% utilization or higher.
In theory, the link can run at 100% utilization, which may sound a bit like “getting the most bang for the buck,” but utilization rates fluctuate constantly depending on changes in network traffic.
For example, utilization may be high in the morning when people come to work and read their email or later in the afternoon when customers scramble to submit their orders before going home for the day. And sometimes the network simply gets hit with a lot of traffic.
The point is, when monitoring link utilization, it’s important to allow for “spikes” in network traffic.
Otherwise, if a link is running at 95% utilization, and network traffic spikes, the interface on the WAN router may become overwhelmed and start to drop packets or experience other sub-optimal behavior.
Business application users and customers, in turn, will notice significantly reduced response times and throughput. So it’s crucial to monitor WAN links not only for availability and reliability, but for utilization as well to determine a nominal utilization rate that can withstand spikes without impacting the business organization.
Also, should high utilization rates begin to impact business efficiency, collecting historical data on utilization rates can underscore a business justification for an adding a new WAN link.
Key Metrics
When monitoring WAN links, the three key metrics to consider are:
- Availability The “up” or “down” status of a router interface over time (also referred to as “uptime”). High availability (99-100%) indicates the WAN link is fully available to business users. Low availability (less than 95%) may indicate a persistent problem with the router or WAN link.
- Utilization The percent of data throughput relative to the maximum capacity of the router interface. Ideally, interface utilization should not exceed 70% or 80%. If utilization is consistently running above 90%, business users may experience reduced performance. Low utilization, on the other hand, indicates the interface is operating well below capacity.
- Latency The time it takes in milliseconds for a data packet to travel across the WAN link. High latency means data travels more slowly across the network, which can affect business users. Typically, high latency is caused by network congestion over the WAN link.
WAN Monitoring Tools & Software
There are a number of simple, easy-to-use tools for monitoring WAN links.
As most network managers know, the ping command on a Windows or UNIX computer measures the “round trip” latency across a WAN link by “pinging” a device or computer at the far end of the link.
For example, pinging a computer on the East coast from a computer on the West coast shows the round trip latency for the link, point-to-point, averages 117 milliseconds.
For more detail, the trace route command lists the physical routers that form the WAN link and the number of milliseconds required for each “hop” between routers.
Because most network devices are SNMP-enabled, an SNMP monitoring tool can be used to measure the availability and utilization of the router interfaces that host the WAN link.
For instance, SNMP OID Tracker, a free desktop SNMP tool, can graphically monitor any SNMP MIB-2 object.
Monitoring the ifOperStatus (operational status) object shows the availability or up/down status of the interface, and the ifInOctets (octets in) and ifOutOctets (octets out) objects can be used in conjunction with the ifSpeed (interface speed) object to calculate interface utilization.
Our methodology for selecting a WAN monitoring tool
We reviewed the market for WAN monitoring systems that keep track of internet links between sites and assessed tools based on the following criteria:
- Network discovery and inventory management per site
- Connection tracking between sites
- Network mapping that can extend across sites
- Connection testing that can be set to run continuously
- Route testing utilities
- A free trial or a demo option for a risk-free assessment opportunity
- Value for money from a tool that offers an appropriate price for the services on offer
1. ManageEngine OpManager – FREE TRIAL
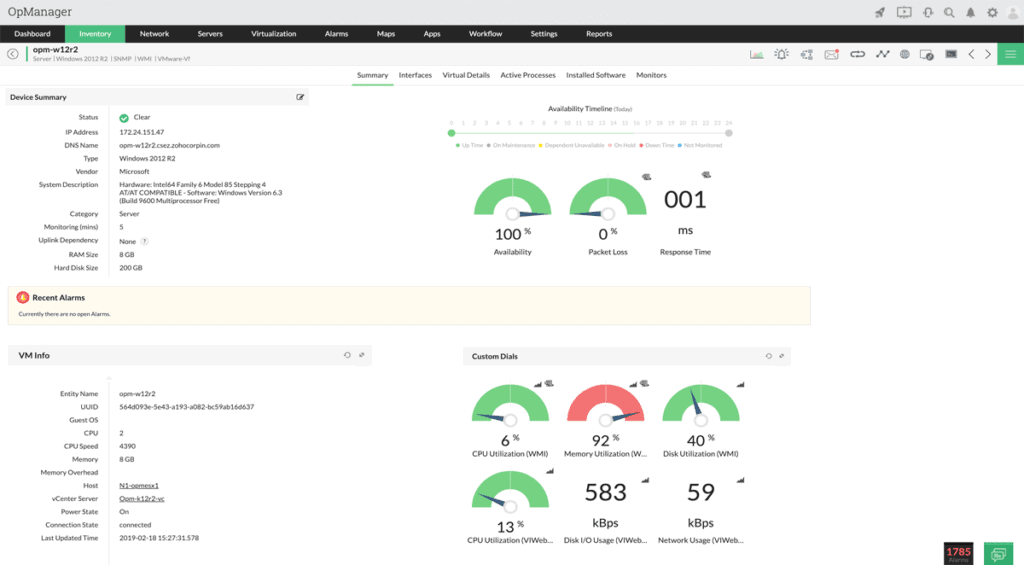
ManageEngine OpManager is an All-around great product that has robust probing features that will ensure your wan links are being watched over very closely!
Key Features:
- Firewall Log analysis
- IP Address management
- Switchport management
- NetFlow bandwidth management
- Configuration Management Capabilities & Much more!
Why do we recommend it?
ManageEngine OpManager is a similar system to the SolarWinds Network Performance Manager because it uses SNMP to poll network devices and endpoints for status reports. The tool also creates a network inventory and topology map from the information that the SNMP responses provide. The top edition of this package will track statuses on WANs
Who is it recommended for?
ManageEngine provides a Free edition but that is limited to monitoring three devices. There are paid plans for LANs and WANs. ManageEngine also produces a version for managed service providers, called OpManager MSP. The OpManager software will run on Windows server or Linux and it is also available as a service on AWS and Azure.
Pros:
- Can be installed on a cloud platform: AWS or Azure
- Downloadable software for Windows Server or Linux
- Automated status checking with alerts
- Constant connection testing between sites
Cons:
- There is a Free edition but it only covers three devices
Start by downloading the 30-day free trial.
EDITOR'S CHOICE
ManageEngine OpManager is our top choice for WAN link monitoring, providing a unified approach to tracking and managing WAN performance across distributed environments. It supports teams that need to maintain high availability and reduce downtime for critical applications, while offering clear visibility into network behaviour without added complexity. The platform monitors key WAN metrics such as bandwidth utilization, latency, and packet loss, helping teams identify congestion, degradation, or other performance issues before they impact users. Real-time insights make it easier to respond quickly when conditions change. SNMP-based monitoring enables integration with a wide range of networking equipment, including routers, switches, and firewalls, making it suitable for heterogeneous environments. Alongside live monitoring, OpManager provides historical reports and trend analysis to support capacity planning and long-term troubleshooting. Its configurable alerting system ensures that teams are notified promptly when WAN links experience performance issues or outages, supporting faster response and more effective management of network stability.
Download: Get a 30-day free trial
Official Site: https://www.manageengine.com/network-monitoring/download.html
OS: Windows Server, Linux, AWS, and Azure
2. ManageEngine Desktop Central – FREE TRIAL
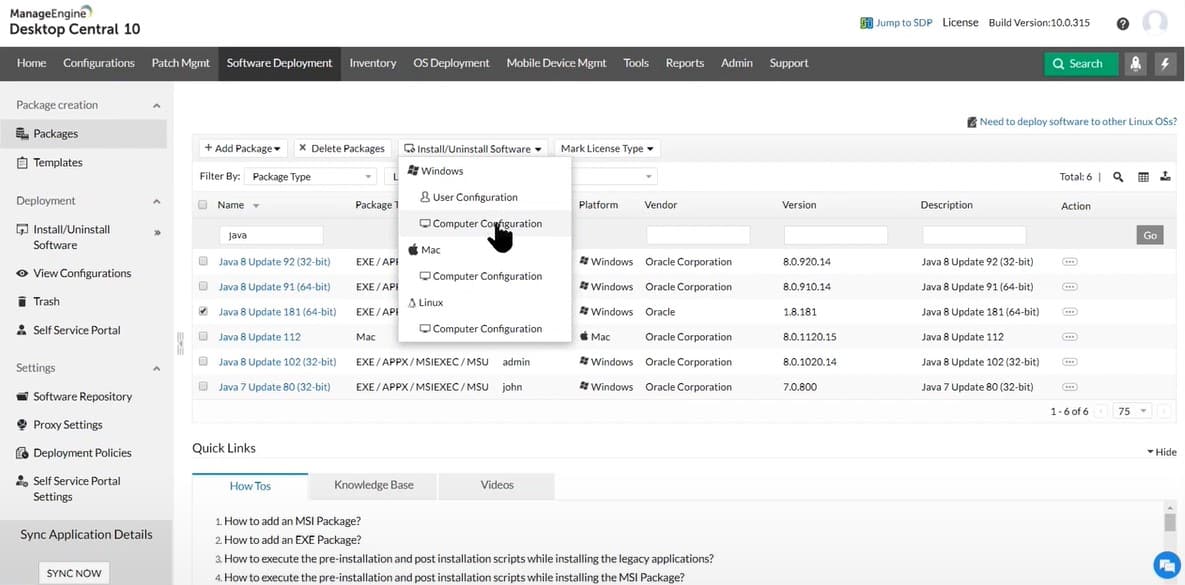
ManageEngine Desktop Central excels with its comprehensive WAN monitoring capabilities, making it an ideal solution for overseeing wide area networks effectively.
Key Features:
- WAN Monitoring: Robust tools to ensure the performance and health of WAN connections.
- Traffic Analysis: Detailed insights into WAN traffic to optimize data flow and troubleshoot issues.
- Real-time Alerts: Immediate notifications for any disruptions or performance degradations in the WAN.
- Bandwidth Management: Tools to analyze and manage bandwidth usage across multiple WAN links.
- Centralized Control: Unified management console for monitoring and managing WAN infrastructure from a single point.
Why do we recommend it?
Desktop Central’s WAN monitoring tools are specifically designed to maintain oversight on wide area network health, ensuring continuous operational performance. Its ability to provide real-time data and alerts helps administrators quickly respond to issues, minimizing downtime.
Who is it recommended for?
This tool is particularly valuable for network administrators and IT managers who need to maintain optimal performance and reliability of their organization’s WAN infrastructure. It is suitable for businesses of all sizes that depend on stable and efficient network connections between distributed locations.
Pros:
- Comprehensive WAN Monitoring: Enables detailed oversight of wide area networks, ensuring high availability and performance
- Proactive Alerts: Immediate notifications help quickly address potential disruptions
- Efficient Bandwidth Management: Optimizes bandwidth use, preventing bottlenecks and enhancing network performance
- Centralized Network Management: Simplifies the control and monitoring of WAN links from a single dashboard
Cons:
- Complex Setup: Initial deployment and configuration can be intricate, requiring technical expertise
- Limited Free Capabilities: While there is a free version, it is restricted in terms of the number of devices it can monitor
Start by downloading the 30-day free trial.
3. Site24x7 – FREE TRIAL
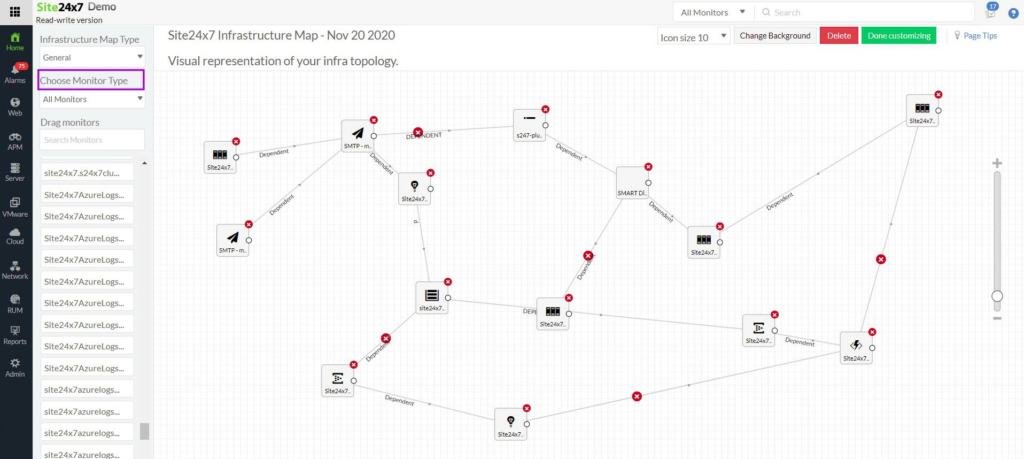
With a local agent installed, Site24x7 can monitor networks in any location. The service can bring multiple networks together under a single account and also follow the performance of the internet links that connect them. That scope makes it a practical option for WAN monitoring.
Key Features:
- Real-time monitoring
- Round-trip time (RTT) monitoring
- Automated alerts
- Customizable dashboards
- Cisco IP SLA integration
Why do we recommend it?
We recommend Site24x7 for WAN monitoring because it combines broad monitoring coverage with live performance visibility and proactive alerting. That mix helps IT teams detect issues efficiently, resolve them faster, keep WAN performance on track, and reduce downtime.
Who is it recommended for?
This service is aimed at IT teams, network administrators, and system engineers responsible for large WAN environments. It is especially useful for businesses operating distributed networks that need real-time monitoring, troubleshooting, and WAN performance optimization across multiple sites.
Pros:
- Network discovery, documents and maps all devices at each site
- Troubleshooting tools for connection testing
- Cloud-based system
- Also monitors endpoints and applications
Cons:
- No on-premises option
Assess Site24x7 by accessing a 30-day free trial.
4. SolarWinds Network Performance Monitor (NPM) – FREE TRIAL
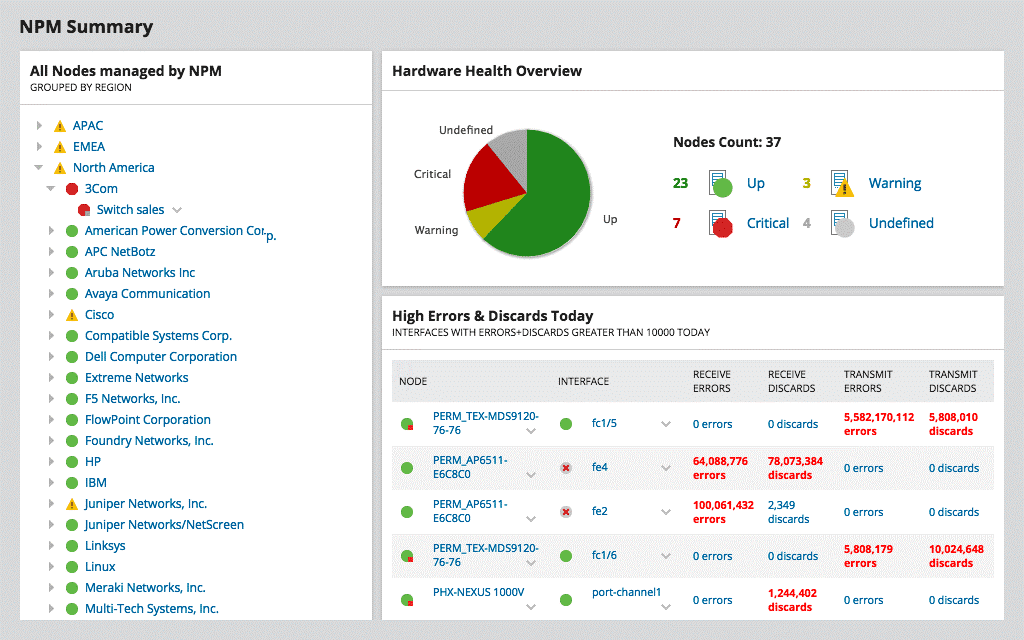
SolarWinds NPM Summary
Using basic, low-cost “point” tools has its advantages, but an integrated network management solution such as SolarWinds Network Performance Monitor provides a single, robust approach to managing networks.
Key Features:
- Network discovery
- System documentation
- Connection testing
- Route analysis
- On-premises software
Why do we recommend it?
SolarWinds Network Performance Monitor monitors a single LAN but it can be extended to monitor multiple sites and check on the performance of the internet connections between them. This system automatically discovers all network devices, creates an inventory, and creates a topology map. This software runs on Windows Server.
With SolarWinds NPM, you can easily monitor the availability, utilization, and latency (ping response time) of the WAN link from a single view.
Moreover, you can set latency, utilization, and availability thresholds that automatically trigger alarms, email notifications, and other alerts whenever the respective metric exceeds the threshold value, allowing you to take immediate action before business users are affected.
Who is it recommended for?
This is one of the biggest-selling network monitoring tools in the world and it appeals to mid-sized and large organizations. It is able to constantly check on network device statuses with the SNMP system and it will also make constant checks on internet connections. The package includes network testing tools, such as Ping and Traceroute.
Pros:
- Software for Windows Server
- Automated setup to document each site
- Route visualizations in NetPath
- Constant device availability and status polling
- Alerts for device component problems
Cons:
- Requires a copy of the monitoring software to be installed on each site
Start with a 30-day free trial.
Conclusion
In today’s world, the availability and reliability of your organization’s WAN links have a direct impact on productivity, customer satisfaction, and profitability.
By deploying an integrated network management solution such as one from above, you can proactively monitor all aspects of your network and deliver the performance your business organization depends on.
WAN Monitoring FAQs
What types of WAN connections can be monitored?
WAN monitoring can be performed on various types of WAN connections, including leased lines, MPLS, VPN, broadband, and cellular.
What are some common WAN performance metrics to monitor?
Common WAN performance metrics to monitor include latency, packet loss, jitter, bandwidth utilization, and application response time.
What are some common WAN security metrics to monitor?
Common WAN security metrics to monitor include unauthorized access attempts, malware infections, and data breaches.
What are some common WAN monitoring tools?
Common WAN monitoring tools include network performance monitoring software, traffic analysis tools, and security monitoring tools.
How often should WAN monitoring be performed?
WAN monitoring should be performed regularly, ideally on a continuous basis, to ensure optimal network performance and security.
What are some best practices for WAN monitoring?
Best practices for WAN monitoring include establishing performance and security baselines, regularly monitoring network performance and security, automating monitoring where possible, and conducting regular network audits and assessments.
