In our Network Monitor Tools Comparison Guide, we declared SolarWinds Network Performance Monitor 10 (NPM) the king of the ring against five other competitors.
In this article we’ll take a closer look at the newest version (10.4) with an in-depth evaluation.
Update: Since we last reviewed SolarWinds NPM a plethora of updates have been added to the latest versions including:
- IPv6 Support
- Hardware health monitoring
- Drag-and-discover, real-time performance charts for key stats
- WMI Polling
- Expanded F5, Juniper, HP Procurve, Alaxala, & Apresia support
- Alerts for custom UnDP table pollers
Installation and Discovery
It’s easy to deploy the new version of NPM. Just make sure that your server has IIS installed before you kick off NPM setup. If IIS isn’t installed, you’ll be prompted to exit the NPM setup and install IIS before proceeding.
Next, add devices to the monitor by running network discovery. By logging in to the web-console admins can configure SNMP settings, and then kick off the discovery process.
Discovery has several configurable options. For starters, configure the scan to search a specific subnet, or even just a single address. “Hop count” allows control over how far NPM will scan beyond the source subnet, allowing you to limit the range of your scan.

SolarWinds Network Performance Monitor 10.4 SNMP Discovery Settings
Great UI
NPM has always had a great UI. It’s very intuitive to use, and easy to find information you’re looking for by drilling down to node details. Drill down even further to investigate specific variables like memory or disk usage.
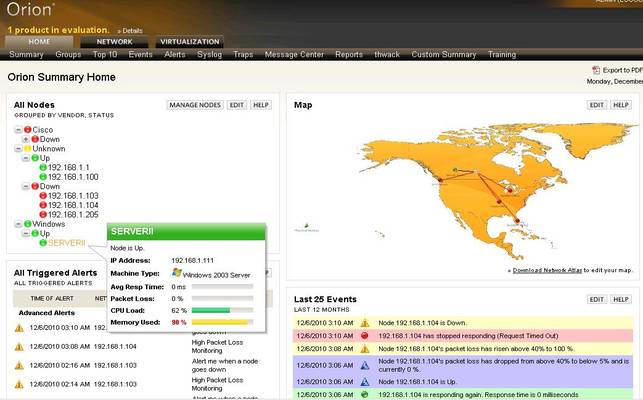
The dashboard provides a useful summary of your network’s performance and availability status at a glance. It’s fully customizable and displays current alerts, recent events, node lists, network maps, and more by default. Hover over any node for a pop-up window displaying key metrics.

The NPM dashboard shows a summary of alert and events. It also has pop-up screens for individual devices.
The node details screen is customizable just like the dashboard, giving users the ability to design the console to provide information that they need the most.

NPM allows you to customize your display for nearly every screen.
Clicking on any chart provides the option to customize the chart. Charts can be modified for custom date ranges, titles, and data.
On the downside, there are still some flaws in the UI. Some components are still not fully integrated into the web console. For some tasks you’ll still need to log in to your server and use the old Windows application – for instance when configuring alerting. In the past, SolarWinds has told us that this is a hold-over from earlier versions of the product, and that they intend to move everything to the web-console over time. It would be nice to see that happen, especially for things like alerting that most admins use every time staff changes.
ConnectNow Automatic Network Mapping
ConnectNow is a new feature that helps to automate network mapping. Simply drag and drop devices onto the network map, then click the ConnectNow button, and NPM will automatically map connections between all of those devices.
Users can add their own custom backgrounds. For example, an admin could use floor-by-floor building map to track status of all of their switch stacks. Once maps have been created, it’s simple to tell NPM to display that map on the dashboard.

ConnectNow helps to automate network diagrams, for fast network mapping.
Group Dependencies
“Group dependencies” is a useful new feature designed to prevent alert flooding. A large number of alerts can be generated when a core device, like a switch or firewall, fails. Normally, NPM would send one alert for each unreachable node connected to the core switch – even though the root cause was a single failure. All those alerts create noise that make it difficult to find the real problem, and they could even make it hard to see other legitimate alerts.
Group dependencies allow administrators to specify a “Parent” node. Then, “Child” nodes are associated with the parent, so that when the parent device fails, only a single alert is triggered, rather than 50 alerts for each of the devices connected to the parent.
This is a great feature, but it feels like the implementation needs tuning. Defining a parent is straightforward. But, the problem arises when attempting to add children.
NPM will only let you add a single child or a single group. It does not give the option to create a list by picking a number of children. So, if you’re like me, you exit the configuration screen, and go create some groups, then come back and attempt to define children. Why is this not a single step process, with group creation built in to the dependencies interface?
Virtualization Support
A great new feature is native support for VMware, making it easier to manage virtual environments right from NPM. The new virtualization screens display information on all of your vCenters, clusters, and individual VMs. NPM’s native support for VMware comes about through use of the VMware API instead of SNMP.
The API is now used to gather information on everything except interfaces, volumes, and individual VMs. Unfortunately, this capability doesn’t extend to Microsoft Hyper-V. SolarWinds has stated that they’re considering adding this same functionality for Hyper-V, but that it’s not something they can commit to yet. Hopefully that’s something we’ll see soon to round out support for virtualization.
In the meantime you’ll have to monitor Hyper-V environments using SNMP.

NPM 10.4 has native support for VMware.
VSAN Monitoring
NPM also has new virtual storage area network (VSAN) monitoring and reporting modules. VSAN traffic is easy to monitor, including information on how much traffic is passing through each VSAN. Users can also quickly see which ports belong to each VSAN, and how much traffic is passing through individual interfaces.
Alerting can be configured on VSANs, just like for other nodes.

NPM10-VSAN Monitor
Mobile Access
Just received an alert that you need to check on ASAP? Do you plan on accessing NPM from a common smartphone, like the iPhone, Blackberry, or Android? NPM includes a useful mobile web-client. A simplified display helps to focus attention on alerts and other key items. Users can switch to a full view if more information is needed.

NPM’s mobile view.
Reporting
NPM allows users to schedule and export PDF reports. This is a great way to document monthly stats for SLA reporting, especially for uptime and availability reports. Reports are highly customizable too. The NPM report writer allows users to write their own reports using SQL. And, many customized reports have been created by other users and posted to Thwack, the SolarWinds online community.
Reporting is also built in to the web console. But the report center is still frustrating to use at times. True, there are a large number of reports available. But, it’s difficult to run ad hoc reports on specific devices or groups. And, the report centre won’t generate graphic charts; data is still presented in a table format.
Of course, you can build those reports yourself using the report writer. And, charts are available for some statistics under individual node details. But, it would be great to have the option to run simple, customized reporting from a single screen.
Other Features in NPM 10.4
NPM is filled with many outstanding features that have been carried forward from previous versions. Just a few examples: it makes a great Syslog or SNMP trap server. NPM supports things like Cisco Energywise reporting, wireless access-point polling, and it is scalable.
It also integrates nicely into the Thwack community exchange. Thwack is SolarWinds’ online community where users have shared everything from support tips, to custom SNMP device pollers.

NPM supports Cisco EnergyWise reporting.
Speaking of pricing, NPM licensing starts at $2,675 (USD), to monitor 100 interfaces. Functionality expands through add-on modules at extra cost. Modules add support for NetFlow reporting, IP address management, and application performance monitoring, to name a few.
SolarWinds has a live demo server that you can access from their website, or you can download a free 30 day trial and test it on your own network.
To sum it all up: SolarWinds has done a great job on NPM 10.4. This is definitely the best version of NPM to date.
NPM performs well, and has many features that can help administrators manage their networks. True, we found a few flaws and reporting could still use improvement. But, the cons are relatively minor compared to the power that this software provides. If you’re thinking about rolling out network management software, then SolarWinds NPM is worth a look.
Download a 30-day free trial version.
Product: SolarWinds Network Performance Monitor 10.4
Review Date:
Rating: 4.5 

Pros:
- Excellent UI design
- Customizable, automated network mapping
- Great community support from Thwack
- Mobile access
- Native VMware support
Cons:
- Can’t configure alerts from the web-console
- “Group Dependency” configuration is clumsy
- Reporting module needs better ad-hoc reports
- No native support for Microsoft Hyper-V – SNMP only
SolarWinds Network Performance FAQs
What features does SolarWinds NPM offer?
SolarWinds NPM offers a range of features, including real-time network performance monitoring, network device discovery and mapping, customizable dashboards and alerts, network traffic analysis, and capacity planning tools.
What types of networks can SolarWinds NPM monitor?
SolarWinds NPM can monitor networks of any size and complexity, from small office networks to large enterprise networks spanning multiple locations.
What types of devices can SolarWinds NPM monitor?
SolarWinds NPM can monitor a wide range of network devices, including routers, switches, firewalls, servers, and virtual machines.
What types of metrics can SolarWinds NPM monitor?
Metrics that can be monitored in SolarWinds NPM include network bandwidth usage, packet loss, latency, device availability, CPU and memory usage, and application performance.
Can SolarWinds NPM be customized?
Yes, SolarWinds NPM can be customized to meet the specific needs of an organization, with customizable dashboards, alerts, and reports.
How does SolarWinds NPM handle network device discovery and mapping?
SolarWinds NPM uses a range of discovery methods, including SNMP and WMI, to discover and map network devices and interfaces.