UPDATE: The Orion NPM 9.5 offering has been superseded by newer versions. This post is being retained for posterity and archival purposes. If you need the functionality mentioned in this post, try a 30-day free trial of SolarWinds Network Performance Monitor.
When your users can’t access your Exchange server, who knows first?
a) You
b) Your users angrily calling the helpdesk?
If the answer is b, then you need to get some monitoring tools in place! A good network monitor will alert you when your network or servers go down, and you can have the problem fixed by the time users call the helpdesk. You’ll look like a hero, and your users will be happier.
One tool worth considering is the Orion Network Performance Monitor (NPM) from SolarWinds. NPM is the core of SolarWinds’ Orion suite of network management tools. It’s a performance monitoring and alerting tool that can monitor all of your servers and network devices.
Installation
Orion NPM has pretty hefty hardware requirements, so don’t try to load it on that old Compaq workstation in the corner. You will need a dedicated monitoring server, and ideally a separate SQL database server. If you don’t have a dedicated SQL server Orion NPM will install a local SQL server as part of the installation.
Installation itself is straightforward, and at the end you’re immediately presented with a login screen to your new NPM web-interface. The product is primarily administered from the well designed, feature-loaded web interface.
Features
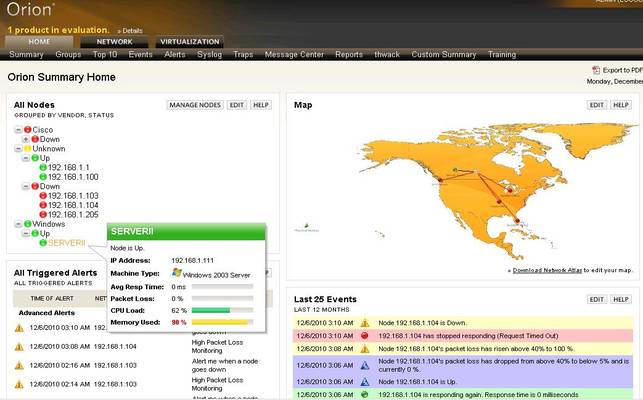
Orion NPM is highly customizable and easy to use. The Home page displays an at-a-glance status report on your entire network, including a customizable network map. In the example below I placed my lab routers on a large WAN style map, but you could easily use your building diagram to map switches and devices to each floor for an instant view of your LAN.

Orion NPM Main Dashboard
The Top 10 page displays an at a glance look at devices on your network. Highest response time, interface utilization, and CPU load are all displayed by default.

Orion NPM Top 10 Screen
NPM will act as your Syslog and your SNMP trap server. Simply configure your network devices to send Syslog message to NPM, and it will store them for easy searching and filtering when needed.

NPM can be your Syslog Server
Alerts: Use the Alert tools to notify you instantly when your servers go down. When a thresholds is exceeded NPM can send email, run scripts, or perform many other actions.

Configure Alerts to email you when servers go down.
The Node Detail page is a major strength of NPM. It can be accessed using a “drill-down” method from many of the other screens, like the Top 10 list. The display shows a dashboard style view with gauges for CPU Load, Packet Loss, and more. This will likely become one of the first places you look if you suspect a device has problem, or if you notice an alert trigger.

NPM Interface Dashboard
Other goodies are too many to mention, including the ability to monitor your wireless networks for rogue access points, and an EnergyWise monitor to help you manage power consumption in your data centre. There’s also a reporting centre to help you generate reports to show your management how good of a job you’re doing.
NPM will scale to support a large distributed enterprise with the addition of a few additional components like the Enterprise Operations Console, and additional polling engines.
Thwack
Stuck trying to figure out how to solve a particular problem? Odds are that you aren’t alone, and SolarWinds knows that. As a solution they’ve integrated their Thwack online community into the NPM console. If you have a problem you can click on the Thwack tab, post a question to the community, and receive responses without ever leaving NPM.
How responsive is Thwack? While testing the software, I ran into a couple of questions that I couldn’t answer. I searched Thwack, and was surprised to find solutions to both problems posted by both SolarWinds engineers and customers. One of the solutions even included some custom code that the SolarWinds rep had whipped up.
Some Drawbacks
Reporting is a little weak out-of-the-box.
NPM has a number of canned reports that cover metrics like availability and average interface utilization. But, overall I found the number of reports to be minimal. Granted, you can write your own reports in the Report Writer module, and a large number of reports are available as user generated content on Thwack. But it would be nice to have a wider selection of reports out of the box.
Related to the point above, there is no ad-hoc graphical trend reporting in the reporting module.
Report output is usually a table, as in the screenshot below. Obviously this works well for some metrics like Availability, but not so well for others – like bandwidth utilization over several days.
NPM can display a graph based on trend information from the database, but this requires customization after the fact. Alternatively, graphs can be accessed using custom web-views that can be configured for your users. This provides an interactive, graphical view where you could report on trends like bandwidth utilization.
So the functionality is all there, it’s just a matter of how much time you want to spend customizing the product. Given that many network admins will want MRTG-style trend reports, it would be nice to see this in the default feature-set.

Sample NPM Availability Report
Alerts can’t be configured from the web-console.
Alerts must be configured from the stand-alone alerting application, which is installed by default with NPM. It’s a little annoying to open a separate application to configure something that most admins will want to use.
When asked about this, a SolarWinds’ rep indicated that they’ve been moving functionality from the older Win32 app to the web console with each release. Currently configuring alerts still remains in the Win32 application, but this may change in future releases.
Modular design means that some key features are missing from the NPM.
This could be either a pro or con depending on your point of view. SolarWinds offers a number of additional Orion modules that integrate with NPM. Some examples are the NetFlow analyzer, IP Address manager, and the Network Configuration Manager. So, you can look at this either as a huge cost savings because you don’t pay for features you’ll never use – or a major frustration because you discover that a feature you need, like NetFlow, costs extra. Then it’s back to the boss’ office for spending approval.
I recommend you review and understand which features you require for your initial purchase, so that you can save yourself the administrative hassles around getting purchasing approvals later.
Orion Network Performance Monitor pricing starts at $2475, which can monitor up to 100 elements; and the price increments up to $20975 for unlimited element monitoring. SolarWinds has a live demo server that you can access from their website, or you can download a free 30 day trial and test it on your own network.
The NPM is a solid, well designed tool that can help make your job of managing the network easier. If you’re looking for a way to make your network more reliable while also making your job easier, then you should definitely consider downloading the Orion Network Performance Monitor.
Download here.
Product: SolarWinds Orion Network Performance Monitor 9.5
Review Date:
Rating: 4 
![]()
Pros:
- Easy to use Web Console
- Versatile, feature rich & customizable
- Strong support through Thwack
- Scalable for large networks
- Alerts notify you when critical systems go offline
Cons:
- Reporting is weak out of the box
- Requires additional modules for full functionality
- Can’t configure Alerts from Web Console
- Requires customization to unlock true potential