When most people think of German engineering, they usually think of well-made luxury cars. But, German engineering is also responsible for producing a wide range of software.
One example is Paessler, makers of the PRTG Network Monitor. PRTG is a network monitoring system that’s well worth a look. Features range from basic SNMP monitoring and alerting, to Netflow collection, and packet capture.
Features:
Easy Setup
Installing PRTG was fast and simple. PRTG uses its own proprietary database which is installed along with the core suite. No separate SQL installation is required.
Once installed it’s easy to add devices manually, or using automatic network discovery.
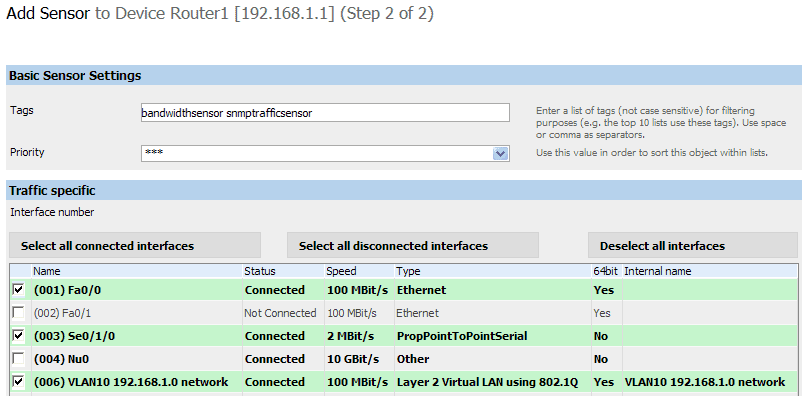
PRTG uses “sensors” to monitor devices. Once a device has been added, sensors must be configured to gather information.
Examples of sensors would be CPU utilization or hard disk space monitors.
Fortunately you don’t need to know exactly which sensors to configure. Even when adding devices manually, users can still opt to auto-discover the device type.
PRTG will build a sensor list unique to that device.

Add sensors to devices
Dashboards
PRTG has several built-in dashboards that help you view your network at a glance. Dashboards help to gather information on alarms, outages, and warnings into a single pane.
This allows administrators to identify trouble spots, and drill down for more information.

PRTG Dashboard
Hovering the cursor over various sensors will pop-up a chart for that statistic – so it’s easy to spot trends and potential problems.

Popups make it easy to find network problems
PRTG has both an HTML front-end, as well as a full windows GUI.
In practice it’s generally simpler to use the GUI for configuring the system.
The response is a little snappier. It’s also more intuitive and has helpful right-click context sensitive menus. But, the Web interface is well designed too, and very capable.
An optional iPhone interface is available for admins on-the-go.
Monitoring Options
PRTG can handle nearly any type of monitoring you can throw at it. Some of the types of monitoring supported are:
- SNMP
- WMI
- Application monitoring – SQL, Exchange, HTTP, to name a few
- Virtual servers
- Netflow/jFlow/sFlow
- Packet Sniffing for detailed network troubleshooting
And, it also includes the ability to configure “remote probes.” Remote probes can be installed at remote sites to monitor devices at that location, and report back to your central PRTG server. Unlimited remote probes are included in the base software license.

PRTG

PRTG Bandwidth Monitoring
Alerting
A network management system wouldn’t be much good if it didn’t alert administrators to problems. PRTG meets this need too.
Admins can set alerting options after adding devices and configuring sensors.
Alerting options include the usual methods: email alerts, send SMS text messages, pop up messages, run scripts, and more.
Alerting is very customizable. Some options include:
- Threshold alerts – trigger when a variable is exceeded for a specified number of minutes.
- Up/Down alerts – based on loss of connectivity.
- Dependencies – link devices to each other to minimize alert floods – so when your switch fails you don’t receive 50 alerts for the servers connected to it.
- Scheduling – configure certain alert types not to trigger – for instance at night

Configure PRTG alerting to send email and more
PRTG Alert Window
Map Designer
The built-in map designer can help admins visualize the network. Devices can be added to the map, and easily identified thanks to a large icon library.
Once the map has been created, each icon can be linked to a device already known to PRTG. This allows status icons to be displayed right on the map, and would be great for a high-level dashboard.

The PRTG Map Designer
Unfortunately the map designer is a little clumsy to use, and adding many devices would take a long time. It would be nice if the designer allowed a faster way to draw devices that have already been added in PRTG, rather than having to drop them onto the map one at a time. Another drawback: it doesn’t automatically add links between devices, and doesn’t indicate link up/down status.
Reporting
Need to run an SLA report, or find out which devices are low on memory or disk space? No problem. A wide range of report templates are included with PRTG. Many more reports can be customized and run ad-hoc.
Reports can be scheduled to run on a regular basis – say at night when the server isn’t as busy.

PRTG Reporting Options

Uptime Reporting with PRTG
Our Opinions
The feature list is great, but how well does it actually work?
PRTG performed very well in testing. Setup was really as simple as claimed, though auto-discovery worked much better than adding devices manually. Both the web-interface and GUI are well designed and logical. It’s always easy to find the information that you’re looking for.
Manually adding devices is a little painful – each time a sensor is added the GUI likes to pop-up an event viewer to tell you that you just added a sensor. It becomes annoying very quickly. Auto discovery was much smoother – even in semi-automatic mode where devices are added manually, but PRTG decides which sensors to add.
Monitoring is great – the sheer number of different sensor types means that there will be some way to manage just about everything on the network. Once again, the only real complaint here is related to configuration. PRTG boats more than 80 sensor types – but some of them have rather obscure names. Trying to determine which sensors apply to a specific device can be difficult – so probably best to just let PRTG’s auto discovery do it for you.
One area could use improvement: the ability to create custom dashboards. There are several different default dashboards included. But, administrators tend to like configuring the dashboard to show top 10 lists and other information that they need. There doesn’t appear to be a simple way to reconfigure the dashboard without getting into HTML editing.
The only feature that seems to let down the generally high quality is the map designer – the entire design interface simply felt clumsy and slow. Hopefully this is something that improves in future editions.
Editions and Pricing
PRTG is available in several editions. First, if you have a very small network then PRTG could be free – the freeware version supports 10 sensors, and that can be doubled if you’re willing to do a little free PRTG advertising on your website.
PRTG licensing is both complicated and simple at the same time. It is complicated because it is priced by the sensor – and every device being monitored will need multiple sensors. This can suck up the license pool very quickly.
But at the same time, licensing is simple because it includes many options that other vendors tack on as add-ons. Features like remote probes, Netflow monitoring, packet sniffing, application monitoring, and even ability to run PRTG as a high-availability cluster are all included in the license cost.
And licenses are priced well – 1000 sensors will cost $1850(USD). Or spring for the unlimited license at $4700(USD) and monitor your whole network. Full details on pricing can be found here.
But, the best place to start is with the trial version. Download the free 30-day trial and take PRTG for a test drive. We are pretty impressed with this example of German engineering, and we think you will be too.
Product: Paessler PRTG 8
Review Date:
Rating: 4.5 

Pros:
- Low price
- Flexible monitoring for apps, networks and more
- Includes many useful features at no extra cost e.g. Netflow, high-availability, remote probes
- Flexible alerting, comprehensive reporting
Cons:
- Map designer falls short
- Dashboards not easily customized
- Manually configuring sensors is not recommended