Imagine, for a minute, that you’re running a large restaurant. At any given time dozens of things could demand your attention. Over at table two, a guest has been waiting for a server for 10 minutes and is starting to get grumpy. The bar has run out of lager. Your point-of-sale system starts acting up. Table twelve just sent their food back to the kitchen because they received the wrong order…and on and on…
![]() Large enterprises face much the same scenario on a daily basis. The web-cluster has a performance problem; mail is not delivered as expected; WAN sites lose network connectivity, or become slow. The emergency bottle of Coke in your desk runs dry! The challenge is to identify and focus on important problems, when there is so much noise and commotion generated by the sheer volume of devices on the network.
Large enterprises face much the same scenario on a daily basis. The web-cluster has a performance problem; mail is not delivered as expected; WAN sites lose network connectivity, or become slow. The emergency bottle of Coke in your desk runs dry! The challenge is to identify and focus on important problems, when there is so much noise and commotion generated by the sheer volume of devices on the network.
CA eHealth Performance Manager helps to meet that challenge. eHealth is best viewed as a suite of products. The suite can provide a range of capabilities through optional components: automate troubleshooting and root-cause analysis through something called “Spectrum”, monitor flow data with “Traffic Accountant”, measure application response times, and more. But for now let’s focus on two key components of the suite that can make monitoring and troubleshooting easier for large enterprises: the core CA eHealth Performance Manager, and the LiveHealth add-on.
The eHealth/LiveHealth combination meets a couple of important needs. For one, the Live Exceptions and Live Trends modules help enable proactive network monitoring. And second, it provides a tremendous amount of reporting while maintaining a simple, clean user interface.
Live Exceptions and Live Trends
Live Exceptions is the heart of LiveHealth. It gathers information from the network, then alerts administrators to problems via usual methods like email and programmatic alerts. Alerts can be triggered for hard outages like loss of communication with a device, or for exceeding thresholds like high bandwidth utilization.
This is one of the unique features of the suite, because alerting can be configured to use CA’s Time-Over-Threshold (TOT) or Deviation-From-Normal algorithms. Some tools create a lot of noise by generating a number of alerts in a row, each time a threshold is crossed. For example: minor temperature swings above threshold, then below, then above again. TOT can help by alerting only for persistent problems – for example a temperature rise above threshold that stays up for a specified period of time. You can read more about the alerting algorithms in CA’s eHealth technology brief.

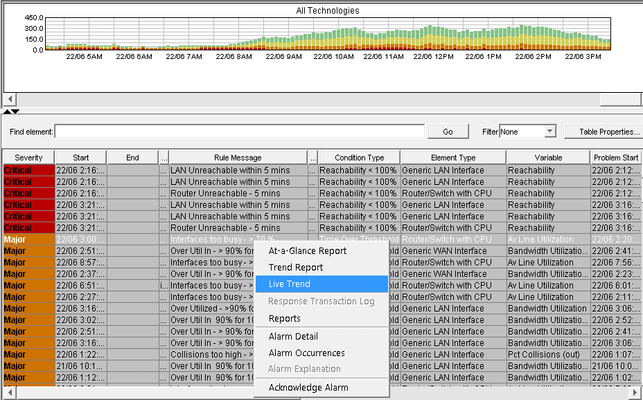
Live Exceptions Monitoring Screen
Once an alert has been generated, administrators can drill down to view live trending data using, you guessed it: Live Trends. This is exactly what it sounds like – an instant view of device status, refreshed every polling cycle.

LiveTrend – Device Status Viewer
Live Status
Live Status is a dashboard application that works along with the Live Exceptions module. It provides a graphical view of your network using a fishbone chart, which allows you to sort devices into groups. Each network node is represented with a color-coded indicator light. Green is good, anything else is bad. In the screenshot below you can see one node on the lower half of the chart shows a yellow “minor” alert status. Clicking on the problem node will provide the option to jump to other modules for more information, or to generate instant reports.

Live Status of Network
Reporting
Reporting is where eHealth really shines. It works well whether you are using it to identify unusual behaviour for troubleshooting, or if you just want to gather historical SLA data like uptime. The reporting interface is surprisingly simple to use for such a complex product. It can report on multiple elements, or groups of elements, and create a number of different chart types (Line, Bar, Stacked Line, etc). Useful pre-configured reporting windows include ranges like “Today”, or “Previous 7 days”, in addition to custom date ranges.
(Terminology note: Like other network management products, eHealth uses elements to refer to the components of a system being monitored – for instance every interface on a router is an element. The actual statistics being monitored are variables – e.g. Uptime, or Temperature.)
At-a-Glance Reports
At-a-glance reports are the ideal first-look troubleshooting tool. At-a-glance reports provide a fast view of a number of key variables – CPU and memory utilization, network use, and errors to name just a few.

Trend Reports
Trend reporting can be generated against multiple elements or variables, and can show statistics for multiple variables over a period of time. Trend reports are great for baselining system performance when troubleshooting and preparing for upgrades.

eHealth Trend Report – Chart
Trend reports can also be generated in a table form, useful for reporting on uptime for SLAs, or 95th Percentile usage stats for billing purposes.

eHealth Trend Report – Table
MyHealth Customized Reports
MyHealth reports are tailored reports that can be scheduled to run on a regular basis. The reports are basically a collection of trend reports that are relevant to a specific user group. Network administrators may want one collection of reports, while database administrators use an entirely different set.

Sample MyHealth Report
Observations and Conclusions
In addition to everything already mentioned, eHealth supports all of the regular features an enterprise would expect – multiple user accounts, Active Directory authentication, and scalability, to name a few. eHealth claims to support up to 1 million elements, and has certified a long list of devices from many hardware and software manufacturers.
But eHealth isn’t perfect. For one, its sheer complexity raises some interesting support problems. This is not a package you can install and forget about. Any enterprise planning to roll out eHealth will need trained support staff, and likely a dedicated support team. Installing the system requires considerable planning and time, and hiring a consultant to get it right the first time is probably a good idea.
System requirements will be hefty too – especially if you plan to take full advantage of the reporting capabilities and keep historical data. Even with a five-minute polling interval, monitoring a large number of elements will chew up a lot of disk space. Fortunately data can be rolled-up to longer sample intervals after a period of time, but at the cost of granularity.
If your organization has any complexity, then you’ll also find that eHealth is not a one-tool solution. eHealth doesn’t do a good job of helping administrators pay special attention to those parts of your infrastructure that are slightly more important than the others – like your data centre. It would be nice to have the ability to have more than just a dashboard warning light. In particular, it would be useful if eHealth could build network maps that can show connections between those key routers, firewalls, and servers – along with whatever key statistics you require. But for this you’ll need other tools. Then again, that’s not unreasonable for large environments.
And speaking of other tools, there is no support for syslog storage, or for that matter a way to view and filter on SNMP logs. Considering that the system is collecting SNMP information anyway, it would be helpful if the interface allowed users to view SNMP logs for devices. This would save administrators the extra steps of logging onto their devices to check log files – or worse, risk losing logs on a network device because it was rebooted.
In spite of these drawbacks though, eHealth is still a winner. eHealth is a phenomenal tool for large enterprises. It helps to cut through the noise and identify real problems – so administrators can focus their time on the important things. It also provides one of the most comprehensive reporting engines in the business, and somehow manages to be useful to a wide range of users: administrators, data engineers, IT system planners, billing management, and service managers.
View flash demo of Performance Manager here.
Product: CA eHealth Performance Manager 6.1
Review Date:
Rating: 4.5 

Pros:
- Great for large enterprises
- Alerting algorithms help focus on important problems
- Detailed and highly flexible reporting abilities
Cons:
- Complexity
- Not a “one-tool solution”
- No integrated SNMP or Syslogging capability
CA did not provide pricing for eHealth at the time this article was published.
CA eHealth Performance Manager FAQs
What types of metrics can CA eHealth Performance Manager monitor?
CA eHealth Performance Manager can monitor a wide range of network performance metrics, including network availability, bandwidth utilization, response time, and error rates.
What types of organizations can benefit from using CA eHealth Performance Manager?
CA eHealth Performance Manager can benefit organizations of all sizes and industries that rely on network infrastructure for their operations. It is particularly well-suited for large and complex network environments.
How does CA eHealth Performance Manager differ from other network performance monitoring tools?
CA eHealth Performance Manager offers a range of advanced features and capabilities, including the ability to monitor network performance in real-time, generate detailed reports and analytics, and integrate with other network management tools.
What types of network infrastructure can CA eHealth Performance Manager monitor?
CA eHealth Performance Manager can monitor a wide range of network infrastructure, including routers, switches, servers, and applications.
What types of reports can be generated with CA eHealth Performance Manager?
CA eHealth Performance Manager can generate a wide range of reports, including executive summaries, detailed performance reports, and trend analysis reports.
Can CA eHealth Performance Manager be integrated with other network management tools?
Yes, CA eHealth Performance Manager can be integrated with other network management tools, such as CA Spectrum and CA Performance Management.
Is CA eHealth Performance Manager still supported by CA?
No, CA eHealth Performance Manager has reached its end-of-life and is no longer supported by CA. Customers are encouraged to migrate to CA Performance Management for advanced network performance monitoring and management capabilities.